
Abstract
Background:
Blood glucose and insulin exhibit coordinated daily and hourly rhythms in people without diabetes (nonT1D). Although the presence and stability of these rhythms are associated with euglycemia, it is unknown if they (1) are preserved in individuals with type 1 diabetes (T1D) and (2) vary by therapy type. In particular, Hybrid Closed Loop (HCL) systems improve glycemia in T1D compared to Sensor Augmented Pump (SAP) therapies, but the extent to which either recapitulates coupled glucose and insulin rhythmicity is not well described. In HCL systems, more rapid modulation of glucose via automated insulin delivery may result in greater rhythmic coordination and euglycemia. Such precision may not be possible in SAP systems. We hypothesized that HCL users would exhibit fewer hyperglycemic event, superior rhythmicity, and coordination relative to SAP users.
Methods:
Wavelet and coherence analyses were used to compare glucose and insulin delivery rate (IDR) within-day and daily rhythms, and their coordination, in 3 datasets: HCL (n = 150), SAP (n = 89), and nonT1D glucose (n = 16).
Results:
Glycemia, correlation between normalized glucose and IDR, daily coherence of glucose and IDR, and amplitude of glucose oscillations differed significantly between SAP and HCL users. Daily glucose rhythms differed significantly between SAP, but not HCL, users and nonT1D individuals.
Conclusions:
SAP use is associated with greater hyperglycemia, higher amplitude glucose fluctuations, and a less stably coordinated rhythmic phenotype compared to HCL use. Improvements in glucose and IDR rhythmicity may contribute to the overall effectiveness of HCL systems.
Introduction
In people without diabetes, blood glucose, insulin, and other metabolic outputs (eg, glucagon) are rhythmically regulated at multiple timescales.1-4 Prominent timescales include the day (circadian rhythm(s); CR, 23-25 h)5-7 and within-a-day (ultradian rhythm(s); UR, ~1-6 h).2,4 CRs are maintained by a hierarchy consisting of a master brain clock in the suprachiasmatic nucleus of the hypothalamus that coordinates the activity of subordinate central and peripheral cellular oscillators.8-11 Although mechanisms of UR generation are still under investigation, these oscillations are nearly ubiquitous in metabolic and endocrine systems and are thought to be generated centrally and reinforced peripherally.12-14 At both timescales, exogenous signals such as food intake and light act as cues to synchronize internal systems with respect to the 24 h day.5,15-20
Stability and in-range amplitude of CRs and URs are associated with better health outcomes. At the CR timescale, stable sleep-wake schedule and time restricted eating are associated with improved glycemia in individuals without diabetes and in those with type 2 Diabetes (T2D).15,21-24 Circadian oscillators within pancreatic beta islet cells modulate insulin secretion throughout the day, with disruption to these rhythms resulting in oxidative stress and diabetes in animal models.25-27 Additionally, time of day modulates the response of muscle and adipose tissue to insulin, with more efficient glucose uptake during the daytime hours.28,29 At the UR timescale, a pulse of glucose followed promptly by a pulse of insulin can more expediently trigger glucose uptake, thereby preventing glucose from rising out of the euglycemic range. 5 Conversely, a pulse of glucose followed by a delayed or blunted pulse of insulin is more likely to result in hyperglycemia, 30 a dynamic observed previously in individuals with T2D. 31 Together, metabolic health does not merely reflect healthy levels of key factors, but coordinated rhythmic patterns of intake, absorption, and production.
Biological rhythms and coordination of glucose and insulin have been studied only to a limited extent in people with T1D, with previous studies largely restricted to modeling.32-35 People with T1D likely exhibit widely varying glucose and insulin dynamics in comparison to nonT1D and T2D individuals, due to the latter’s temporal pattern of endogenous insulin production and sensitivity. As a result, understanding (1) the timing of glucose and insulin delivery fluctuation, and (2) any preservation of endogenous glucose rhythms in people with T1D, is critical for understanding the efficacy of current treatments and designing effective future therapies.
For people with T1D, insulin is delivered exogenously under varying protocols, ranging from multiple daily injections, to Sensor Augmented Pump (SAP) therapy and Hybrid Closed Loop (HCL) therapy. In SAP therapy, an insulin pump delivers a pre-programmed basal rate of insulin which is supplemented by manual bolusing as needed for meals or corrections. In HCL therapy, glucose data are fed into an algorithm that directly determines insulin delivery adjustments up to every five minutes and is supplemented by manual bolusing for meals by the user. This process allows for frequent adjustment of insulin delivery, greater personalization, and is associated with greater safety, improved glycemia, and superior A1c as compared to SAP therapy.36-48
Much remains to be learned about how T1D therapies temporally coordinate with metabolic physiology, the mechanisms responsible for the particular effectiveness of HCL, and how the growing diversity of HCL systems could be further improved. A key difference between SAP and HCL systems is that, in SAP therapy, glucose does not automatically influence insulin administration, whereas, in HCL therapy, glucose algorithmically determines insulin delivery. A possible downstream effect of these two methods of insulin administration is a difference in temporal coordination between glucose and insulin delivery rate (IDR) which may generate differences in the amplitude and stability of glucose rhythms. Understanding potential rhythmic differences between users of SAP and HCL and any relationship between rhythmicity and glycemia may enhance our understanding of how HCL achieves its success and suggest avenues for future improvements and personalization.
T1D rhythmicity can now be studied for the first time in a large, longitudinal dataset of SAP and HCL continuous glucose monitor (CGM) and insulin pump data to better characterize therapy outcomes beyond A1c and time in range. Additionally, the increased usage of CGMs by individuals without diabetes now allows for glucose timeseries and rhythmicity comparisons among people with and without T1D. We hypothesized that glycemia and rhythmicity vary widely among T1D individuals, but that HCL system use results in patterns of rhythmic change in glucose and insulin delivery, such as high glucose-insulin delivery temporal coordination and linear correlation relative to SAP.1,2,5,49,50 Specifically we hypothesized that: (1) HCL users would show fewer instances of hyperglycemia compared to SAP, consistent with previous findings;36,37,39 (2) glucose levels and IDR would be more strongly correlated in HCL than SAP users; (3) such coordination, if present, may be associated with greater correlation of rhythmicity at higher frequencies in HCL (as these frequencies of change are enabled stably by HCL systems) than SAP users, and (4) HCL users would exhibit stronger temporal coordination between glucose and IDR compared to SAP users. To examine these possibilities, we used wavelet and wavelet coherence analyses to compare glucose and insulin delivery datasets.
Methods
Ethical Approval and Data Access
T1D data used in this study (1-SRA-2019-821-S-B) were licensed by JDRF from the Tidepool Big Data Donation Project, 51 a type 1 diabetes data organization service. NonT1D data used in this study were made available through Open Humans, 52 a service that allows individuals to anonymously donate their biometric data. 53 Because all data were anonymized and retrospective, IRB approval was not required.
Inclusion Criteria and Data Cleaning
Data were included from SAP and HCL users with at least 1 month of data without gaps of >12 h at any point during the month (n = 89 SAP, n = 150 HCL). In wavelet analyses, data were further restricted to users who consistently logged >4 CGM readings per hour (n = 144 HCL, n = 82 SAP); the vast majority of data points were logged approximately every five minutes. CGM data from n = 16 nonT1D individuals from the Quantified Self Blood Glucose Data Set were included. Data were not cleaned of outliers as we intended to capture all variance within the data but were z-scored for wavelet coherence analyses and wavelet scatter plots. There were no age, sex, or parity restrictions (see Demographic data). Data were interpolated to a standard of five minute resolution for analysis.
Data Analysis
All code and data needed to recapitulate these analyses are available on AG’s Github. 54 Code was written in MATLAB 2020a, 2020b (MathWorks, Natick, MA, USA), and Python 3 (Python Software Foundation, Wilmington, DE, USA). Wavelet transformation (WT) code was modified from the Jlab toolbox and from Dr. Tanya Leise. 55 WT was used to assess the structure of URs and CRs of blood glucose and IDR timeseries, and wavelet coherence was utilized to assess the relationship between rhythms in glucose and rhythms in IDR. In contrast to signal processing methods that transform a signal into frequency space without temporal position (eg, Fourier transform using sine wave components of infinite length), wavelets are constructed with amplitude diminishing to 0 in both directions from center, enabling frequency and amplitude calculation at a given position (see: Supplemental Figure 1).
Additionally, wavelets enable variation of window length when calculating power at different frequencies, enabling more accurate assessment of power at each frequency. Wavelets can assume many functions (eg, Mexican hat, square wave, Morse); the present analyses use a Morse wavelet with a low number of oscillations (defined by β and γ), analogous to wavelets used in previous circadian applications.55,56 Morse Wavelet parameters of β = 5 and γ = 3 describe the frequencies of the two waves superimposed to create the wavelet, and which have successfully been used on biological timeseries.56-58 This low number of oscillations enhances detection of contrast and transitions. The maximum for each point in time within the band of the wavelet matrix rhythms of each hour (eg, 2-3 h) was taken in order to create linear representations of UR WT power over time. Bands analyzed here corresponded with the daily ultradian peak power observed in URs across many physiological systems (2-5 h), with a slight shift (omission of 1 h) and expansion (inclusion of up to 6 h) in supplemental figures to account for the onset and duration of insulin action in people with T1D.12,13,59 The band of the wavelet matrix corresponding to 23-25 h was assessed to represent circadian rhythmicity. Because WTs exhibit artifacts at the edges of the data being transformed, only the WT of the second through the second to last days of data were analyzed further. After WT, wavelet matrices were down-sampled to every 10th point for ease of visualization in scatter plots. Wavelet coherence was assessed using the MATLAB “wcoherence” package by Dr. Aslak Grinsted.60,61 Briefly, wavelet coherence enables the assessment of the extent to which two signals share power at a timescale (here, circadian) at a given moment, and the consistency of their phase relationship.61,62 Thus, coherence between IDR and endogenous glucose rhythms was assessed despite the delay from subcutaneous insulin delivery to absorption into the bloodstream.
Statistics
Distributions of glucose were differentiated by group by extracting skewness of each individual’s proportionally scaled glucose distribution using the MATLAB function “skewness.” A Kruskal Wallis test (non-parametric ANOVA) was then used to compare skewness of individuals by group (HCL vs SAP vs NonT1D). Linear regression was used to generate correlations of z-scored glucose and z-scored IDR, and of glucose and insulin UR power, using the MATLAB function “fitlm.” Area under the curve was used to represent an individual’s amplitude of daily and hourly glucose rhythms and, separately, circadian coherence. Kruskal Wallis tests were used to compare areas under the curve by group for circadian glucose oscillation amplitude and ultradian glucose oscillation amplitude differences from NonT1D “baseline,” and to compare circadian coherences. Each statistic utilized 1 number representing each individual per group, per comparison. Corrections for multiple comparisons used Dunn’s test within the matlab function “multcompare”; where all groups differed significantly, the largest P-value was reported. Findings were considered statistically significant when P < .05.
Results
Demographics
The T1D dataset comprised a wide age range of individuals, most diagnosed with T1D at a young age. Notably, ethnicity data were not collected by Tidepool and reporting of sex was optional. Demographics, including the percentage of individuals who opted not to report sex in each group, are listed in Table 1.
Demographics. Age, Sex (when listed), and Years Living with Diabetes of Individuals by Group.
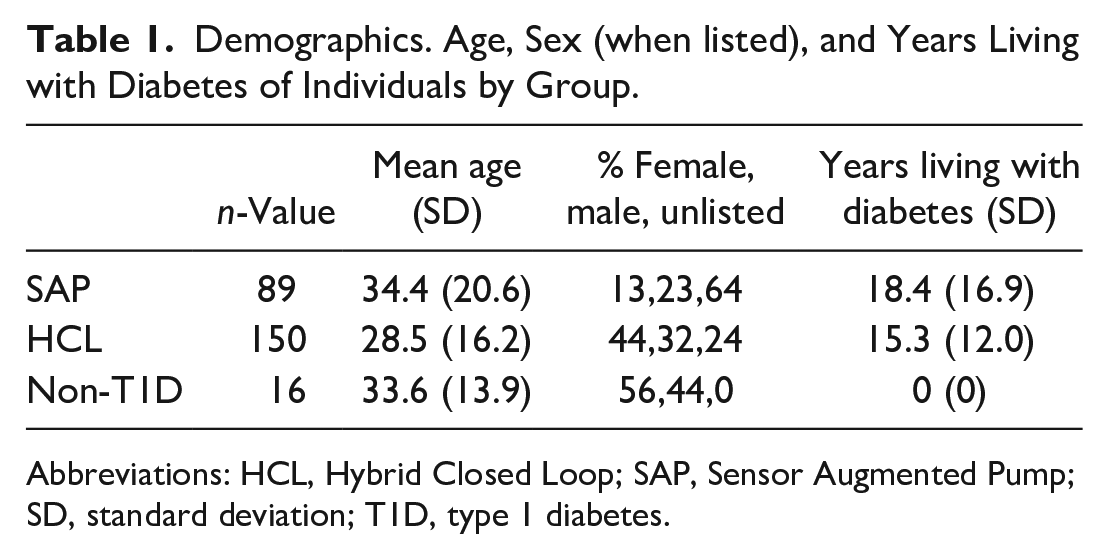
Abbreviations: HCL, Hybrid Closed Loop; SAP, Sensor Augmented Pump; SD, standard deviation; T1D, type 1 diabetes.
HCL Use Is Associated With Improved Glycemia
HCL use reduces hyperglycemia.36-39,63-67 Specifically, SAP system users exhibit a broader, right shifted distribution of glucose in comparison to HCL system users, indicating greater hyperglycemia (>7.8 mmol/L); SAP, HCL, and nonT1D glucose distributions differed significantly from one another (χ2 = 57.86, P < 3 × 10⁻⁴). Hypoglycemia was rare in both T1D datasets (<5% of all data points for either group) (Figure 1).
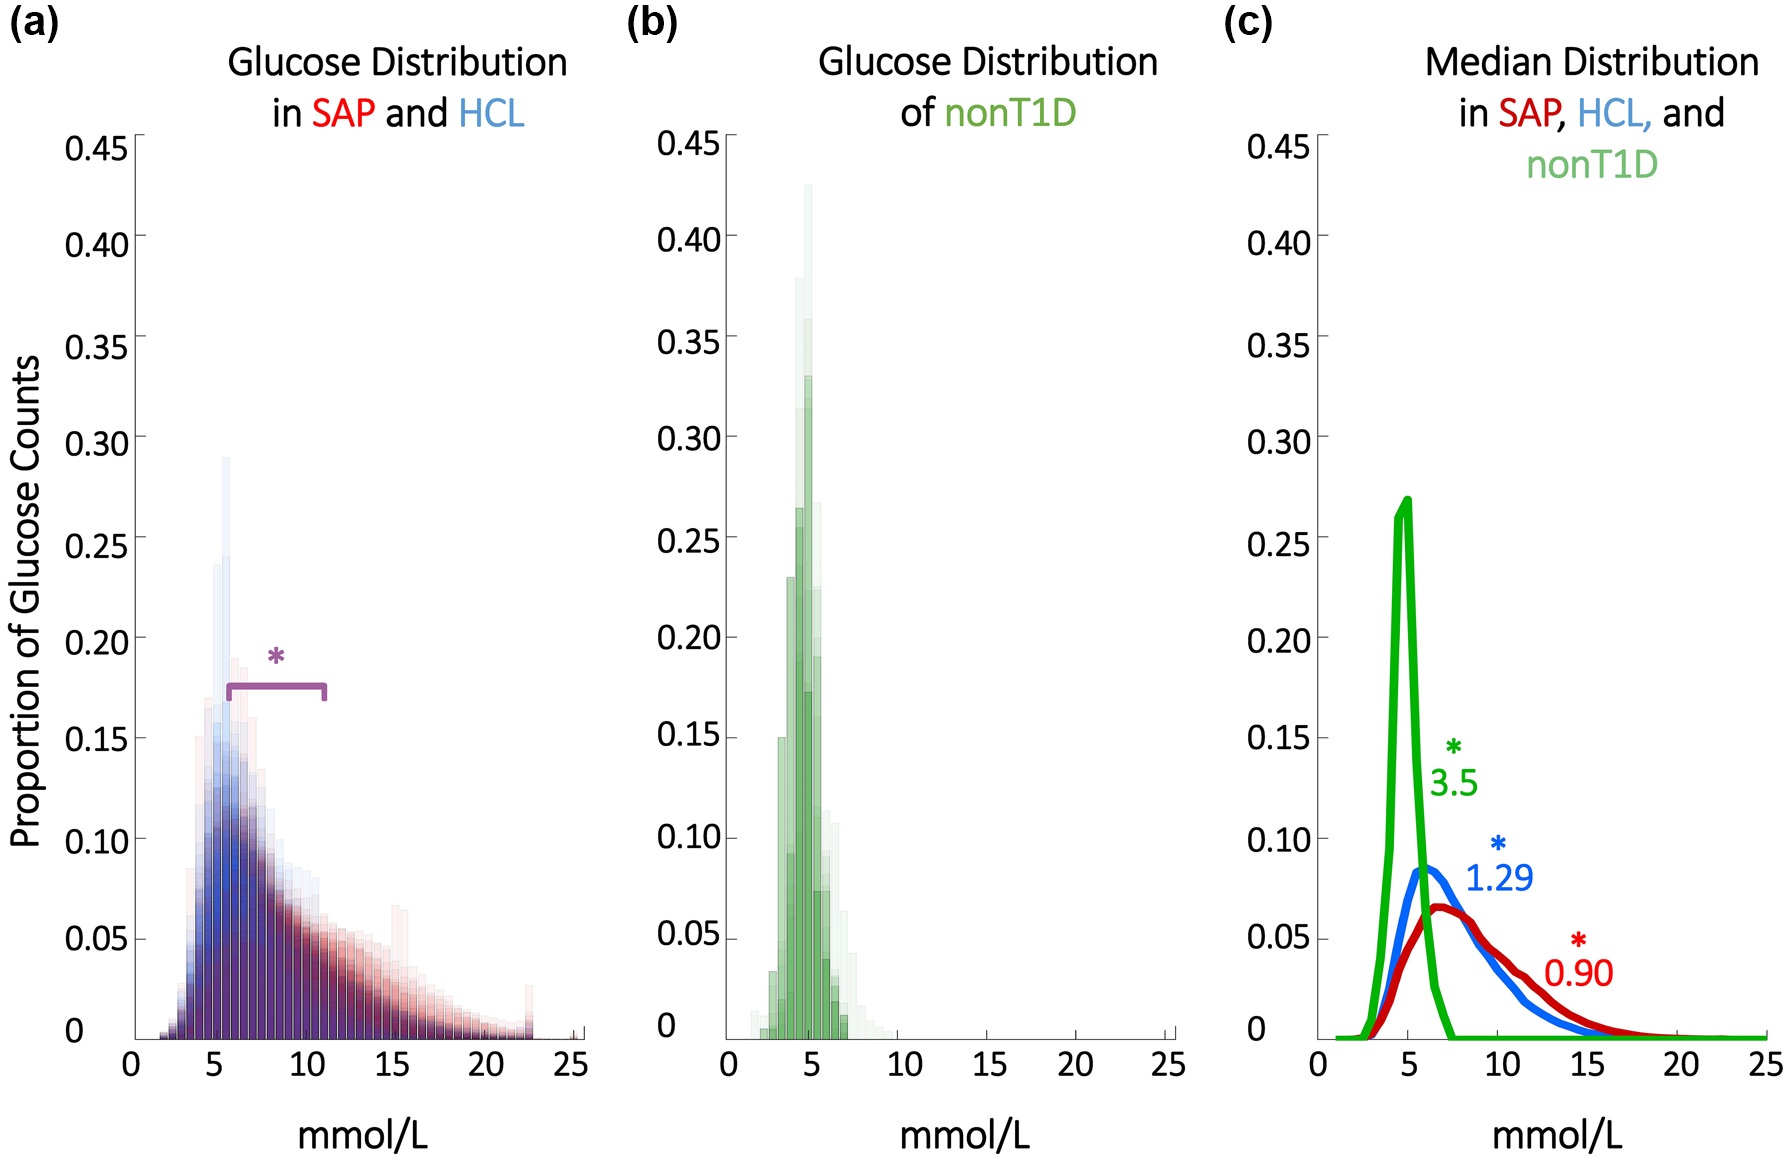
HCL systems reduce hyperglycemia. (a) Proportional counts of glucose distributions of all individuals with T1D using SAP and HCL systems. Note that counts are scaled such that each individual contributes the same proportion of total data. SAP system users exhibit greater hyperglycemia (>7.8 mmol/L); SAP, HCL, and nonT1D glucose distributions differed significantly. Hypoglycemic events (<4 mmol/L) comprised <5% of all data points for either T1D dataset. (b) Proportional counts of nonT1D glucose distributions. (c) Median distributions for each dataset. HCL, Hybrid Closed Loop; SAP, Sensor Augmented Pump; SD, standard deviation; T1D, type 1 diabetes.
Linear and Rhythmic Correlation of Glucose and Insulin Delivery Rate Are Increased in HCL Users
HCL increases the correlation between normalized glucose and IDR levels (SAP r2 = 0.002; P = .119; HCL r2 = 0.015; P = 1.26 × 10⁻⁵) and the correlation between glucose and insulin high frequency URs (SAP r2 = 0.002; P = .127; HCL r2 = 0.084; P = 5.6 × 10⁻²²) compared to SAP (SAP metrics are uncorrelated). (Figure 2). This difference was not restricted to the 2 to 3 h ultradian band (Supplemental Figure 2).
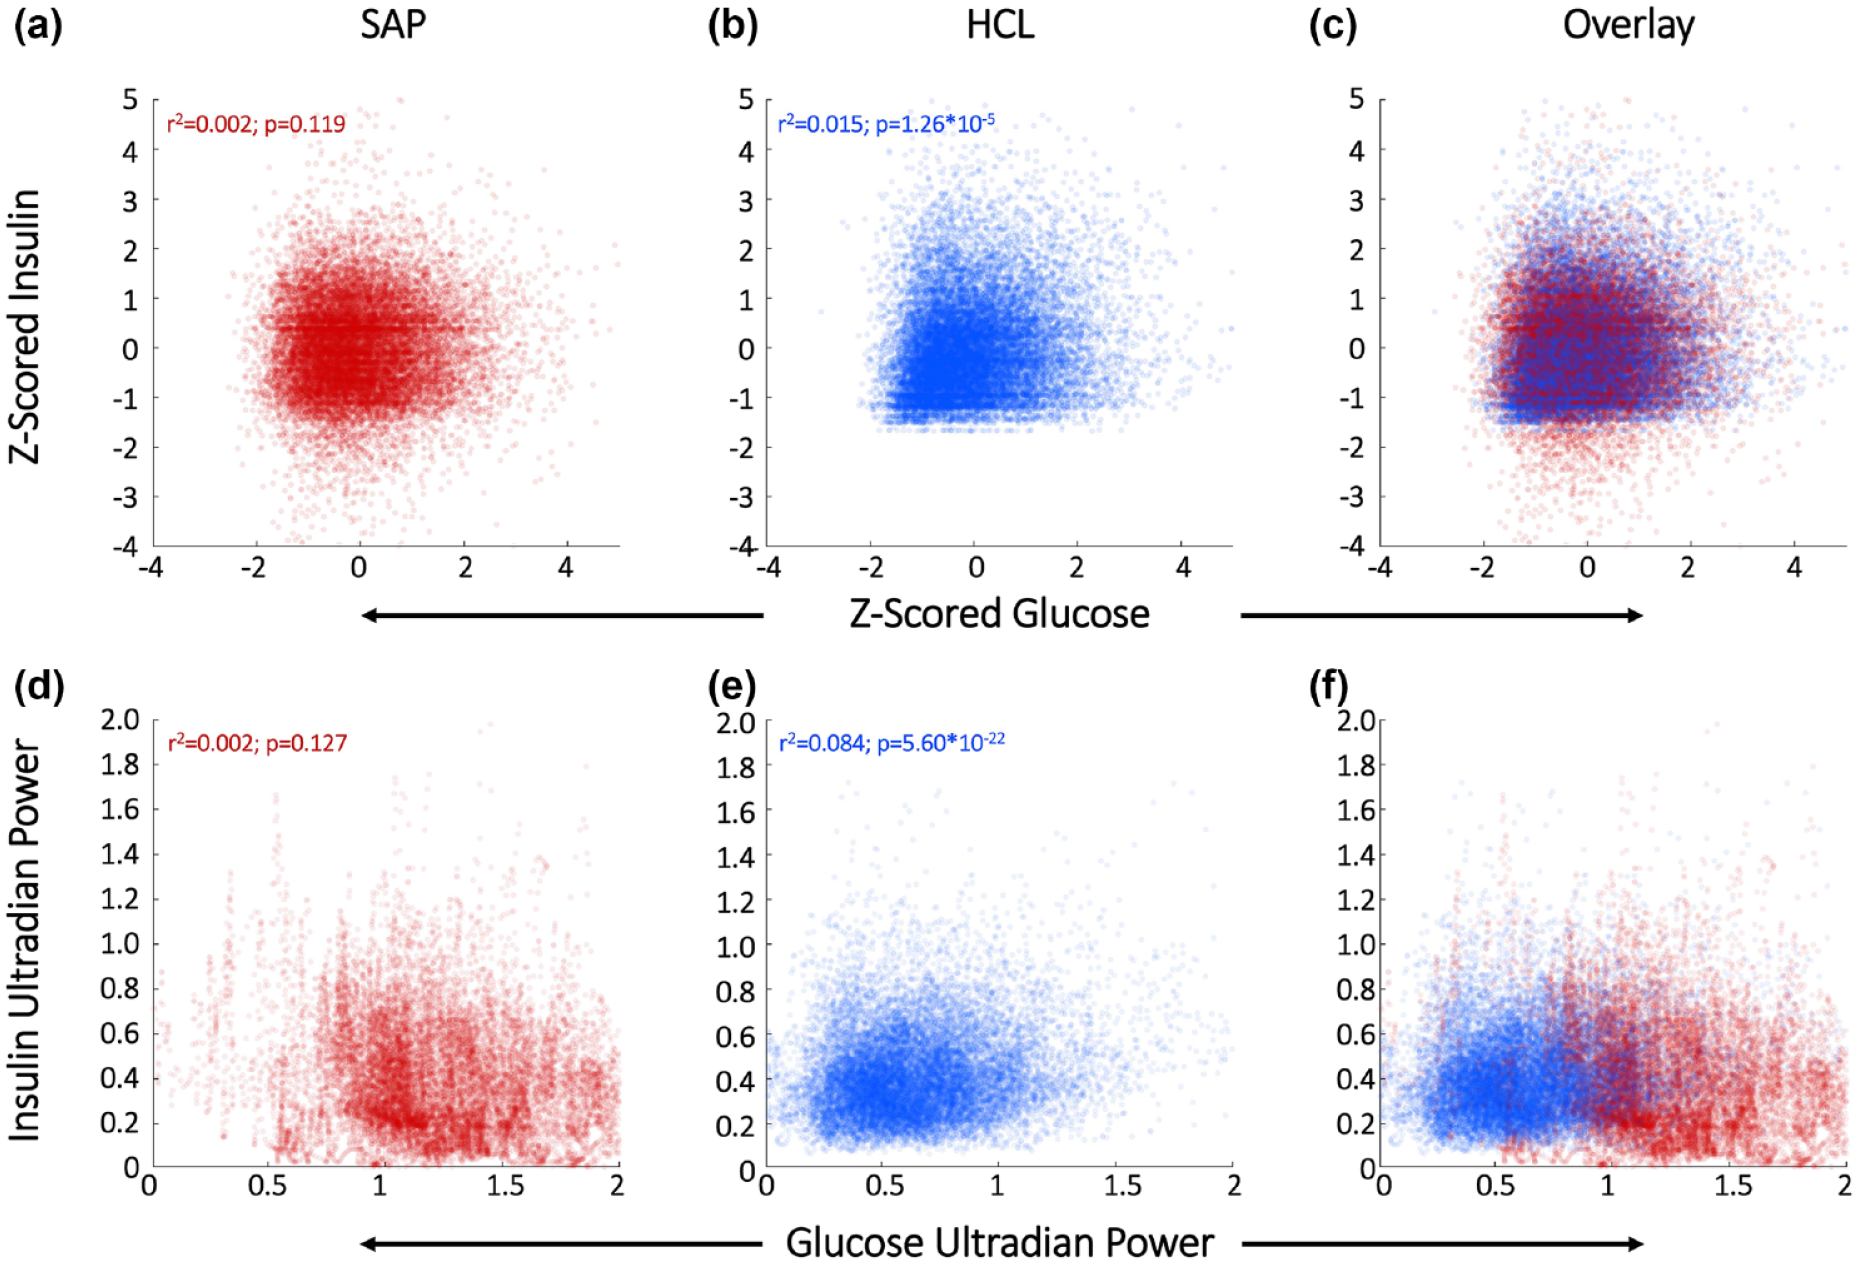
HCL increases correlation of glucose and IDR levels and ultradian rhythmicity. SAP users exhibit uncorrelated normalized glucose and IDR levels (a) and uncorrelated URs of glucose and insulin (d). Glucose and its rhythms assume a wide spectrum of values for each of the standard doses of insulin rates provided by the pump, leading to the striped appearance of the correlations. By contrast, Hybrid Closed Loop users exhibit correlated normalized glucose and IDR levels (b) and correlated ultradian rhythms of glucose and IDR (e). Overlays of normalized glucose and IDR (c) and ultradian rhythms (f) emphasize group differences. HCL, Hybrid Closed Loop; SAP, Sensor Augmented Pump; UR, ultradian rhythm.
HCL Use Is Associated With Lower Amplitude Circadian and Ultradian Glucose Deviations Than SAP
SAP glucose CR and UR amplitude is significantly higher than that of HCL or nonT1D (χ2 = 140 P < 4.41 × 10⁻⁴, χ2 = 73.5, P < 1.11 × 10⁻⁴, respectively). (Figure 3a). HCL CR amplitude is not significantly different from nonT1D CR amplitude (P = .206). Together, HCL users are more similar than SAP users to the canonical nonT1D phenotype of glucose rhythmic amplitude.
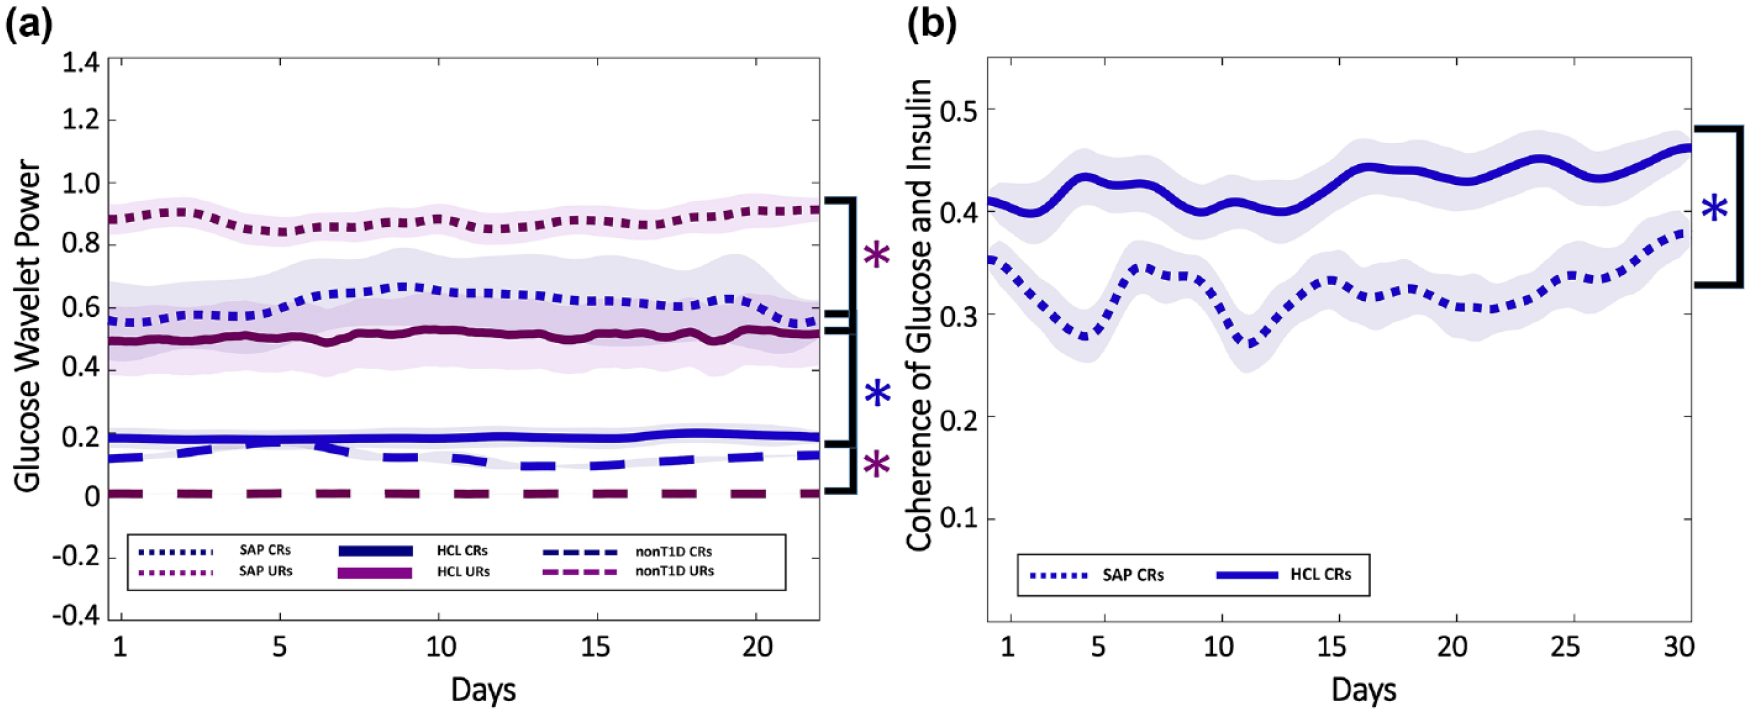
HCL use decreases amplitude of glucose oscillations and increases glucose-IDR coherence compared to SAP. The amplitude of HCL users’ glucose CRs (blue) and URs (maroon) (solid), and those of nonT1D (dashed) and SAP (dotted) users’ (a). Transparent shading indicates SD. SAP glucose CR and UR amplitude is significantly higher than that of HCL or nonT1D. HCL CR amplitude is not significantly different from nonT1D CR amplitude. Mean ± SD of circadian wavelet coherence for HCL (solid) and SAP (dotted) users (b). Circadian (blue) coherence of glucose and IDR in HCL (solid) and SAP (dotted) users. Transparent shading indicates SD. Although both HCL and SAP individuals exhibit lower coherence than would be expected in nonT1D individuals, HCL CR coherence is significantly greater than SAP CR coherence. CR, circadian rhythm; HCL, Hybrid Closed Loop; SAP, Sensor Augmented Pump; SD, standard deviation; T1D, type 1 diabetes; UR, ultradian rhythm.
HCL Exceeds SAP Wavelet Coherence of Circadian Rhythms of Glucose and Insulin Delivery Rate
HCL users exhibit greater coherence between circadian rhythms of glucose and IDR (χ2 = 29.12, P = 6.80 × 10⁻⁸) (Figure 3b). Finally, HCL improves the correlation between glucose and IDR circadian rhythms (SAP r2 = 0.002, P = .141; HCL r2 = 0.083, P = 1.13 × 10⁻²¹) (see Supplemental Figure 2). These findings indicate that the relationship between glucose and insulin in HCL users more closely resemble that expected in nonT1D than SAP users.1,5,7,68
Discussion
The present findings reveal that glycemia, biological rhythms in glucose and IDR, and rhythmic coherence vary significantly by T1D therapy type. In conjunction with lower incidence of hyperglycemia, HCL system use is associated with lower amplitude rhythmic fluctuation at the CR and UR timescales, a stronger association between glucose and IDR, and increased coherence of glucose and IDR circadian rhythms. The lack of a significant amplitude difference between CRs in HCL and nonT1D individuals is encouraging. Although much research is aimed at raising the amplitude of biological rhythms, the nonT1D data provide a context for illustrating that a reduction of rhythmic amplitude with preservation of rhythmic stability may be desirable in SAP systems, and in HCL systems at the UR timescale. Together, HCL systems appear to recapitulate glucose levels and rhythms to a greater extent than SAP systems.
The biological rhythm and insulin delivery metrics in the present investigation differ from those typically used to assess the efficacy of T1D therapies (eg, A1c and time in range). In contrast to insulin release in nonT1D individuals, absorption of insulin delivered subcutaneously results in smoothed levels of the hormone reaching the bloodstream with a delay.69,70 Such delays can also occur for measurements of interstitial glucose, relative to circulating levels.71,72 Although these delays may hamper the interpretation of rhythms in IDR, the present findings argue that this variable can be informative. The observation that glucose and IDR oscillate at the same frequencies and are temporally coordinated argues that the algorithmic coupling of glucose to delivered insulin can be stably maintained in both outputs, and therefore that central insulin maintains aspects of this 2-5 h and 24 h rhythmicity.
Because timeseries metrics assess key aspects of glucose-insulin regulation, CRs and URs, they may be useful for further comparison of different HCL systems or for reviewing efficacy at different time points after adoption of HCL. Consideration of rhythms in, and coordination of, glucose and insulin may enable better understanding of how algorithmic changes to HCL systems result in improvement or deterioration of glycemia and may guide protocols to help individuals more quickly achieve euglycemic status after changes in therapy. Additionally, available data on the number of interactions required both by users of HCL and SAP therapies may help differentiate outcomes and highlight possible improvements based on the number of interactions required to achieve euglycemia. In each of these cases, attempts to understand and improve therapies may be more successful if both the levels and rhythmic patterning of glucose and insulin administration are evaluated.
Additional factors, such as sex and age, likely impact rhythmicity of glucose and insulin.73-76 For example, adolescence is a time of restructuring of circadian and ultradian rhythmicity, and, in females, the emergence of a monthly timescale of rhythmicity in the form of the ovulatory cycle (or its suppression by the use of hormonal contraceptives). 77 Likewise, aging (eg, menopause, andropause) is a time of endocrine, metabolic, and rhythmic change as circadian rhythms lose coherence and decrease in amplitude.78-81 These changes to hormones, metabolism and their temporal structures may require different algorithms to customize therapy for different age groups, sexes, and hormonal milieus. Future explorations of donated T1D and nonT1D timeseries will be essential to understanding individual differences in glucose-insulin dynamics and to creating more effective, personalized HCL algorithms.
Limitations
These analyses were limited to the HCL systems present in the Tidepool HCL dataset and may not apply to all HCL systems. Additionally, analyses were conducted on basal-rate and temporary basal-rate delivered insulin data. This analysis excludes manual bolus data. More specifically, corrections for out of range glycemia are delivered by either bolus or temporary basal rates manually by SAP users whereas temporary basal rates likely make up a larger proportion of “corrections” for out of range glucose levels in HCL users, depending on their HCL and the available settings. Thus, future analyses will evaluate rhythmic features with the addition of manual boluses in both datasets. Finally, subcutaneously delivered insulin takes time to reach the bloodstream, and subcutaneously measured glucose may not capture changes at the highest frequencies in general circulation.69-72 The true relationship between circulating insulin after administration and circulating glucose requires longitudinal evaluation in a clinical setting, and future work modelling these delays32,82,83 in real-world conditions.
Conclusions
HCL use is associated with beneficial outcomes and rhythmic dynamics that more closely resemble nonT1D individuals, including: (1) a significantly lower incidence of hyperglycemia compared to SAP users, consistent with previous reports, (2) lower amplitude glucose oscillations at the circadian and ultradian timescales than SAP users, (3) a greater correlation of glucose and IDR than SAP users, (4) a higher correlation of ultradian rhythms of glucose and ultradian rhythms of IDR than SAP users, and (5) greater rhythmic coordination of glucose and IDR at the circadian and ultradian timescales compared to SAP users. Together, these results illustrate that HCL use is associated with both improved glycemia and stronger coordination between key rhythmic patterns of glucose and insulin administration.
Supplemental Material
sj-jpg-1-dst-10.1177_1932296821994825 – Supplemental material for Multi-Timescale Rhythmicity of Blood Glucose and Insulin Delivery Reveals Key Advantages of Hybrid Closed Loop Therapy
Supplemental material, sj-jpg-1-dst-10.1177_1932296821994825 for Multi-Timescale Rhythmicity of Blood Glucose and Insulin Delivery Reveals Key Advantages of Hybrid Closed Loop Therapy by Azure D. Grant, Dana M. Lewis and Lance J. Kriegsfeld in Journal of Diabetes Science and Technology
Supplemental Material
sj-jpg-2-dst-10.1177_1932296821994825 – Supplemental material for Multi-Timescale Rhythmicity of Blood Glucose and Insulin Delivery Reveals Key Advantages of Hybrid Closed Loop Therapy
Supplemental material, sj-jpg-2-dst-10.1177_1932296821994825 for Multi-Timescale Rhythmicity of Blood Glucose and Insulin Delivery Reveals Key Advantages of Hybrid Closed Loop Therapy by Azure D. Grant, Dana M. Lewis and Lance J. Kriegsfeld in Journal of Diabetes Science and Technology
Footnotes
Acknowledgements
We thank Dr. Benjamin Smarr for his helpful input on figure design and Dr. Andrew Ahn for his helpful comments on an earlier version of this manuscript. We also thank Dr. Bastian Greshake-Tzovaras and Dr. Mad Ball for creation of, and assistance with utilizing, Open Humans. Finally, we thank Mrs. Annamarie Sucher-Jones for editorial assistance.
Abbreviations
nonT1D, non-type-1-diabetes; HCL, Hybrid Closed Loop; SAP, Sensor Augmented Pump; CR, circadian rhythm; UR, ultradian rhythm; T2D, type 2 diabetes; CGM, continuous glucose monitor; WT, wavelet transform; IDR, insulin delivery rate.
Declaration of Conflicting Interests
The author(s) declared no potential conflicts of interest with respect to the research, authorship, and/or publication of this article.
Funding
The author(s) disclosed receipt of the following financial support for the research, authorship, and/or publication of this article: Supported by JDRF grant 1-SRA-2019-821-S-B.
Supplemental Material
Supplemental material for this article is available online.
References
Supplementary Material
Please find the following supplemental material available below.
For Open Access articles published under a Creative Commons License, all supplemental material carries the same license as the article it is associated with.
For non-Open Access articles published, all supplemental material carries a non-exclusive license, and permission requests for re-use of supplemental material or any part of supplemental material shall be sent directly to the copyright owner as specified in the copyright notice associated with the article.