
Abstract
Background:
Optimal inpatient glycemic management targets a blood glucose (BG) of 140-180 mg/dL and is an important safety measure for hospitalized patients with hyperglycemia. Traditional barriers to appropriate insulin administration include incorrect timing of prandial insulin administration, failure to administer basal insulin to persons with insulin deficiency/type 1 diabetes mellitus (DM), and inaccurate insulin dosing or timing resulting in hypoglycemia. Given the ongoing rapid assimilation of technology to manage our patients with DM, we investigated the use of continuous glucose monitoring (CGM) in the inpatient setting as a potential solution to traditional barriers to optimal hyperglycemia management for inpatient care. In this study, we evaluated the efficacy of use of inpatient CGM for insulin dosing in comparison with current standard of care and whether CGM could aid in minimizing hypoglycemic events.
Methods:
This study evaluated the use of Abbott professional (blinded) Freestyle Libre CGMs in participants treated with basal bolus insulin administered with subcutaneous insulin (basal bolus therapy [BBT]: n = 20) or on intravenous insulin (IVI) infusions (n =16) compared with standard point of care (POC) BG measurements. All participants on IVI were admitted with a diagnosis of diabetic ketoacidosis (DKA). The CGM data was not available in real time. Sensors were removed at the time of discharge and data uploaded to Libre View. Continuous BG data were aggregated for each subject and matched to POC BG or lab chemistry values within five minutes. The POC BG results were assessed for comparability (CGM vs standard BG testing). Data were further analyzed for clinical decision-making for correction insulin.
Results:
The overall mean absolute relative difference including both IVI and BBT groups was 22.3% (SD, 9.0), with a median of 20.0%. By group, the IVI arm mean was 19.6% (SD, 9.4), with a median of 16.0%; for BBT, the arm mean was 24.6% (SD, 8.1), with a median 23.4%. Using the Wilcoxon two-sample test, the means were not different (P = .10), whereas the medians were (P = .015). The CGM consistently reported lower glucose values than POC BG in the majority of paired values (BBT arm mean difference = 44.8 mg/dL, IVI mean difference = 19.7 mg/dL). Glucose results were in agreement for the group 83% of the time with Bland-Altman Plot of Difference versus the mean of all glucometric data. Analysis of correction dose insulin using either CGM or POC BG values resulted in a negligible difference in calculated insulin dose recommended in those receiving subcutaneous insulin. Corrective doses were based on weight and insulin sensitivity (type 1 vs type 2 DM). Participants initially on IVI were included in a data set of BBT once IVI therapy ceased and basal bolus insulin regimen was started. The data of all basal bolus therapy participants with 1142 paired values of CGM versus POC glucose were used. The dosing difference was less for CGM than POC BG in the majority of paired values, and there was an absolute difference in dose of insulin of only 1.34 units. In the IVI group with 300 paired values of CGM versus POC glucose, there was an absolute difference in dose of insulin of only 0.74 units. About a third of the patients studied in the BBT arm experienced a hypoglycemic event with POC BG <70 mg/dL. If used in real time, CGM would have identified a hypoglycemic event for our patients on average 3 hours and 34 minutes before it was detected by standard POC BG. Two participants incurred severe nocturnal hypoglycemia during the study with POC BG <54 mg/dL with hypoglycemia detected on CGM up to 3 hours and 42 minutes before POC testing.
Conclusions:
These results suggest that the use of inpatient CGM arrives at similar correction insulin dosing. The routine use of CGM for inpatients would consistently underestimate the BG compared with POC BG and could aid in minimizing and predicting hypoglycemia in the hospital setting. Our data support that the model of adoption of real-time inpatient CGM technology is anticipated to have significant impact in the clinical setting in efforts to maintain adequate glycemic control targeting BG 140-180 mg/dL while minimizing the frequency of hypoglycemic events.
Keywords
Introduction
Recent advancements in continuous glucose monitoring (CGM) have led to a rapid increase in the population of patients using this innovative technology. Initiatives through the T1D Exchange Quality Improvement Collaborative have noted an increase in CGM utilization from a baseline of 36% to as many as 48% of youth and young adults. 1 Glycemic data derived from CGM measure interstitial fluid glucose, which typically lags 5 to 15 minutes behind blood glucose (BG) values. 2 Continuous glucose monitoring can aid tremendously in data collection with recognition of glycemic patterns, as well as evaluating BG changes including both hyperglycemic and hypoglycemic events. Although standard point of care (POC) BG testing has traditionally seemed sufficient for glycemic monitoring of hospitalized patients on basal bolus insulin regimens, 3 the outpatient experience with CGM has had a tremendous impact on patient care. Use of CGM technology in the outpatient setting has resulted in clinically significant reductions in hemoglobin A1c, 4 a decrease in hypoglycemia, and improved overall quality of life with reduced fear of hypoglycemia in patients using CGM. Although CGM technology has proven beneficial in outpatient practice, it has only very recently been evaluated in the inpatient setting. Utilization of CGM technology in the inpatient setting has been shown to decrease hospital complications in both general medicine and surgery patients. It is implicated that the use of CGM in the inpatient setting may support similar reductions of hyperglycemia and hypoglycemia as seen in the outpatient setting.5-7
Optimized inpatient glycemic management targets a BG of 140-180 mg/dL per current guidelines and is an important safety issue for hospitalized patients with hyperglycemia. 8 Most hospitalized patients who are not critically ill will have their BG checked based on POC glucose testing four to six times per day; testing is performed prior to meals, three times a day, and at bedtime. In patients who are not eating, general recommendations are for POC BG every four to six hours.7,9 The above current standard for POC glucose testing provides a paucity of data compared with the glycemic data from CGM technology. The various CGM devices available deliver glucose values every 5 to 15 minutes depending on the device for a total of 96 to 288 glucose checks per day. 10 Inpatient care of the person with hyperglycemia is impacted by the traditional reporting of intermittent BG results complicated by timing insulin administration with meal delivery. Presentation of continuous glucose data may assist the care providers in identifying rising or falling BG trends, obviate the need for a POC BG test prior to administering insulin before meal, and potentially allow providers to intervene more quickly to a patient with impending hypoglycemia or persistent hyperglycemia. The CGM data are able to provide information on directionality and rate of change of glucose that lends itself to predicting episodes of hypoglycemia. 2 Hypoglycemia during hospitalization occurs in 9.5% of all patients hospitalized with diabetes mellitus (DM) 11 and is associated with increased inpatient mortality, increased risk of prolonged hospitalization, and higher odds of discharging to a skilled nursing facility and potentially leads to cognitive decline, neurologic damage, seizures, and coma if undetected or untreated.12-15
An additional patient population of interest for glycemic management in the inpatient setting includes critically ill patients with hyperglycemia. Initial studies have demonstrated accuracy and reliability in this patient population using CGM technology compared with standard hourly BG testing in critically ill patients with decreased hypoglycemic events16-18; however, there are inconsistencies in CGM data in this patient population regarding improvement in glycemic outcomes. 19 In addition to consideration of reducing hypoglycemic episodes for hospitalized patients, the consideration of time constraints while targeting adequate glycemic control should also be noted. On average, it takes nursing staff five minutes to complete a standard POC BG test. Critically ill patients on intravenous insulin (IVI) regimens require frequent BG checks on an hourly basis and result in significant time demands at the bedside of nursing staff. 17 Utilization of CGM in the critical care setting is hypothesized to improve detection of both hypoglycemia and efficiency of nursing staff related to time demands. 20 In this study, we evaluated the clinical efficacy of use of inpatient CGM in comparison with current standard of care.
Methods
This study involved a retrospective analysis of glucometric data evaluating the utility of Abbott professional (blinded) Freestyle Libre CGMs with 96 glucose data points per day for up to 14 days’ duration compared with current standard BG testing including POC BG fingerstick testing, serum BG chemistry labs, and iStat BG values. The Wake Forest Baptist Health Institutional Review Board (IRB) approved the study, and all subjects signed informed consent. The study was was funded by a Learning Healthcare System Pilot Grant through Wake Forest Baptist Health, Department of Internal Medicine, the Center for Healthcare Innovation, and the Clinical and Translational Science Institute. The study was designed for enrolling 20 participants in the basal bolus insulin therapy arm with subcutaneous (SQ) long-acting once-daily insulin and SQ rapid-acting insulin administered for mealtime coverage as well as correction insulin doses. The participants in the basal bolus insulin therapy arm received care on either a general medical or surgical floor level of care. An additional IVI arm of the study was designed for enrolling 20 participants on continuous IVI therapy in the setting of treatment of diabetic ketoacidosis (DKA) in efforts to evaluate the utility of CGM glycemic data in this patient population as well. Final participant data were collected retrospectively for a total of N = 36, with 20 participants in the basal bolus therapy (BBT) insulin arm and 16 participants in the IVI arm with characteristics of participants noted in Table 1. The IVI participants continued data collection after transitioning off of IVI and onto a BBT insulin regimen. Loss of data occurred because of nursing or subject error with discarding of sensors as well as premature closing of IVI arm during the COVID-19 pandemic as per IRB and Data Safety Monitoring Board recommendations. We also evaluated the ability of CGM technology to detect hypoglycemia prior to detection with standard POC BG testing in participants who experienced hypoglycemic episodes while enrolled in the study.
Study Participant Characteristics.
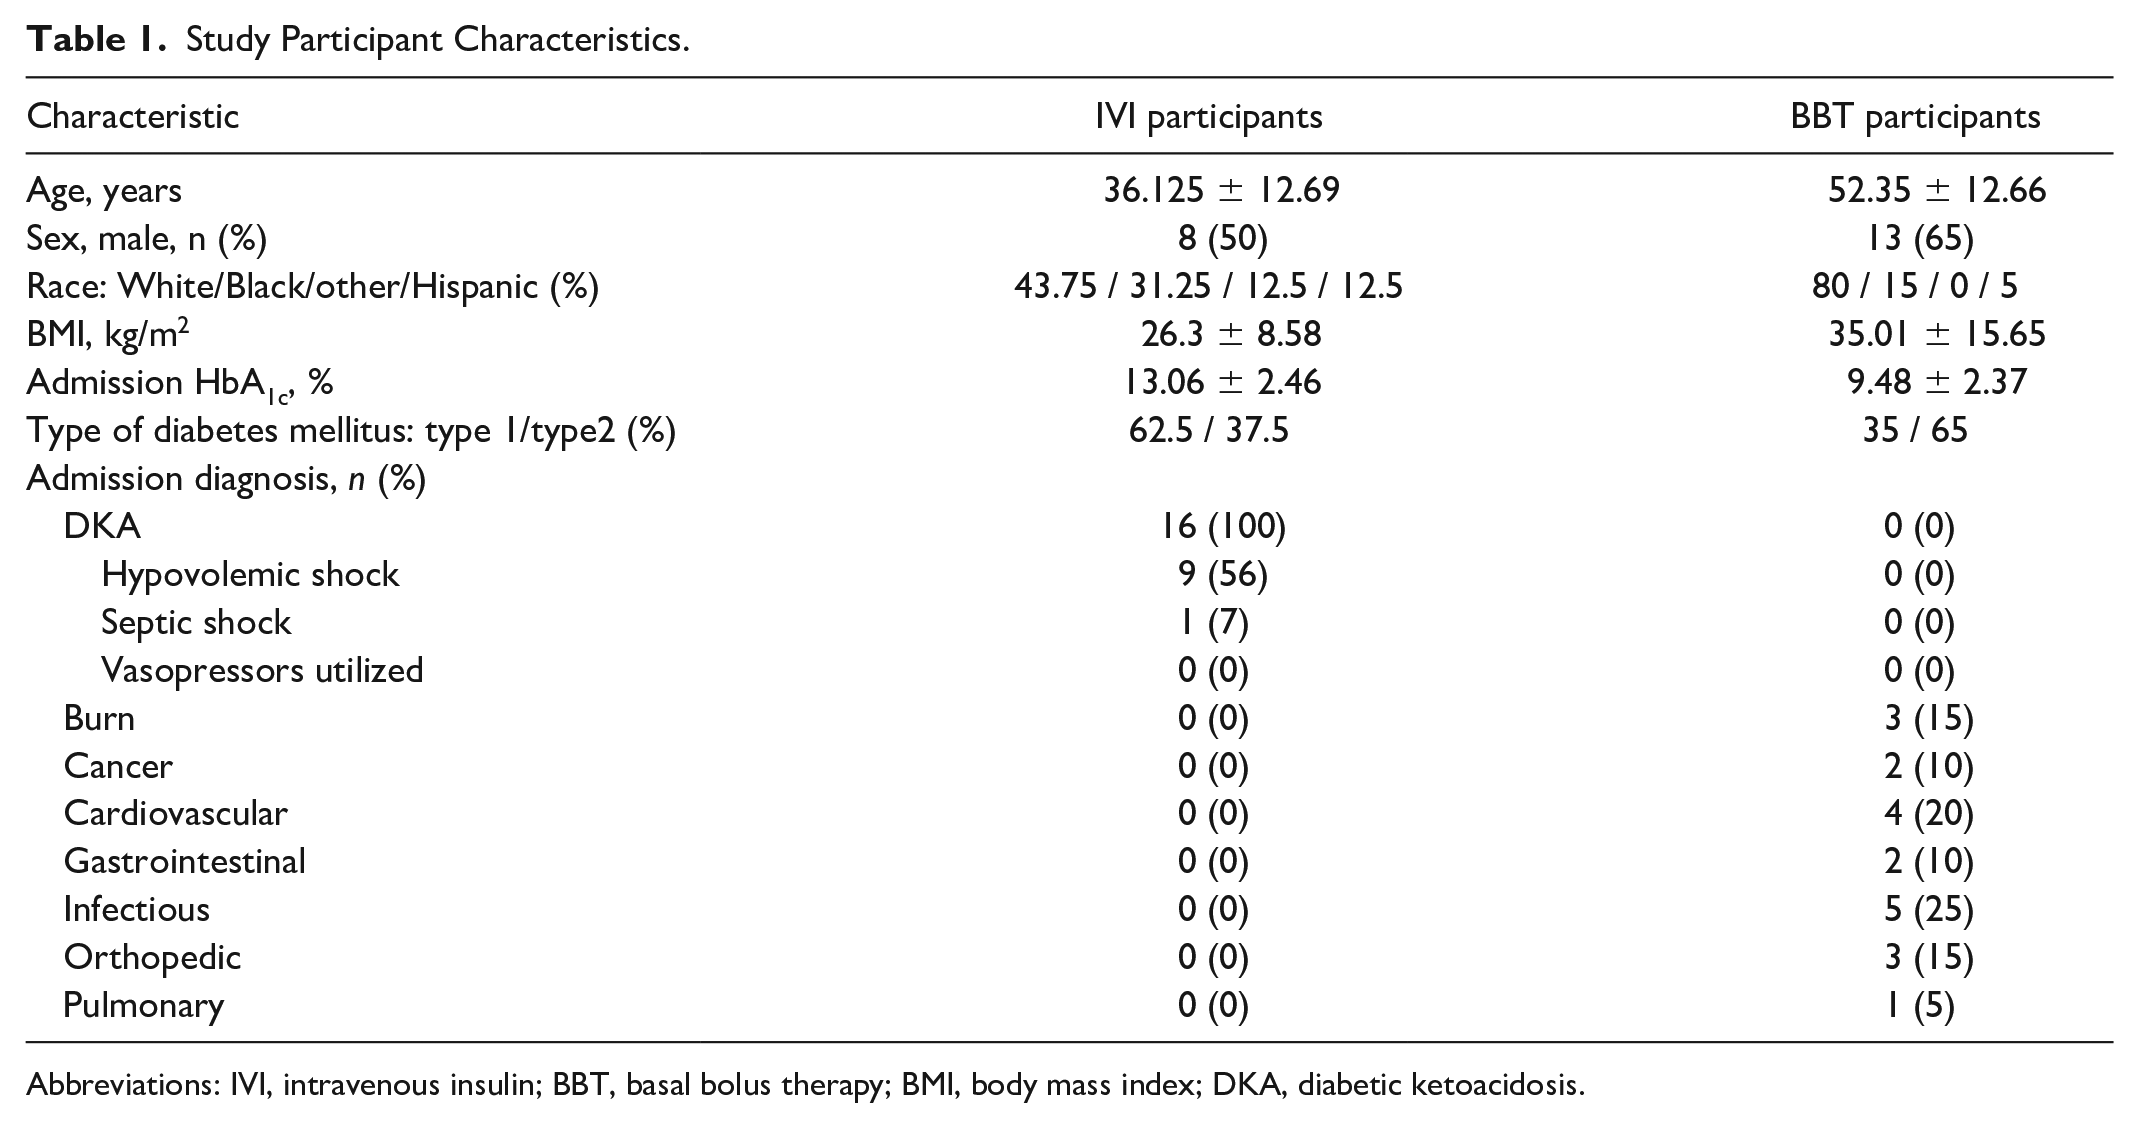
Abbreviations: IVI, intravenous insulin; BBT, basal bolus therapy; BMI, body mass index; DKA, diabetic ketoacidosis.
In addition to evaluating the comparability of CGM versus the standard BG testing, we assessed the anticipated difference in corrective insulin dosing participants would have received should CGM data have been used versus data from POC BG testing. All participants in the BBT insulin arm were managed with insulin glargine for basal insulin requirements and insulin lispro for prandial requirements. Each participant was assigned to a weight-based dose of corrective lispro with a different scale used for type 2 and type 1 DM based on their insulin sensitivity (Table 2), which was added to their fixed prandial base dose. No participant used only corrective or sliding-scale insulin. At our institution, standard BG testing is performed pre-meal with one injection of prandial lispro administered after the meal in efforts to avoid hypoglycemia due to minimal ingestion of their meal. Insulin dose adjustments (increases or decreases) were performed based on standard POC BG testing for all participants throughout the study as per current standard of care for glycemic management.
Corrective Insulin Lispro Dosing.
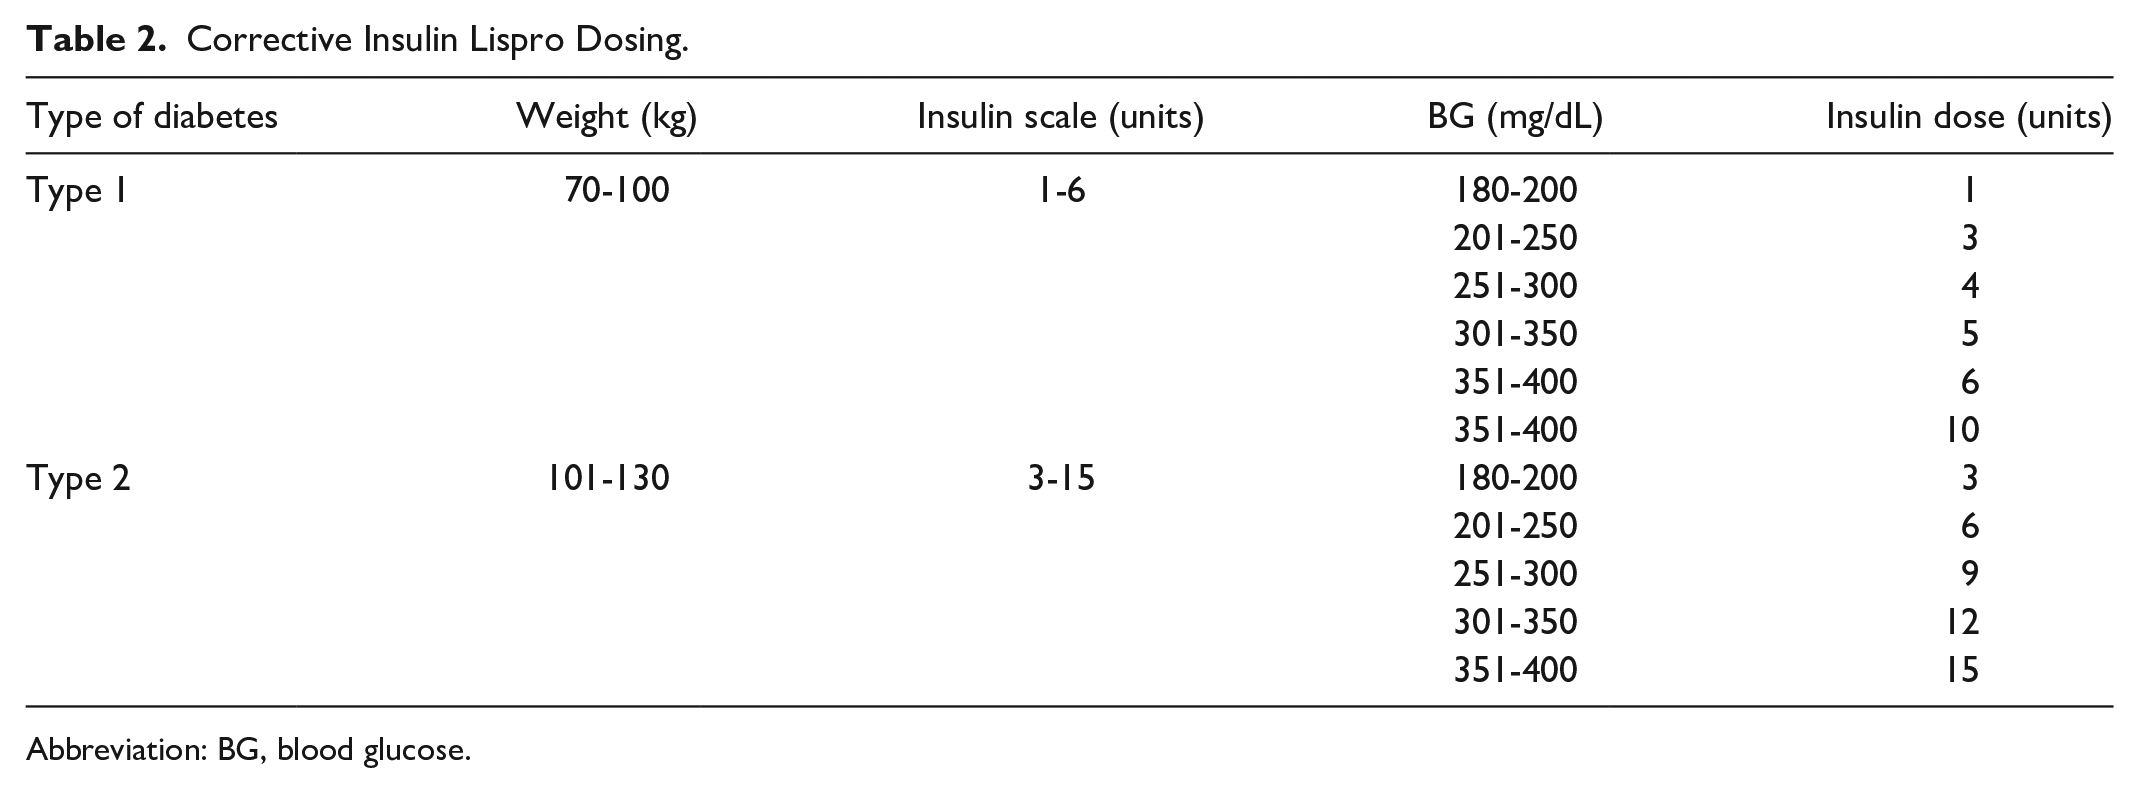
Abbreviation: BG, blood glucose.
Statistical Methodology
All study measures were summarized using means and standard deviations for continuous variables and frequencies and proportions for categorical data. These summaries were calculated on both the overall data and the (equally) weighted data; for the latter set of analyses, the overall mean would be calculated using the mathematical average of the individual participant means (each patient’s data are used to calculate a single data value for that patient). To compare the groups, nonparametric tests (Wilcoxon two-sample tests) were used. As these are pilot data, no adjustments were done for multiple comparisons. SAS (version 9.4; SAS Institute, Cary, NC, USA) was used for all statistical analysis. P values <.05 were considered to be statistically significant.
Results
A total of 36 individuals participated in the study; five participants were without CGM data due to discarding of sensor. Additional characteristics are noted in Table 1. Five CGMs were lost because of nursing staff discarding sensor into sharp container or participant discarding sensor prior to data being uploaded from CGM device. In combination, the IVI and BBT arms of the study contained a total of 1442 pairs of matched glucose measurements, with trend of glycemic data noted in Figure 1. Glucose results were in agreement for the group 83% of the time with Bland-Altman Plot of Difference versus the mean of all glucometric data noted in Figure 2. Results were analyzed evaluating the BBT insulin arm with 17 participants with a mean of 8.1 patient days (SD, 7.2) and 14 participants in the IVI arm with a mean of 1.7 (SD, 1.6) patient days. The MARD (mean absolute relative difference) was evaluated using the means and medians for each participant; the group overall MARD was 22.3% (SD, 9.0), with a median of 20.0%. By group, the IVI arm mean was 19.6% (SD, 9.4), with a median 16.0%; for BBT insulin arm, the mean was 24.6% (SD, 8.1), with a median 23.4%. Using the Wilcoxon two-sample test, the means were not different (P = .10), whereas the medians were (P = .015).
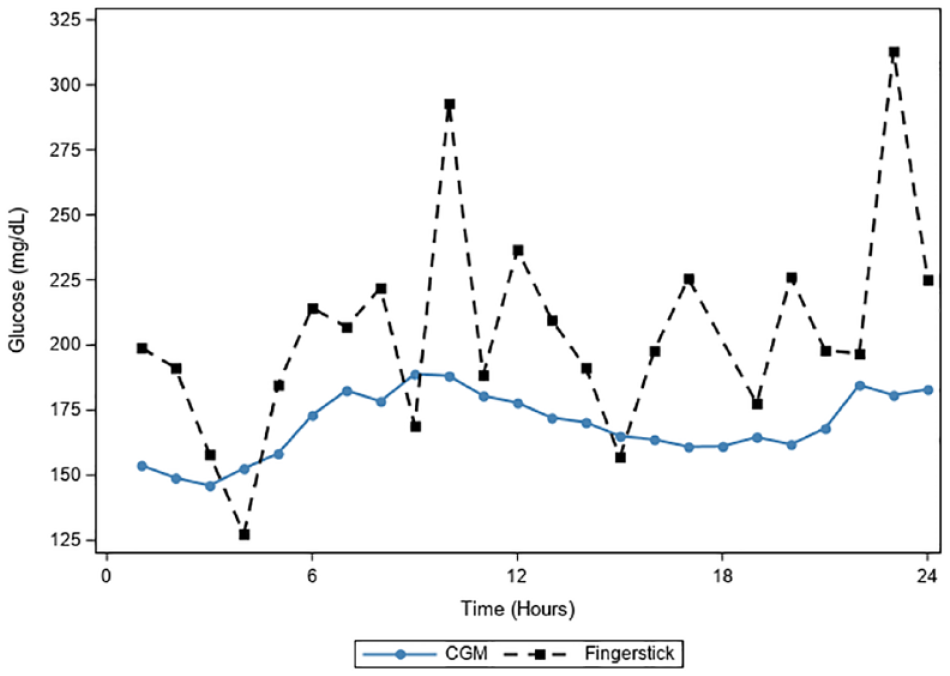
CGM versus all standard of care glucose data. All glucometric data (N = 30) from continuous glucose monitors compared with point of care standard blood glucose data plotting 1442 matched pairs. Abbreviation: CGM, continuous glucose monitor.
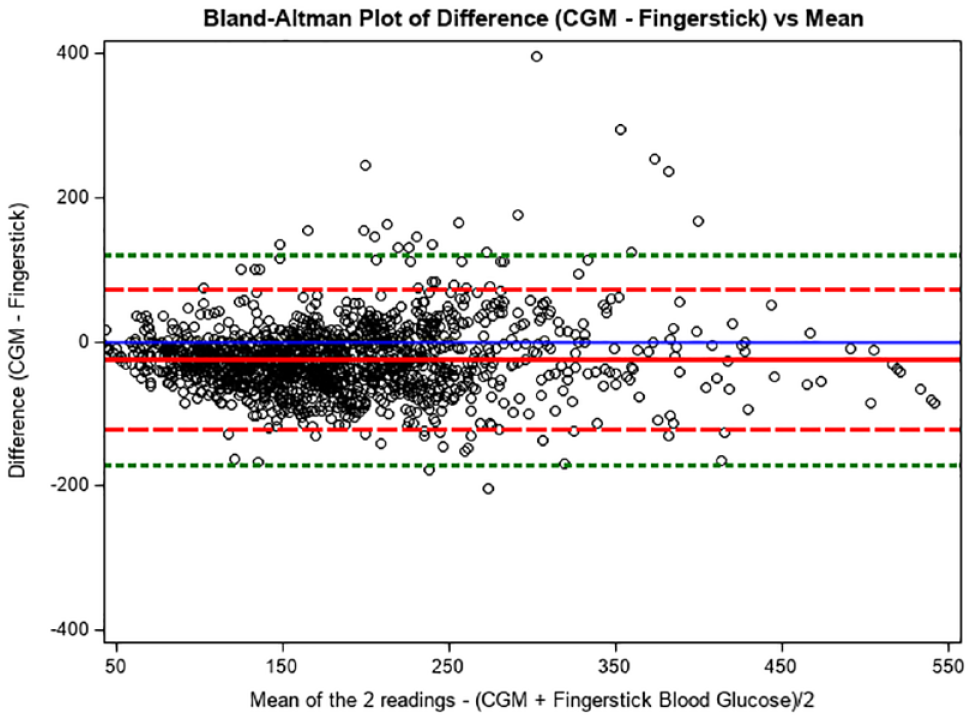
Bland-Altman plot of difference (CGM − fingerstick) versus mean. Bland-Altman plot of the difference between CGM and POC BG Fingerstick versus the mean plotting 1442 matched pairs. Mean difference in all simultaneous readings noted by solid line with additional reference line noted at zero. Dashed lines note 2 standard deviation limits and provide an estimate of where 95% of the differences should lie if the differences are normally distributed. Dotted lines note 3 standard deviation limit and provide an estimate for 99% of the differences. Abbreviations: CGM, continuous glucose monitor; POC, point of care; BG, blood glucose.
Analysis of the BBT insulin arm revealed an average difference of standard of care BG versus CGM glucose of 44.8 (SD, 42.8) mg/dL, with CGM reading lower for the majority of paired values, whereas the equally weighted mean (mean for each participant, thus one value per participant) indicated a mean difference of 40.4 (SD, 18.4) mg/dL between standard of care BG and CGM glucose values. The CGM glucose data in the BBT insulin arm revealed 6.8% time with hypoglycemia (BG <70 mg/dL), 69.9% time in range of BG 70-180 mg/dL, and 23.3% time with hyperglycemia (BG >180 mg/dL). The BBT insulin arm compared with standard BG testing was in agreement 65.9% of the time when stratifying the data of the two glucose testing modalities in categories of BG <70 mg/dL, BG 70-180 mg/dL, and BG >180 mg/dL.
Analysis of the IVI arm revealed an average difference of 19.7 (median,14.1; SD, 22.6) mg/dL of standard of care BG versus CGM glucose with CGM reading lower for the majority of paired values, whereas the equally weighted mean indicated a mean difference of only 21.0 (median, 16.2; SD, 13.7) mg/dL between standard of care and CGM glucose values. The CGM glucose data in the IVI arm revealed 1.4% time with hypoglycemia (BG <70 mg/dL), 42.2% time in the range of BG 70-180 mg/dL, and 56.5% time with hyperglycemia (BG >180 mg/dL). The IVI arm compared with standard BG testing was in agreement 83.2% of the time when stratifying the data of the two glucose testing modalities in categories of BG <70 mg/dL, BG 70-180 mg/dL and BG >180 mg/dL.
It was noted that the BBT insulin arm spent 29.0% (SD, 28.3) time in the range of BG >180 mg/dL, whereas the IVI arm spent 59.6% (SD, 27.2) time in the range of BG >180 mg/dL with prolonged hyperglycemia, P = .0057. The percentage of time below 70 was also different between the two, with the BBT insulin arm spending 7.1% of time (SD, 5.8) in the range of BG <70 md/dL, with the IVI arm mean of 1.9% (SD, 4.2), P = .014.
There were a total of 11 events of hypoglycemia in the BBT arm and only 1 hypoglycemic event in the IVI arm with POC BG of 60 mg/dL. Of the 11 events in the BBT arm, 7 were nocturnal while participants were fasting and 3 episodes were severe hypoglycemia with POC BG <54 mg/dL, with example noted in Figure 3 of participant with nocturnal severe hypoglycemia on day 5 of hospitalization after transitioning off IVI and to BBT. The average BG value in those experiencing a hypoglycemic event was 59 mg/dL on standard BG testing. The duration of all episodes of hypoglycemia on CGM prior to detection with standard BG testing ranged from 13 minutes to 7 hours and 50 minutes with an average duration of 3 hours and 34 minutes. The average duration of nocturnal hypoglycemia on CGM prior to detection on POC BG was 4.5 hours. All instances of hypoglycemia were noted earlier on CGM prior to detection in real time with standard POC BG testing.
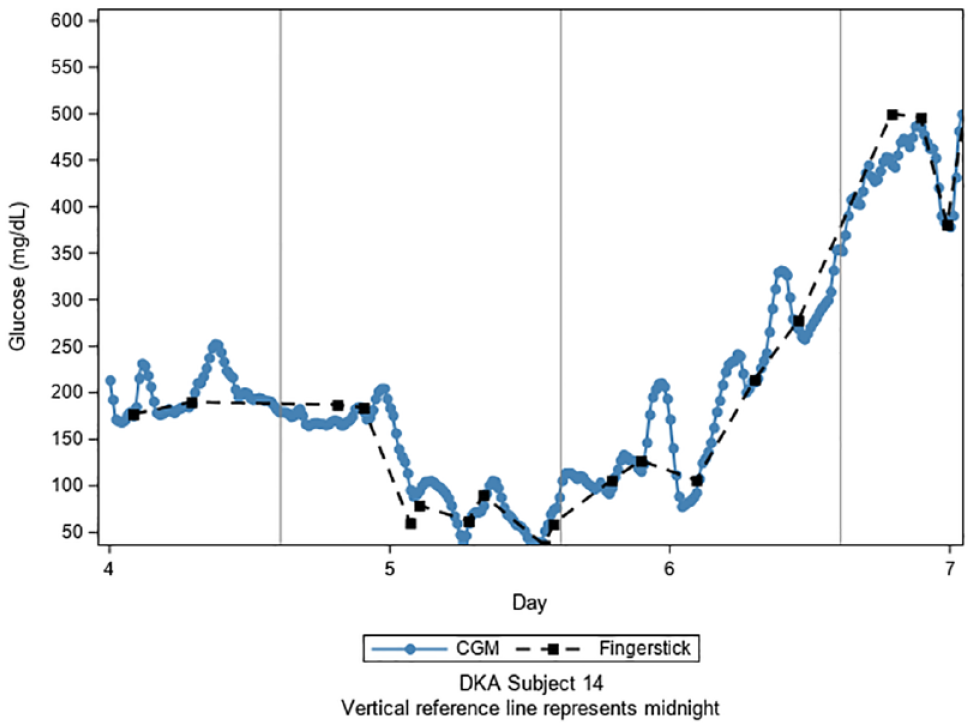
Hypoglycemic event in DKA subject 14. All glucometric data from participant DKA subject 14 with significant recurrent hypoglycemic events on day 5 of hospital stay with trend toward hypoglycemia noted on CGM hours before detection by standard of care. Abbreviations: DKA, diabetic ketoacidosis; CGM, continuous glucose monitor.
Additional investigation as to differences in corrective insulin dosing based on weight-based scale insulin lispro (see Table 2) administered at times of prandial coverage needs between 06:00 and 21:00 was also performed evaluating a total of N = 1142 paired readings in the BBT insulin arm and N = 300 paired readings in the IVI arm. In the BBT insulin group, the difference in corrective insulin dose based on standard pre-meal POC BG and corrective insulin dose based on pre-meal CGM glucose value was an absolute difference of 1.34 units (SD, 2.04), indicating that on average, corrective insulin dosing based on CGM glucose value would receive 1.34 units less than the corrective insulin dose based on standard BG testing. The absolute difference in doses for the IVI group was 0.74 units (SD, 2.33). Using weighted mean data at times of prandial coverage needs between 06:00 and 21:00, the corrective insulin lispro dose based on CGM glucose value for participants on BBT was equal to the dose based on standard POC BG testing on average 54.9% of the time, with corrective insulin dose based on CGM data recommending greater corrective insulin dose 9.9% of the time and less insulin based on CGM data compared with standard POC BG testing 35.2% of the time.
Discussion
Our data indicate that CGM technology using the Abbott professional Freestyle was in agreement for time in range values of 69.9% in the IVI arm when compared with congruence of same time in range values of the BBT insulin arm of agreement of 65.9%. Analysis of the equally weighted mean of the means for participants revealed a difference of only 19.7 mg/dL in the IVI arm compared with a difference of 40.4 mg/dL in the BBT insulin arm when comparing standard BG testing with CGM glucose values. Abbott professional Freestyle CGM consistently reported lower glucose values than POC BG for the majority of paired values likely related to lower calibration of the CGM device. The mean difference in the IVI arm has clinical significance, although the low number of participants may contribute to a lack of statistical significance (N = 14). The MARD of 22.3% (SD, 9.0) combining the BBT insulin and IVI groups was higher than expected compared with the anticipated MARD of 11.4% to 13.2% in prior studies, although it may have been skewed due to smaller sample size.21,22 The MARD for combined arms and individual arms of the study was noted to be lower than the mean ARD. The smaller sample size and larger standard deviation in this study may have contributed to the increased MARD.
By design with the use of retrospective CGM data, our study was limited in ability to react to glycemic changes on CGM in real time. It is pertinent to note that all episodes of hypoglycemia with BG <70 mg/dL on POC BG testing were detected earlier on CGM technology. The improved identification of nocturnal hypoglycemia and earlier detection of hypoglycemia on CGM are in line with data obtained in other studies of noncritically ill hospitalized patients with DM on basal bolus insulin therapy.9,23 Of note, participant BBT3 enrolled in the BBT insulin arm incurred prolonged fasting nocturnal hypoglycemia during the study with hypoglycemia noted 7 hours and 50 minutes earlier on CGM data than with standard BG testing with POC fingerstick.
Conclusion
In this retrospective analysis of CGM versus POC BG using Abbott professional Freestyle Libre CGM, the CGM data consistently showed lower BG values than standard BG testing methods in the majority of paired values. We propose that the use of real-time CGM technology in the inpatient setting could have significant impact in the clinical setting by improving patient safety through use of early detection of glycemic trends including both hyperglycemia and hypoglycemia. 24 This would provide a unique opportunity for prevention of or expedited treatment of inpatient hypoglycemic trends. Of note, although our study was halted due to safety concerns related to the COVID-19 pandemic, there has been a rapidly increasing interest in the use of CGM technology for enhancing the ability of remote glycemic data monitoring of hospitalized patients due to the pandemic, with the Food and Drug Administration expanding use of CGM technology to inpatient with emergency use authorization in April 2020.
In addition to obtaining more comprehensive glycemic data, remote monitoring would allow decreased frequency of entering patients’ room and decreased utilization of personal protective equipment for patients with COVID-19 or for patients under investigation being ruled out for infection. 7 The CGM technology with use of wireless transmission from the bedside to a central location for nursing staff and providers is anticipated to be pursued as a new standard of glycemic data collection with glucose telemetry. 25
Footnotes
Abbreviations
Basal bolus therapy; BG, blood glucose; BMI, body mass index; CGM, continuous glucose monitor; DKA, diabetic ketoacidosis; DM, diabetes mellitus; IVI, intravenous insulin; MDI, multiple daily injections; POC, point of care; SQ, subcutaneous.
Declaration of Conflicting Interests
The author(s) declared no potential conflicts of interest with respect to the research, authorship, and/or publication of this article.
Funding
The author(s) disclosed receipt of the following financial support for the research, authorship, and/or publication of this article: This work was funded by a Learning Healthcare System Pilot Grant through Wake Forest Baptist Health, Department of Internal Medicine, the Center for Healthcare Innovation, and the Clinical and Translational Science Institute.