
Abstract

Numbers are great; however, colors are quite helpful in enabling both people with diabetes (PwD) and clinicians a quick visual assessment, a snapshot, of the current quality of glucose management. Then one can dig into specific metrics like the percentage of values or minutes per day in, above, or below a target glucose range. In addition, the small print revealing the internationally agreed upon continuous glucose monitoring (CGM) time-in-range (TIR) metrics can be difficult to read, particularly for the elderly with diabetes and retinopathy.1,2 Following this line of thinking, can we all first agree on the best colors to mark different glucose ranges and then explore how these colors can facilitate the effective use of a CGM report to improve glycemia management?
Some companies that are manufacturing blood glucose (BG) systems (like Johnson & Johnson) have used blue to mark the “low glucose range,” green for the “target glucose range,” and red for the “high glucose range.”3-5 In this case, these colors are used to mark BG ranges shown with glucose meters used for self-monitoring of blood glucose (SMBG). One study demonstrated that devices with different colors for glucose ranges versus no-color display increased the participants’ likelihood of taking action on the glucose results. 6 However, other companies (like Ascensia Diabetes Care) propose red for low, green for in-target, and amber (dark yellow/orange) for high (blood) glucose ranges; these colors are consistent with the ambulatory glucose profile (AGP) color code used to characterize CGM data obtained over a given period of time in PwD (Figure 1). Even the consensus surveillance error grid for SBGM systems developed to evaluate and compare the performance of such devices relied on a green, yellow, and red continuous color-coded error grid. 7 In addition, many hospital systems use color coding to monitor glycemic status to visually characterize the measured BG values. With increasing use of CGM data measured, for example, in the intensive care unit, 8 there is also a movement toward displaying their metrics in color. 5 Again, some hospitals choose colors consistent with the AGP color code and others do not.
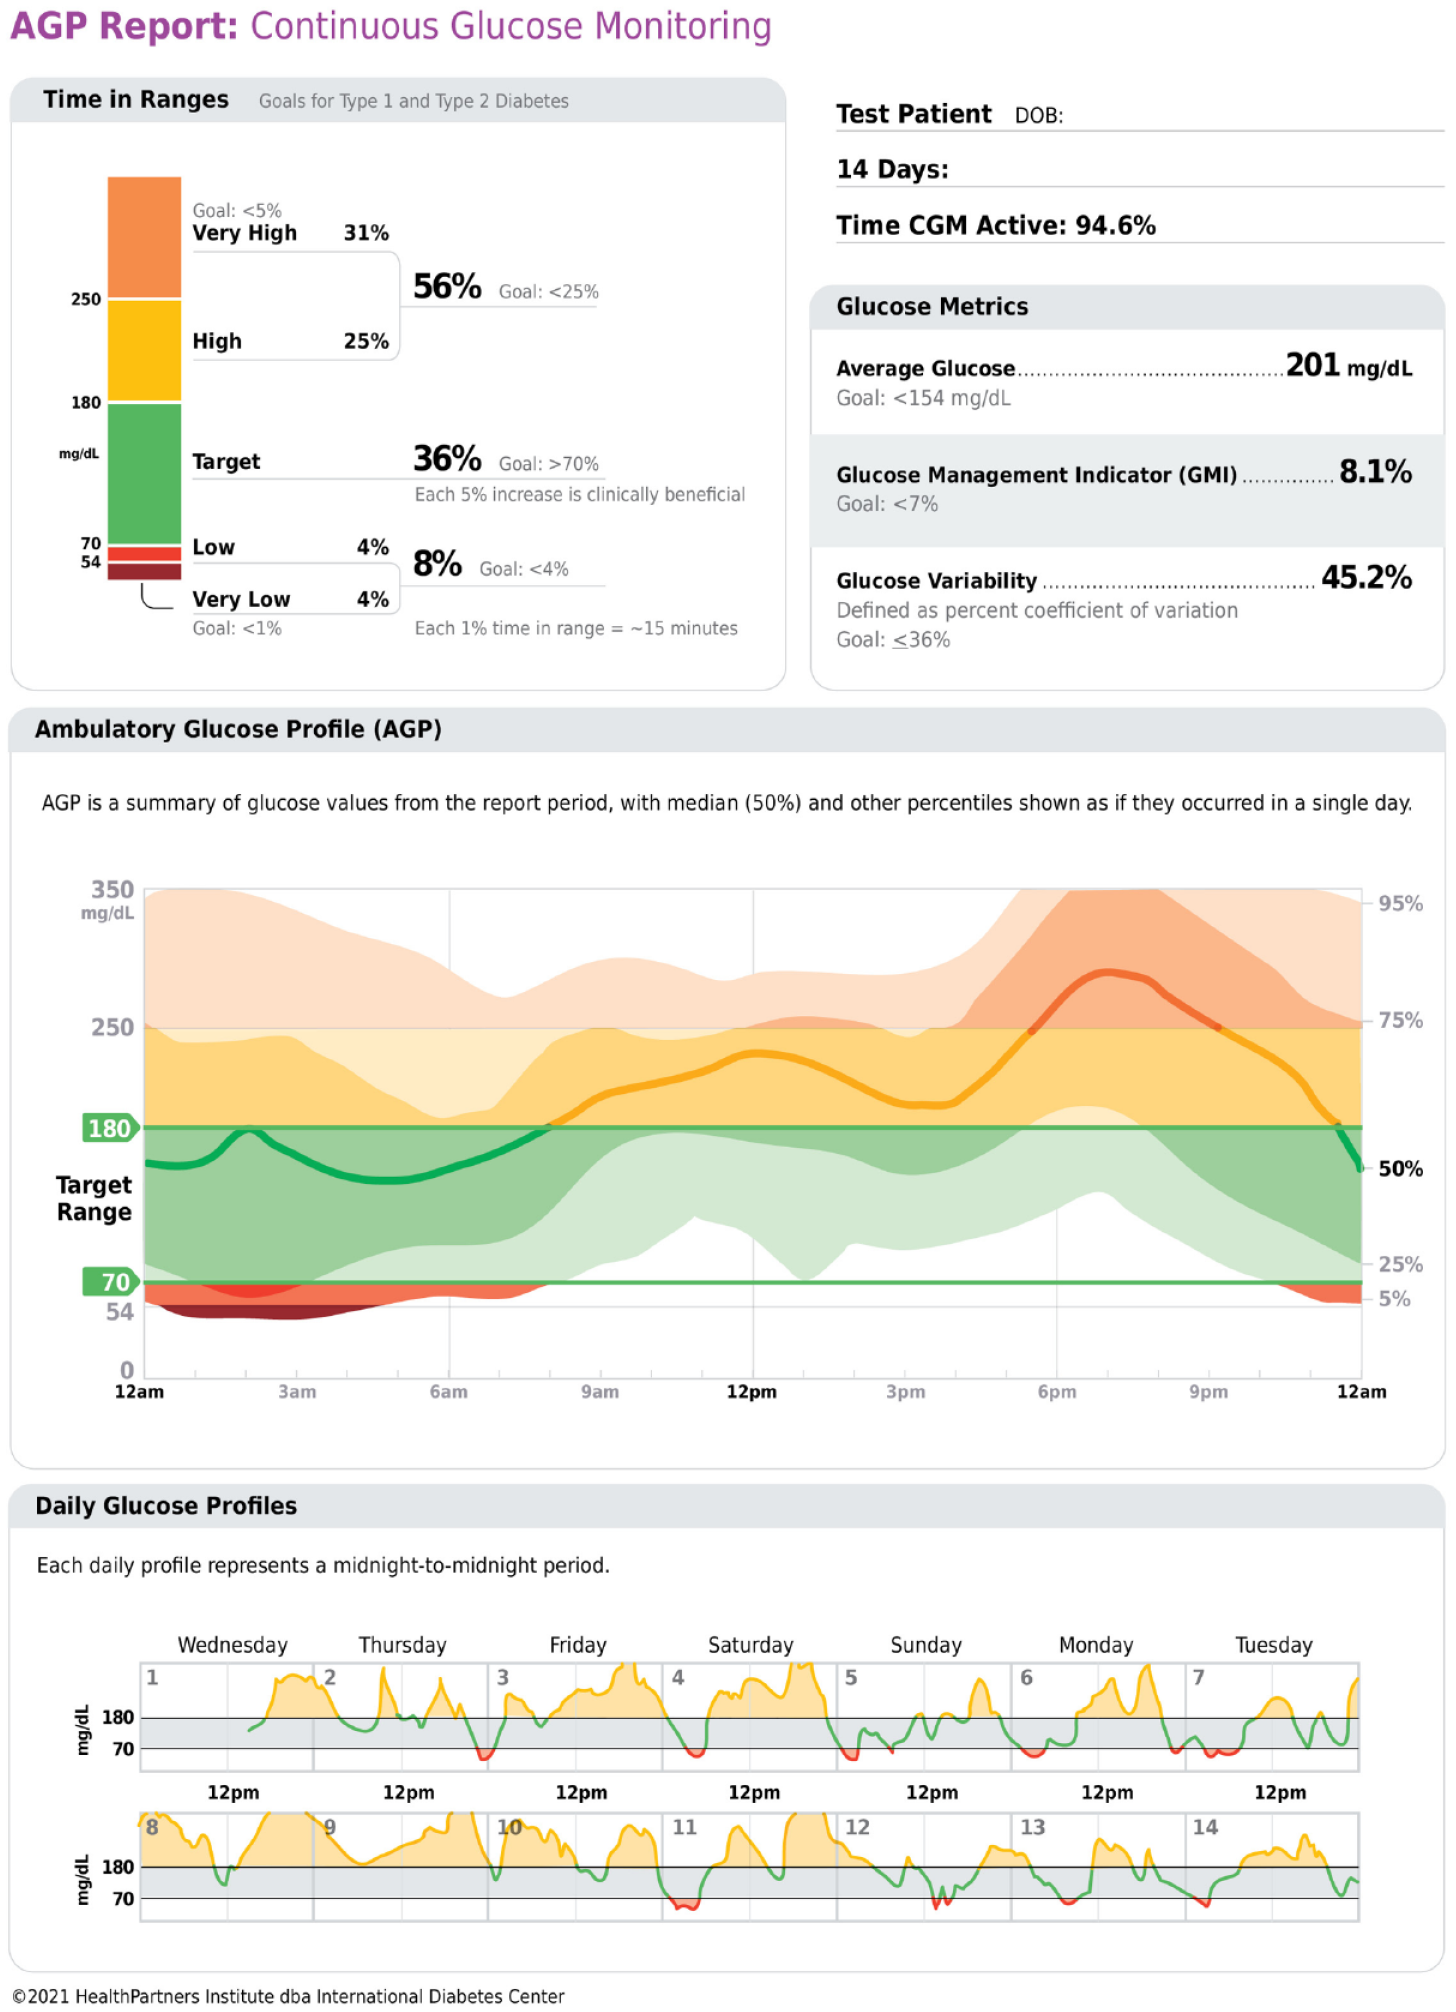
The standardized ambulatory glucose profile (AGP) report for continuous glucose monitoring (CGM) data.
The AGP was developed for SMBG in 1987, standardized into a consensus one-page report for CGM in 2013, and has continued to evolve to both match and set the accepted standards of glucose data visualization.9,10 The AGP is now recommended as an example of an international standard report in the ADA Standards of Medical Care in Diabetes and in the AACE Advanced Technology Guideline.2,11 The current version of the AGP (www.agpreport.org) uses a color-coded stacked bar to visualize the time spent in the designated glucose ranges of clinical importance. 12
While the AGP report contains the 10 core CGM metrics for analysis, the International Diabetes Center has introduced a rapid approach to AGP assessment for the busy clinician who begins by asking two questions, both involving the use of color:
Where the goal is
Look quickly at the glucose profile in the middle panel of the AGP report:
Then
This is the first version of the AGP report where the AGP patterns are now shown in colors to match the TIR bar colors. Other clinicians and researchers have also suggested the use of color to enhance the value of a CGM or CGM and insulin data reports.13,14 After, gradual but steady, lifestyle and medication adjustments guided by CGM, the goal is to achieve a glucose profile that is “flat, narrow and in-range” (FNIR—relatively flat median glucose line, narrow interquartile range or glucose variability, and most of the profile within the target glucose range).
Another relevant aspect are people who are color blind or have issue to separate certain colors (color ametropia). According to an older report in the literature, there are such deficits with blue-yellow vision in patients with diabetes, which may impair visual interpretation of home blood glucose monitoring strips. 15 It is of interest to note that in other areas of diabetes therapy, that is, insulin therapy, some years ago following an International Diabetes Federation (IDF) initiative, major insulin manufacturers have agreed on a universal color code for insulin preparations to avoid confusion of the patients (http://diabeteshormone.com/diabetes/Details.aspx?DiabetesID=86; International Diabetes Federation. Universal Color Code e-Atlas. 2003). Even in aviation (in the United Kingdom and Canada, patients with diabetes are allowed to be a pilot), standardized colors are recommended for defined inflight BG concentrations and ranges to prompt appropriate specified actions, designated as green, acceptable, 90-270 mg/dL (>5-15 mmol/L), amber, caution, 72-90 mg/dL (4-5 mmol/L) and >270-360 mg/dL (>15-20 mmol/L), and red, immediate action, <72 mg/dL (<4 mmol/L) and >360 mg/dL (>20 mmol/L). 16
The aim of this editorial is to suggest a harmonization (= standardization) on an international level for the colors used for indication of glucose ranges, major from a safety point of view (to avoid confusion); however, also to increase efficacy, we can aim to increase the green, that is, more TIR, and reduce the red, that is, TBR (= risk of hypoglycemia). The training materials and messages for medical staff and patients should be updated / made more consistent.
The goal of an effective CGM data report is not just to tabulate key metrics but to visualize the thousands of glucose data points collected over a 10- to 14-day period in a way that allows for a quick assessment of trends and facilitates an action plan. By adding standardized color elements with clinical correlations to glucose data reports, this may be a good example of the “medium is the message” (or at least a component of the message), a phrase coined by Canadian communication theorist, Marshall McLuhan, in his 1964 book Understanding Media: The Extensions of Man (ISBN 81-14-67535-7).
Footnotes
Abbreviations
AGP, ambulatory glucose profile; BG, blood glucose; CGM, continuous glucose monitoring; FNIR, flat, narrow, in-range; MG, LR, more green, less red; PwD, people with diabetes; SMBG, self-monitoring of blood glucose; TBR, time-below-range; TIR, time-in-range.
Declaration of Conflicting Interests
The author(s) declared the following potential conflicts of interest with respect to the research, authorship, and/or publication of this article: RMB has received research support, consulted, or has been on a scientific advisory board for Abbott Diabetes Care, Ascensia, Bigfoot Biomedical, CeQur, DexCom, Hygieia, Insulet, Lilly, Medtronic, Novo Nordisk, Onduo, Roche, Sanofi, and United Healthcare. His technology research is funded in part by NIH/NIDDK and Helmsley Charitable Trust. RMB’s employer, non-profit HealthPartners Institute, contracts for his services, and no personal income goes to RMB. GS has received unrestricted education grants from Abbott. LH hold shares in the Profil Institute for Metabolic Research, Neuss, Germany. LH is consultant for a range of companies that develop new diagnostic and therapeutic options for the treatment of patients with diabetes.
Funding
The author(s) received no financial support for the research, authorship, and/or publication of this article.