
Abstract
Background:
In the management of type 1 diabetes (T1D), systematic and random errors in carb-counting can have an adverse effect on glycemic control. In this study, we performed an in silico trial aiming at quantifying the impact of different levels of carb-counting error on glycemic control.
Methods:
The T1D patient decision simulator was used to simulate 7-day glycemic profiles of 100 adults using open-loop therapy. The simulation was repeated for different values of systematic and random carb-counting errors, generated with Gaussian distribution varying the error mean from -10% to +10% and standard deviation (SD) from 0% to 50%. The effect of the error was evaluated by computing the difference of time inside (∆TIR), above (∆TAR) and below (∆TBR) the target glycemic range (70-180mg/dl) compared to the reference case, that is, absence of error. Finally, 3 linear regression models were developed to mathematically describe how error mean and SD variations result in ∆TIR, ∆TAR, and ∆TBR changes.
Results:
Random errors globally deteriorate the glycemic control; systematic underestimations lead to, on average, up to 5.2% more TAR than the reference case, while systematic overestimation results in up to 0.8% more TBR. The different time in range metrics were linearly related with error mean and SD (R2>0.95), with slopes of
Conclusions:
The quantification of carb-counting error impact performed in this work may be useful understanding causes of glycemic variability and the impact of possible therapy adjustments or behavior changes in different glucose metrics.
Introduction
In the type 1 diabetes (T1D) therapy, blood glucose (BG) concentration is maintained within the safe range by exogenous insulin. 1 The American Diabetes Association recommends carbohydrate-counting in order to compute the meal insulin bolus, 2 whose beneficial effects on glycemic control, in terms of glycated hemoglobin, have been demonstrated by several studies.3-5 This approach consists in estimating the meal carbohydrates (CHO) amount, called carb-counting, and then computing the size of the meal insulin bolus by dividing the estimated CHO amount by a patient-specific factor called carbohydrate-to-insulin ratio. 6 However, many people living with T1D find carb-counting difficult, and despite receiving specific training about how to estimate the CHO content of different foods and meals, frequently under- or over-estimate carbohydrate content that can result in excess glucose excursions.7-11 In a recent study, we demonstrated that carb-counting error depends on meal CHO amount and type. 12 Recently, some smartphone applications13-15 were designed to support T1D subjects with carb-counting, but such applications are at present used only by a minority of individuals.
Some studies attempted to quantify the impact of carb-counting error on T1D patients glycemic control, showing that CHO underestimation can cause postprandial hyperglycemia, while CHO overestimation can lead to hypoglycemic episodes.16-20 Moreover, Smart et al 21 found that an error of ±10g per meal or snack on a meal size of 60g did not significantly deteriorate the postprandial control, while a ±20g error had a significant impact on postprandial glycemia. 22
Although errors in carb-counting can be mitigated by the adoption of closed-loop insulin delivery systems, 23 these systems are still used by only a fraction of people with T1D. A precise quantification of the impact of carb-counting errors on glycemic control in a real-life setting would be desirable. An intrinsic limitation of the existing studies lies in the difficulty to isolate the contribution of a single factor, the carb-counting error, from the contribution of many other factors that affect the daily glycemic profile of T1D subjects (eg, insulin sensitivity variability, amount and time of meals, physical activity and others). This limitation can be overcome by performing in silico trials, in which the impact of each factor can be isolated by performing multiple simulations in which a single factor is changed and all the other factors are fixed. A suitable tool for this purpose is the T1D patient decision simulator (T1D-PDS), based on the well-known FDA-approved UVA/Padova T1D physiological model,24,25 a simulation tool that allows performing in silico trials in T1D and was shown to reproduce realistic treatment scenarios. 26
In this work, we use the T1D-PDS to perform a sensitivity analysis aimed at quantifying the impact that different levels of carb-counting error have on glucose control indexes. For sake of simplicity, we do not consider the possible role of specific closed-loop algorithms and limit the analysis to virtual T1D patients treated with a standard open-loop therapy. The simulation study is first made in a single-meal scenario, to evaluate in an ideal, disturbance-free setting the impact of the error on the post prandial glucose, and then in a multi-meal scenario, to quantify the impact of the error repeated in time on the overall glycemic control represented by time in ranges. From the latter analysis, mathematical formulas which describe how time in ranges change in response to carb-counting error variations are obtained. These formulas provide, for the first time, a mathematical quantification of the extent to which carb-counting error impact glycemic control in an open-loop scenario. Such evidence could be important to assist diabetologists in patients’ therapy adjustments and to build an educational tool to help patients in understanding the detrimental effects of carb-counting error.
Methods
Single-Meal Analysis
Simulation scenario
The T1D-PDS 26 has been used to simulate a population of 100 virtual adults undergoing multiple single-meal scenarios in a disturbance-free environment in which the meal insulin dose is calculated using the CGM value at mealtime, the therapy parameters (basal insulin injection rate in the pump, carbohydrate-to-insulin ratio CR, correction factor CF) are set to their optimal value, post-prandial correction boluses and hypo-treatments as well as the time-variability of insulin sensitivity are switched-off.
In each single-meal scenario, for each virtual subject, the simulation starts at 6:00, a meal with 60g of CHO is generated at 8:00, and the respective meal insulin bolus dose is calculated as:
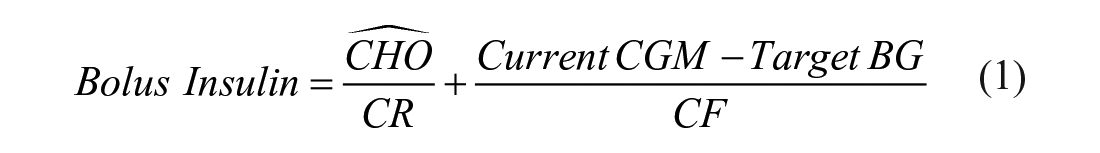
The carb-count,

where
This kind of scenario permits us to focus on the impact that the carb-counting error has on the post-prandial glucose control, eliminating any confounding factors.
Carb-counting error generation
In each simulation, a fixed value of the carb-counting error is simulated, equal for all the subjects. Based on the analysis of real data published in Brazeau et al,
9
we tested values of the signed relative error
The absence of carb-counting error, that is, when the carb-count is exactly equal to the real meal CHO amount (
Glucose control metrics
In the time window from mealtime (8:00) to 6hours after (14:00), the following glucose control metrics were computed: the BG post-prandial peak, the time from meal in which such peak occurs, the BG level at 120minutes after the meal, the area under the glycemic curve in hypoglycemia and hyperglycemia.
Moreover, for each of these metrics, their difference compared to the reference case (ie,

Sensitivity to carb-counting error on post-prandial glucose
The effect of different levels of the error on post-prandial glucose was evaluated via graphical representation of the glycemic profiles of a representative virtual subject and by looking at the distribution of the glucose control metrics in the 100 subjects with a boxplot representation.
Multi-Meal Analysis
Simulation scenario
After evaluating the impact of the carb-counting error on a single meal, disturbance-free environment, we generated a more complex and realistic scenario, by simulating the same population of 100 virtual subjects for 7days, with 3 meals per day (ie, breakfast, lunch and dinner) and open-loop therapy based on non-adjunctive CGM use. The scenario included the use of sub-optimal therapy parameters, post-prandial correction boluses, hypo-treatments, and intra-patient variability of insulin sensitivity. Meal amounts were randomly generated from Gaussian distributions fitted on the real data extracted from Brazeau et al. 9
The entire simulation was repeated for different values of the carb-counting error, while maintaining the same surrounding conditions.
Carb-counting error generation
In the generated multi-meal scenario, 2 components of the carb-counting error were investigated: the systematic error and the random error. For this reason, the signed relative error

where the mean M accounts for the systematic error committed by the subject, while the standard deviation SD reflects the random error.
Different signs and magnitudes of error were tested by using different mean and standard deviation values. In particular, we tested mean values of ±10%, ±5%, and 0%, where a negative error sign meant meal CHO underestimation, while a positive sign indicated meal CHO overestimation. For each of the mean values, we tested different values of the standard deviation, which were 0%, 10%, 20%, 30%, 40%, and 50%. Such values of error parameters have been suggested by the analysis of real data published by Brazeau et al, 9 in which the error mean for the 50 subjects involved in the study (expressed as mean±standard deviation) was −7.64%±10.18%, while the subjects error standard deviation was 18.10%±9.19%.
Moreover, each of the Gaussian distributions was truncated at −100%, which means a CHO estimate of 0g, and +100%, which means a CHO estimate of twice the real meal amount, in order to avoid unrealistic realizations of the carb-counting error.
The case of 0% mean, accounting for the absence of systematic error, and 0% standard deviation, which means that no random error is present, was considered as the reference value

Glucose metrics
From the 100 subjects’ glycemic profiles obtained, the following metrics were computed: Time In target Range (TIR), that is, the percentage of BG values between 70 and 180mg/dl; Time Above Range (TAR), that is, the percentage of BG values greater than 180mg/dl; Time Below Range (TBR), that is, the percentage of BG values lower than 70mg/dl.
Moreover, the delta time in ranges compared to the reference case, that is, ∆

Sensitivity to carb-counting error in the multi-meal scenario
Firstly, the impact of the carb-counting error was evaluated via boxplot representation of the delta time in ranges distribution among the 100 subjects and by plotting the curve of the delta metrics for different values of M and SD. Secondly, mathematical formulas were derived to quantify the relationship between delta time in ranges and different values of the systematic error (M) and the random error (SD). Specifically, 3 multiple linear regression models were identified by using as output the mean of delta time in ranges among the 100 virtual subjects and as inputs both the error mean and the standard deviation, as follow:


The linearity of the relationship between inputs and each output was verified by computing the coefficient of determination R2 of the models. The slope coefficients α and β are sensitivity indices, which permit quantification of the strength of the impact of the 2 factors under study on the time in ranges metrics.
Results
Single-Meal Analysis
Sensitivity to carb-counting error on post-prandial glucose
Figure 1 shows the glycemic curves of a representative virtual subject for different carb-counting error levels up to 6hours after the mealtime. We can see that CHO overestimation mitigates the peak BG level compared to the case of absence of error (black line), but it leads to BG levels lower than 70mg/dl for errors larger than 10%. The larger the error, the sooner the hypoglycemic event happens. On the other hand, CHO underestimation leads to higher BG values in all the next 6hours.
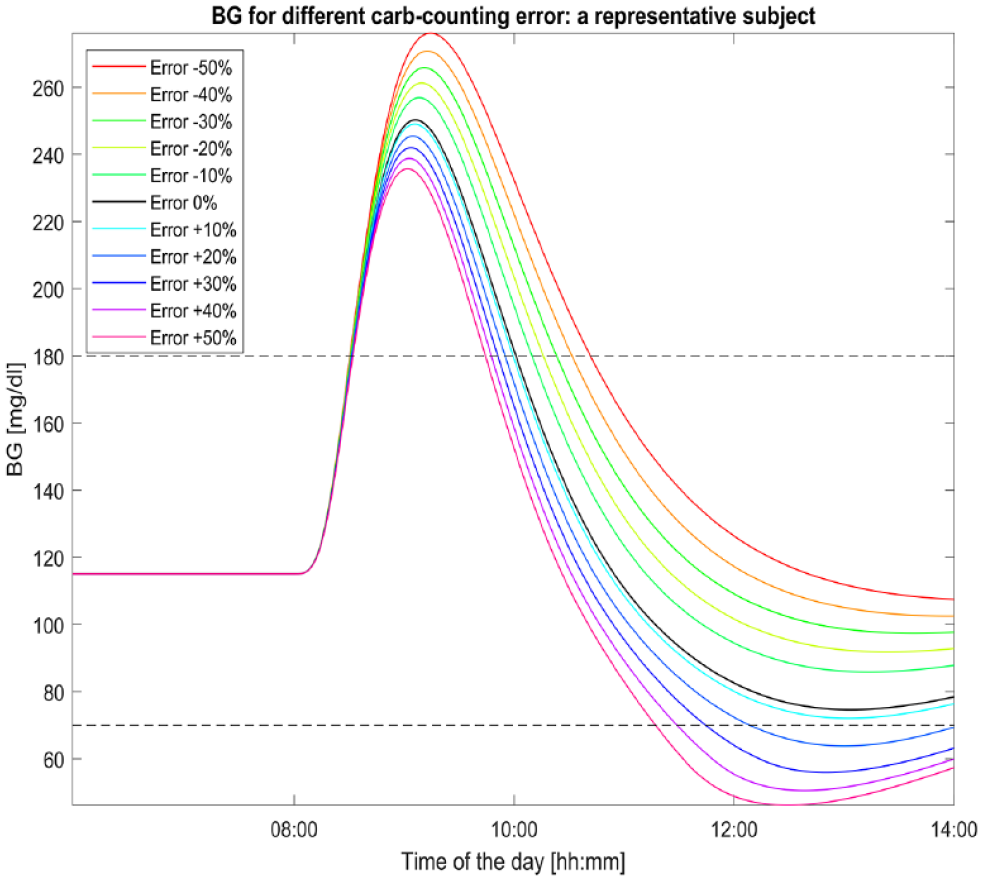
Glycemic profiles of a representative subject for different carb-counting error levels. The black curve (the one with error equal to 0%) represents the subject BG excursion in absence of carb-counting error. A meal of 60grams of CHO is given to the subject at 8:00.
The distributions of the postprandial glucose control metrics in the overall virtual population, expressed as differences compared to the reference case (
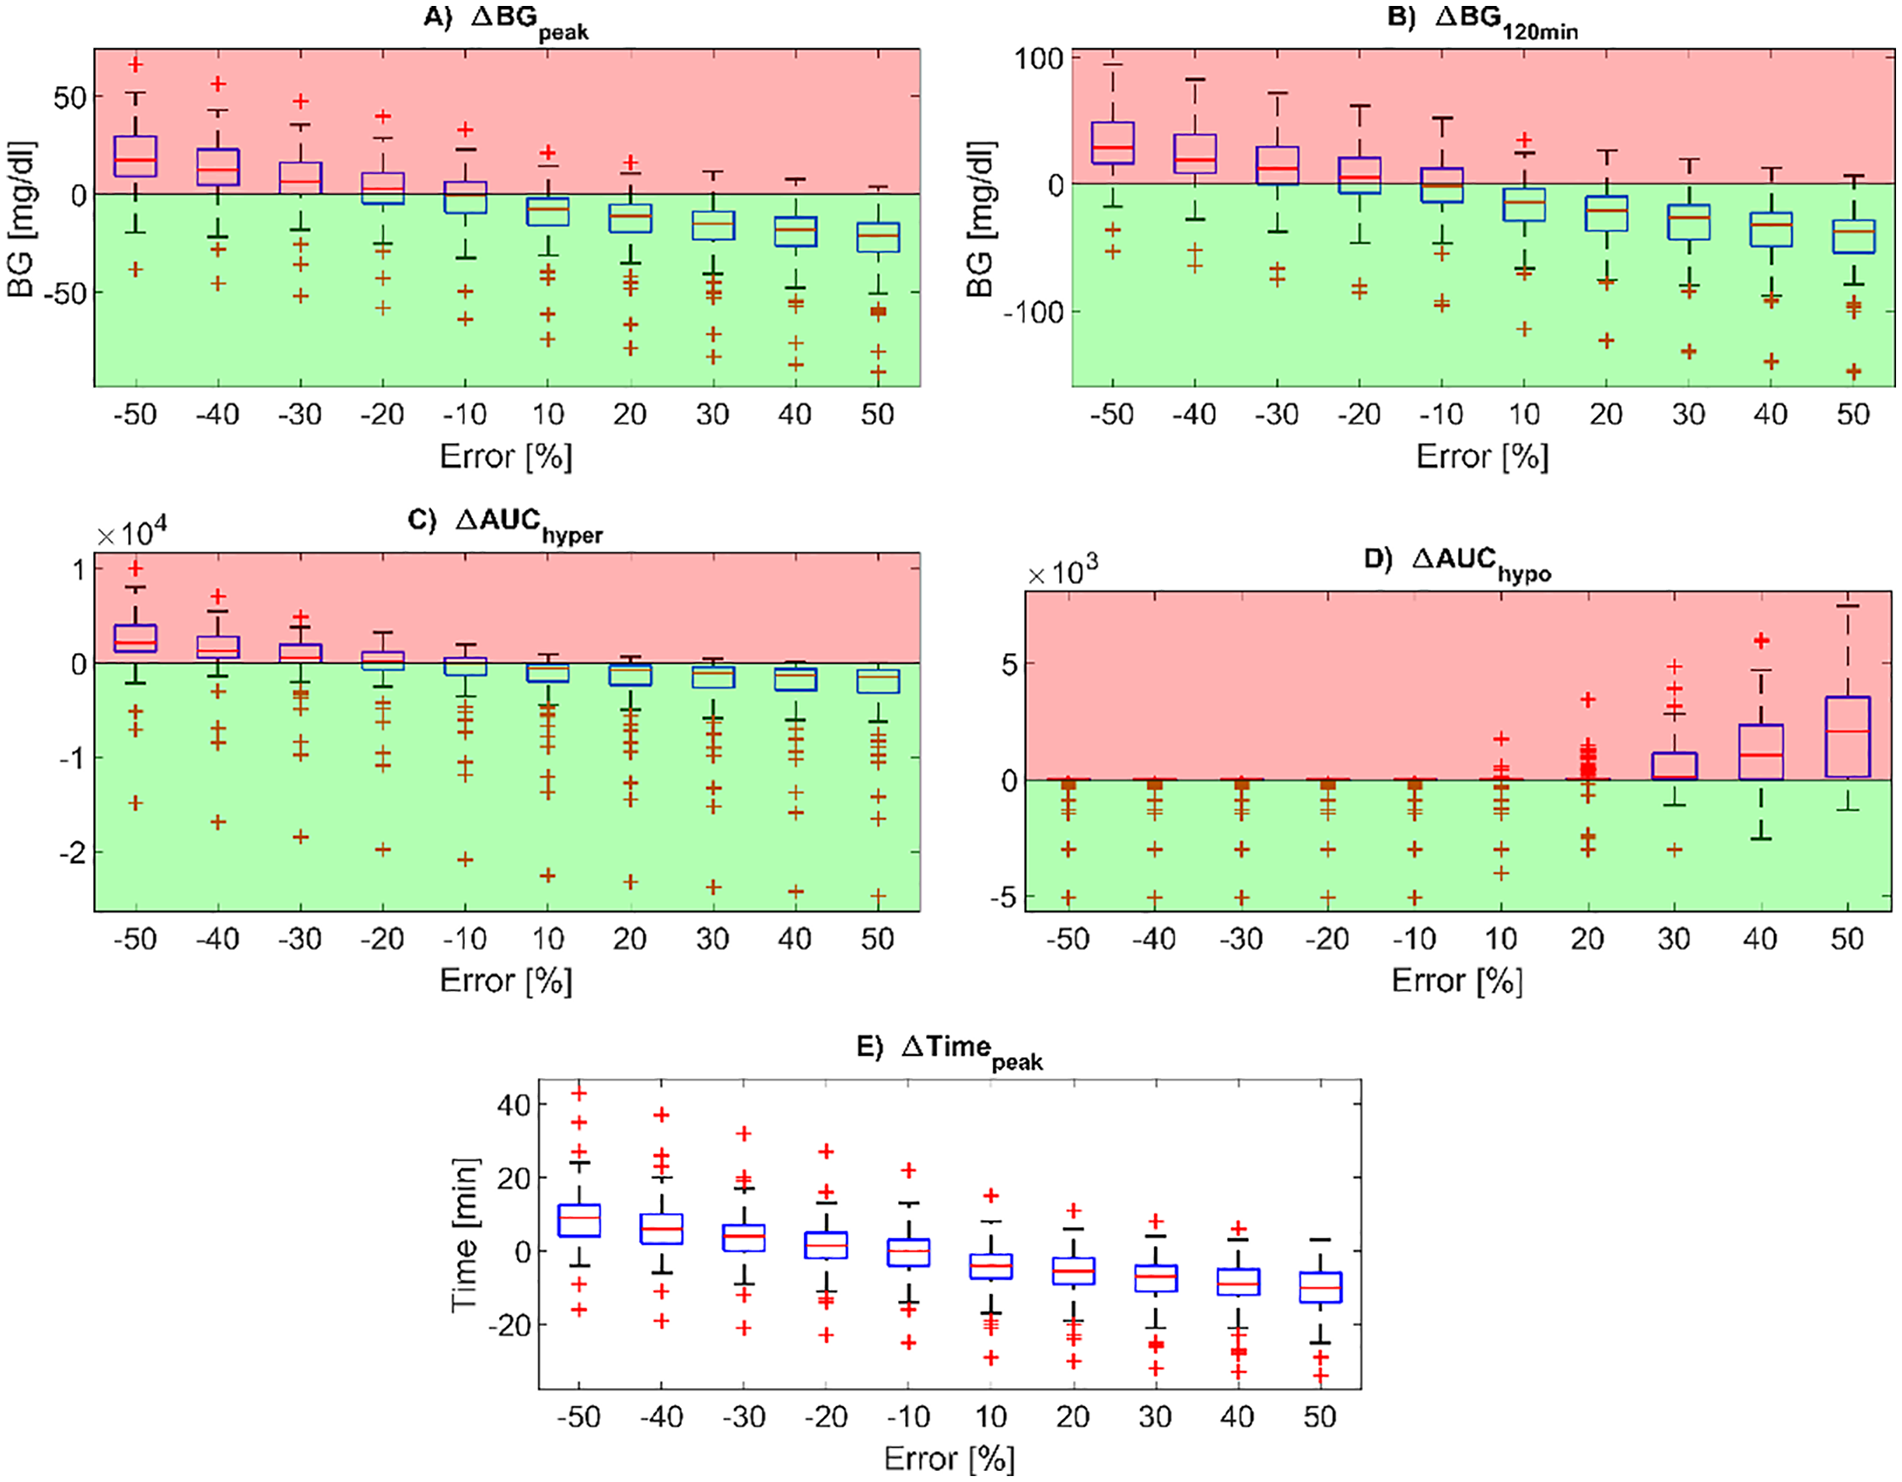
Boxplots of the difference in post-prandial glucose control metrics compared to the reference case, for all the carb-counting error values tested (on the x-axis). In particular, the BG peak level (panel A), BG level at 120min after the mealtime (panel B), peak time from mealtime (panel E), AUC in hyperglycemia (panel C) and AUC in hypoglycemia (panel D) are reported. Red zones are the ones in which the metrics are worse than for the reference case, while the green zones are the ones in which the metrics are better than for the reference case. In each boxplot, the red horizontal line represents the median, the blue box marks the interquartile range, dashed lines are the whiskers, and red crosses indicate outliers. Whiskers are drawn from the ends of the interquartile range to the adjacent values, which are the most extreme data values that are not outliers. By default, an outlier is a value that is more than 1.5 times the interquartile range away from the top or bottom of the box.
Multi-Meal Analysis
Sensitivity to carb-counting error in the multi-meal scenario
Panels A, B and C of Figure 3 report the boxplots of the delta time in ranges metrics (∆
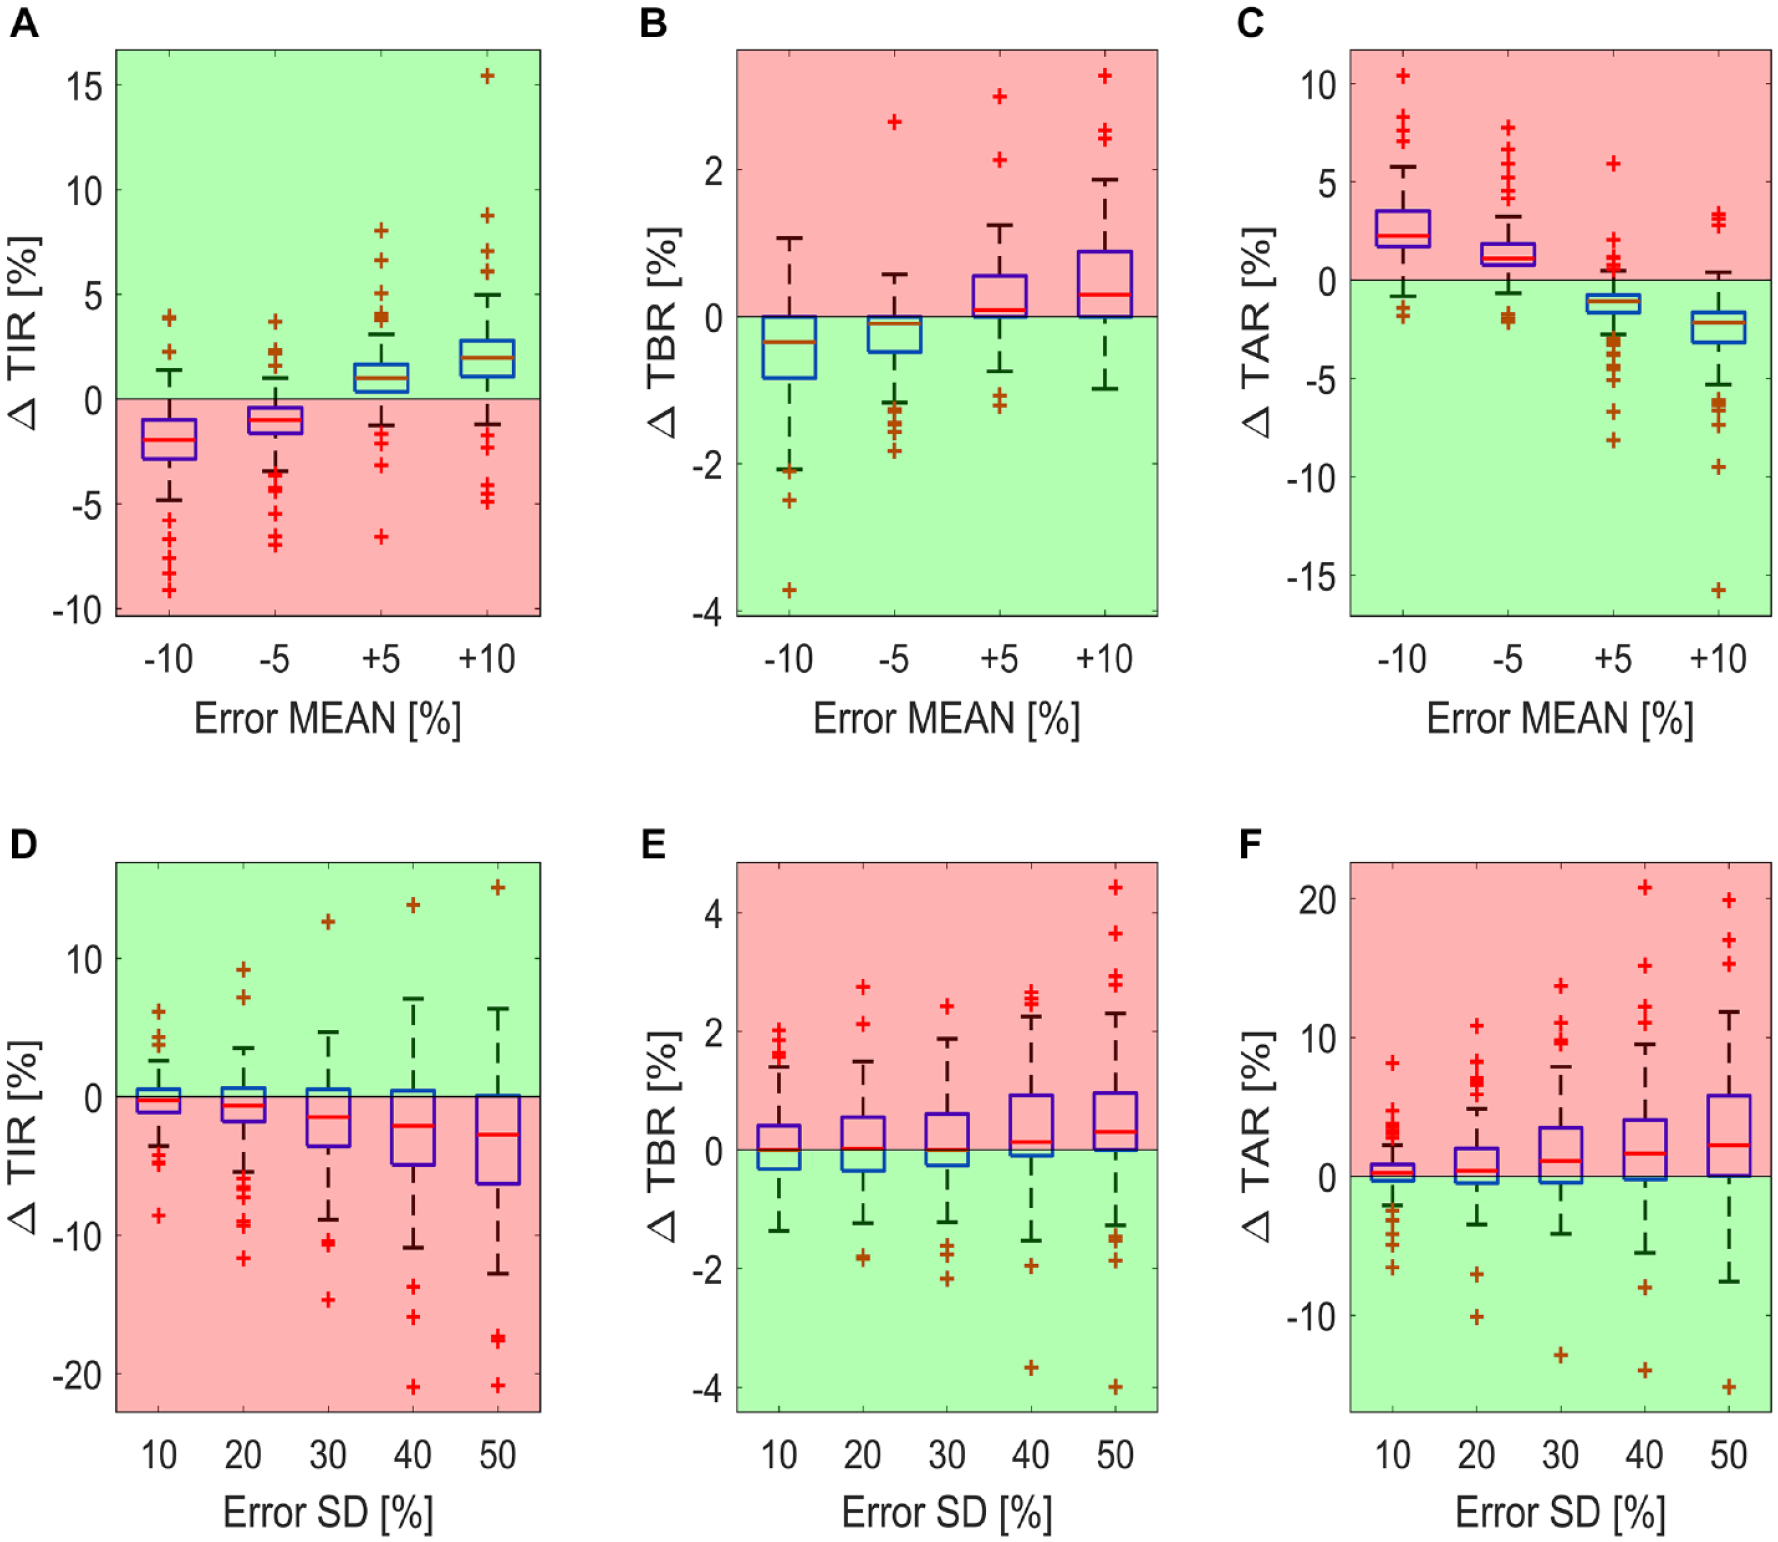
Boxplot of the difference in time in ranges compared to the reference case for the 100 virtual subjects. The boxplots of the ΔTIR, ΔTAR, and ΔTBR for carb-counting error SD fixed to 0 and by varying the carb-counting error mean are reported in panels A, B and C, respectively. The boxplots of the ΔTIR, ΔTAR, and ΔTBR for carb-counting error mean fixed to 0 and by varying the carb-counting error SD are reported in panels D, E, and F, respectively. Red zones are the ones in which the metrics are worse than for the reference case, while the green zones are the ones in which the metrics are better than for the reference case.
Panels D, E and F of Figure 3 report the impact of the random error on the glycemic control metrics, in the absence of a systematic error. In fact, in this case, the boxplots represent the distribution of the delta time in ranges metrics (
Figure 4 reports the bidimensional maps of the mean among the 100 subjects of the delta time in ranges metrics, for all the tested combinations of carb-counting error mean and SD. Systematic underestimation with high random error leads to up to 5.2% more of mean TAR and 5.3% less of mean TIR compared to the reference. Note that, according to the International Consensus on time in ranges, 27 a difference of 5% in TIR is clinically significant for individuals with T1D. Regarding the cases with systematic overestimation, the presence of large random errors results in up to a 0.8% increase of TBR over the reference. Note that the virtual subjects intake of hypotreatments, which is enabled in this simulation scenario, probably mitigates the increase of TBR due to the carb-counting error.
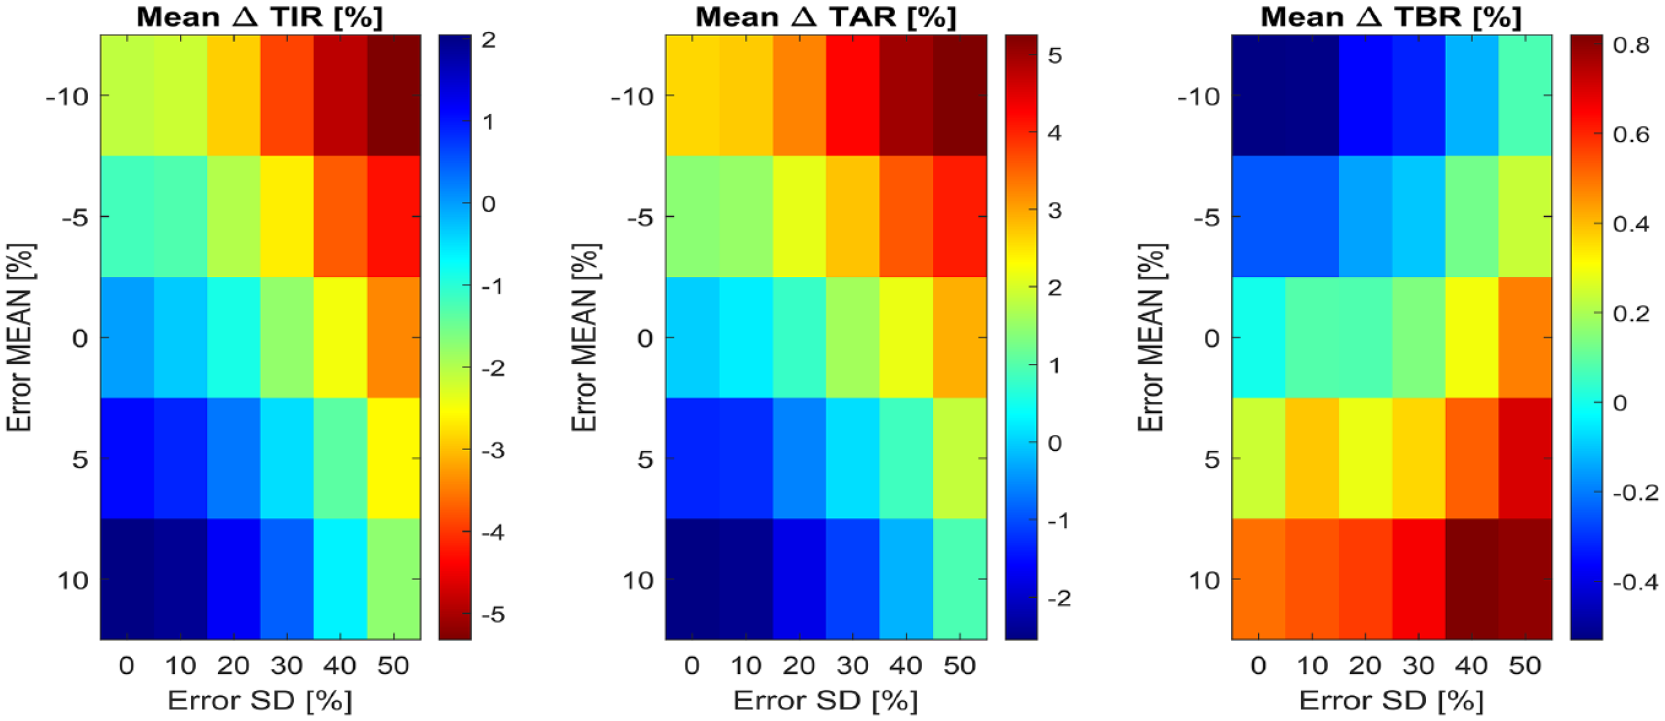
Bidimensional maps of the mean among the 100 virtual subjects of ΔTIR (at left), ΔTAR (in the middle) and ΔTBR (at right), for all combinations of carb-counting error mean and SD tested. In each map, the x-axis represents error SD, while the y-axis the error mean. Each color represents a different quantitative value of the metric, reported by the legends on the right of each map.
The mean among the 100 virtual subjects of the delta time in ranges is plotted in Figure 5 for different values of carb-counting error mean (panels A, B, and C) and SD (panels D, E, and F). Looking at the plots of Figure 5, we notice that while the starting point of each curve is different, depending either on the error mean or on its standard deviation, the plots present a similar linear trend, with a different rate of change for the different time in ranges.
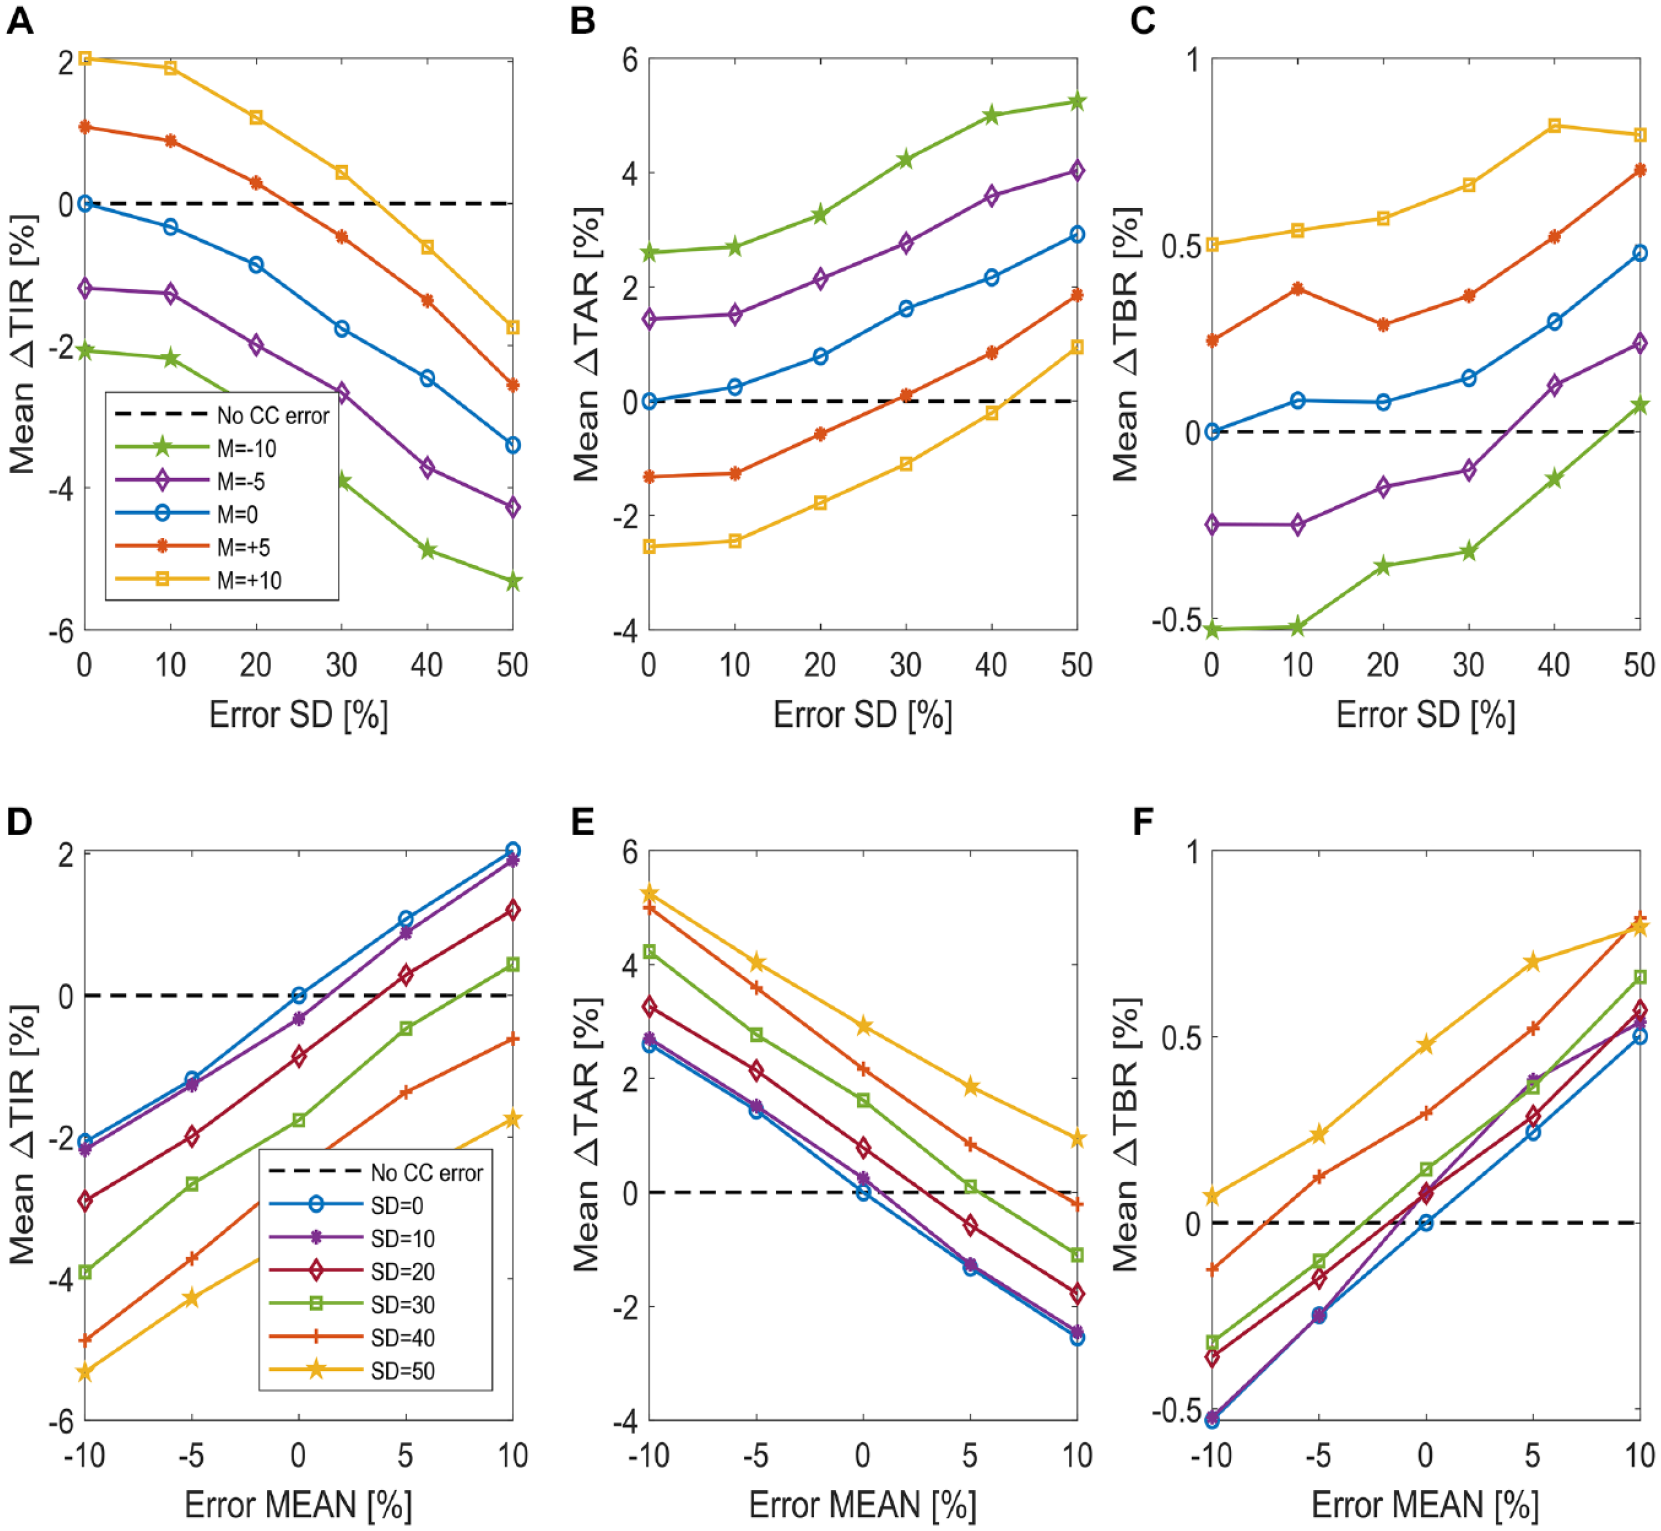
Plot of the mean difference in time in ranges among the 100 virtual subjects. The mean of ∆TIR, ∆TAR and ∆TBR by varying the carb-counting error SD and for different carb-counting error mean values is reported in panels A, B, and C, respectively (figures legend is reported in panel A). The mean of ∆TIR, ∆TAR, and ∆TBR by varying the carb-counting error mean and for different carb-counting error SD values is reported in panels D, E, and F, respectively (figures legend is reported in panel D).
This suggests that the use of a linear technique to model the relationship which links the carb-counting error mean M and standard deviation SD to variations of time in ranges may be appropriate.
Therefore, 3 multiple linear regression models were fitted by using as outcome the delta time in ranges and as regressors M and SD. The resulting models are:


The coefficient of determination R2 is equal to 0.982 for the model described by equation (10), 0.987 for the one described by equation (11) and 0.970 for the model with equation (12). The obtained R2, very close to 1, confirm that a linear technique is appropriate for such data.
Such formulas permit us to quantify how much time in ranges change (compared to the reference case) in response to different levels of systematic and random carb-counting errors. For example, considering equation (10), we can deduce that a carb-counting error with mean of −5% and SD of 10% leads to a ∆TIR equal to −1.75%. This means that TIR decreases of 1.75% compared to the value of TIR which we would have in the reference case, that is, in absence of carb-counting error (M=0, SD=0). For the same value of error mean but increasing the SD to 50%, we obtain a ∆TIR of −4.55%, that is, a TIR deterioration of 4.55% compared to the reference case.
Conclusions
While errors in carbohydrate-counting are recognized as most common reasons for glycemic excursions in people with T1D, there are few data that can quantify their impact on glycemic indices. In this work, we filled this gap by analyzing the data of an in-silico trial performed by using the T1D-PDS. Firstly, the postprandial glucose excursions of 100 virtual subjects after a meal of 60-grams of CHO were simulated for different levels of the carb-counting error in an ideal, disturbance-free scenario, to focus on the impact of the carb-counting error without any other correction actions which could influence the profiles. Differently from other previous studies, in this work a wider range of variation of the error (from ±10% to ±50% of the meal CHO amount) were investigated. Then, the impact of different carb-counting error levels on time in ranges (TIR, TAR, TBR) was evaluated by simulating 100 subjects for 7-days, repeating the simulation with the same surrounding conditions for different levels of the systematic (from −10% to +10%) and the random (from 0% to 50%) carb-counting error. We found that random errors globally deteriorate the glycemic control; systematic underestimation leads to an increase of TAR of up to 5.2% compared to the reference case, while systematic overestimation increases the TBR of up to 0.8% compared to the reference case. Finally, by using the generated multi-meal simulated data, we developed 3 linear formulas which put the difference in TIR, TAR, and TBR compared to the reference case (which corresponds to the absence of carb-counting error) in relation with systematic and random carb-counting errors. These formulas permit, assuming an open-loop therapy scenario, quantification of the impact of different levels of systematic and random carb-counting error on the time in ranges.
This quantification of the impact of different types of carb-counting errors can be valuable to clinicians, researchers and people with diabetes to explain some of the glycemic excursions that occur, as well in aiding decisions around therapy adjustments. For example, the diabetologists can use the formulas we derived to guess how much the glycemic control of a patient can improve if a specific training is programmed for limiting the subject’s systematic or random error in carb-counting. In an equivalent way, the diabetologist can opt for adjusting the patient’s carbohydrate-to-insulin ratio in order to compensate a systematic error in carb-counting by producing the same benefits in time in ranges estimated by our formulas. However, even if the quantification of the carb-counting error impact can be useful to clinicians for the reasons explained above, we do not provide any indication about how diabetologists must adjust therapy parameters based on our findings. Moreover, the obtained formulas can also be integrated in educational tools usable to help subjects in understanding the detrimental effects of some behavioral aspects, such as carb-counting error, on glycemic control.
It is important to remark that the quantitative results reported in this paper are valid in an open-loop scenario only. Indeed, we expect that the impact of the carb-counting error may be mitigated by the use of sophisticated closed-loop approaches and technologies. It is possible that these formulas can be used to stress-test the impact of carbohydrate counting errors in novel closed-loop algorithms.
Moreover, it must be emphasized that, in our study, we simulated rapidly absorbed meals completely made of CHO, since the T1D-PDS does not include a model of the absorption of more complex meals containing also proteins and fats, and thus it cannot simulate slow-absorption meals. Of course, the impact of the carb-counting error could be different if slow-absorption meals and/or the effect of other macronutrients are considered in the analysis. If an updated meal absorption model should become available and be included in the T1D-PDS, the analysis performed in this paper could be repeated considering different meal compositions.
To conclude, we point out that the same paradigm proposed here could be extended to the quantitative analysis of the role of other behavioral factors in the management of T1D that have a detrimental impact on glycemic control: delays in meal insulin bolus, wrong estimation of insulin on board, excessive or insufficient hypotreatment dose, inappropriate CGM alert settings, delay in responding to CGM alerts. Thus, future work could also include the development of a suitable mathematical methodology to compare the impact of these behavioral factors on glycemic control indices and, eventually, provide healthcare providers and educators with a ranking indicating which behavioral factors influence glycemic control most.
Footnotes
Abbreviations
AUC, Area Under the Curve; BG, Blood Glucose; CGM, Continuous Glucose Monitoring; CHO, Carbohydrates; TAR, Time Above Range; TBR, Time Below Range; T1D, Type 1 Diabetes; T1D-PDS, Type 1 Diabetes Patient Decision Simulator; TIR, Time In target Range.
Declaration of Conflicting Interests
The author(s) declared no potential conflicts of interest with respect to the research, authorship, and/or publication of this article.
Funding
The author(s) disclosed receipt of the following financial support for the research, authorship, and/or publication of this article: This study is part of Hypo-RESOLVE (Hypoglycemia—Redefining SOLutions for better liVEs) (![]() ), a project currently ongoing (1.5.2018-30.4.2022) which has received funding from the Innovative Medicines Initiative 2 Joint Undertaking (JU) under grant agreement No 777460. The JU receives support from the European Union Horizon 2020 research and innovation programme and EFPIA and T1D Exchange, JDRF, International Diabetes Federation (IDF), The Leona M. and Harry B. Helmsley Charitable Trust.
), a project currently ongoing (1.5.2018-30.4.2022) which has received funding from the Innovative Medicines Initiative 2 Joint Undertaking (JU) under grant agreement No 777460. The JU receives support from the European Union Horizon 2020 research and innovation programme and EFPIA and T1D Exchange, JDRF, International Diabetes Federation (IDF), The Leona M. and Harry B. Helmsley Charitable Trust.