
Abstract
Background:
Hospitalized patients who are receiving antihyperglycemic agents are at increased risk for hypoglycemia. Inpatient hypoglycemia may lead to increased risk for morbidity, mortality, prolonged hospitalization, and readmission within 30 days of discharge, which in turn may lead to increased costs. Hospital-wide initiatives targeting hypoglycemia are known to be beneficial; however, their impact on patient care and economic measures in community nonteaching hospitals are unknown.
Methods:
This retrospective quality improvement study examined the effects of hospital-wide hypoglycemia initiatives on the rates of insulin-induced hypoglycemia in a community hospital setting from January 1, 2016, until September 30, 2019. The potential cost of care savings has been calculated.
Results:
Among 49 315 total patient days, 2682 days had an instance of hypoglycemia (5.4%). Mean ± SD hypoglycemic patient days/month was 59.6 ± 16.0. The frequency of hypoglycemia significantly decreased from 7.5% in January 2016 to 3.9% in September 2019 (P = .001). Patients with type 2 diabetes demonstrated a significant decrease in the frequency of hypoglycemia (7.4%-3.8%; P < .0001), while among patients with type 1 diabetes the frequency trended downwards but did not reach statistical significance (18.5%-18.0%; P = 0.08). Based on the reduction of hypoglycemia rates, the hospital had an estimated cost of care savings of $98 635 during the study period.
Conclusions:
In a community hospital setting, implementation of hospital-wide initiatives targeting hypoglycemia resulted in a significant and sustainable decrease in the rate of insulin-induced hypoglycemia. These high-leverage risk reduction strategies may be translated into considerable cost savings and could be implemented at other community hospitals.
Background
Hospitalized patients, with or without diabetes, who are receiving antihyperglycemic agents are at increased risk for hypoglycemia, 1 and an estimated 25% of hospitalized patients receive an antihyperglycemic agent during their stay. 2 Inpatient hypoglycemia may lead to increased risk for morbidity, mortality, prolonged hospitalization, and readmission within 30 days of discharge, which in turn may lead to increased costs. 3
Among all patients admitted to general medical ward, hypoglycemia prevalence ranges from 3.5% to 10.5%, and about one-half of hypoglycemic events occur in patients with diabetes or receiving insulin treatment. 4 Mortality rates have been documented to be as high as 6.5% of hospitalizations with a hypoglycemic event compared to 3.8% without, and common comorbidities were more frequent in patients hospitalized with a hypoglycemic event. 5 Hypoglycemia has been minimized through risk factor reduction with the use of clinical strategies including standardized reporting, order sets, and hypoglycemia protocols in addition to implementation of technological tools such as electronic medical records, continuous subcutaneous insulin infusion pumps, and continuous glucose monitoring technology with predictive scores and remote surveillance capability. 6
The cost of diabetes is currently accounting for almost $250 billion (one in four healthcare dollars spent in the United States). 7 It is estimated that hypoglycemia may add 31% to the overall cost for an inpatient stay, with the average cost of $4312 per admission. 3 As a result, maintaining glycemic control in inpatient settings has received amplified consideration over the past few decades.8,9
Hospital-wide initiatives targeting hypoglycemia are known to be beneficial;1,2,8 however, their impact on patient care and economic measures in community nonteaching hospitals is unknown. 8 Our objective was to evaluate whether hospital-wide initiatives targeting inpatient hypoglycemia would reduce its frequency and lead to potential cost savings.
Methods
Study Population
This was a retrospective analysis of patients 18 years and older hospitalized at Suburban Hospital, a 240-bed community hospital within the Johns Hopkins Health System, from January 1, 2016, until September 30, 2019. Patients must have received at least 1 unit of insulin during their hospitalization to be included in the analysis. The study protocol was approved by the hospital’s Institutional Review Board.
Hospital-Wide Initiatives
Hospital-wide initiatives were directed and overseen by the Suburban Hospital Glucose Steering Committee, as previously described. 8 Briefly, it is an interdisciplinary team consisting of an endocrinologist, pharmacist, diabetes nurse educators, nurse practitioner, transition guide nurses, critical care nurse educator, dietitian, information technology specialist, community health and wellness nurses and staff, patient and family advisor, and quality improvement representative. The goal of the team was to oversee all aspects of diabetes management and implement systems, protocols, and procedures to ensure a high quality of care throughout the inpatient setting and beyond discharge.
The committee identified 4 main causes of insulin-induced hypoglycemia. First, a lack of a unified hypoglycemia protocol caused variations in how nurses and providers that specialized in diabetes treatment managed direct care. These differences in care coordination resulted in higher rates of insulin-induced diabetes. Second, the existing insulin infusion protocol for the critical care setting had the target blood glucose of 80-110 mg/dL, as opposed to currently recommended target of 140-180 mg/dL, 9 causing insulin-induced hypoglycemia virtually in every patient placed on the insulin drip. Third, most of the patients with diabetes were managed with correctional or “sliding” scale insulin only. Correctional scale refers to gradual increases in premeal insulin doses based on predefined blood glucose levels. This reactive approach has been found to inadequately take into account the amount of carbohydrate in the meal to be consumed as well as various other patient-specific factors; failing to consider these factors may lead to further episodes of hyperglycemia and hypoglycemia. 10 Additionally, the results of the Randomized Study of Basal-Bolus Insulin Therapy in the Inpatient Management of Patients With Type 2 Diabetes (RABBIT 2 trial) found basal-bolus insulin therapy to achieve the blood glucose target in 68% of patients compared to 38% in the sliding-scale regular insulin group, further invalidating prior correctional scale-only approach. 11 Finally, a lack of reporting of hypoglycemia occurrences and oversight resulted in the inability for diabetes specialists to track quality metrics and prospectively plan interventions.
The committee designed and implemented multiple original and creative approaches to address the hypoglycemia challenge. Suburban Hospital implemented Endocrine Hospitalist and the Inpatient Diabetes Management Service (IDMS) at the end of 2015,12-14 and IDMS worked to integrate each of the approaches described below. The hypoglycemia initiatives were a part of a broader set of comprehensive diabetes-related interventions enacted by the hospital and the IDMS team. A timeline of hypoglycemia initiatives is presented in Figure 1. The details of the hospital-wide initiatives are presented in Table 1.
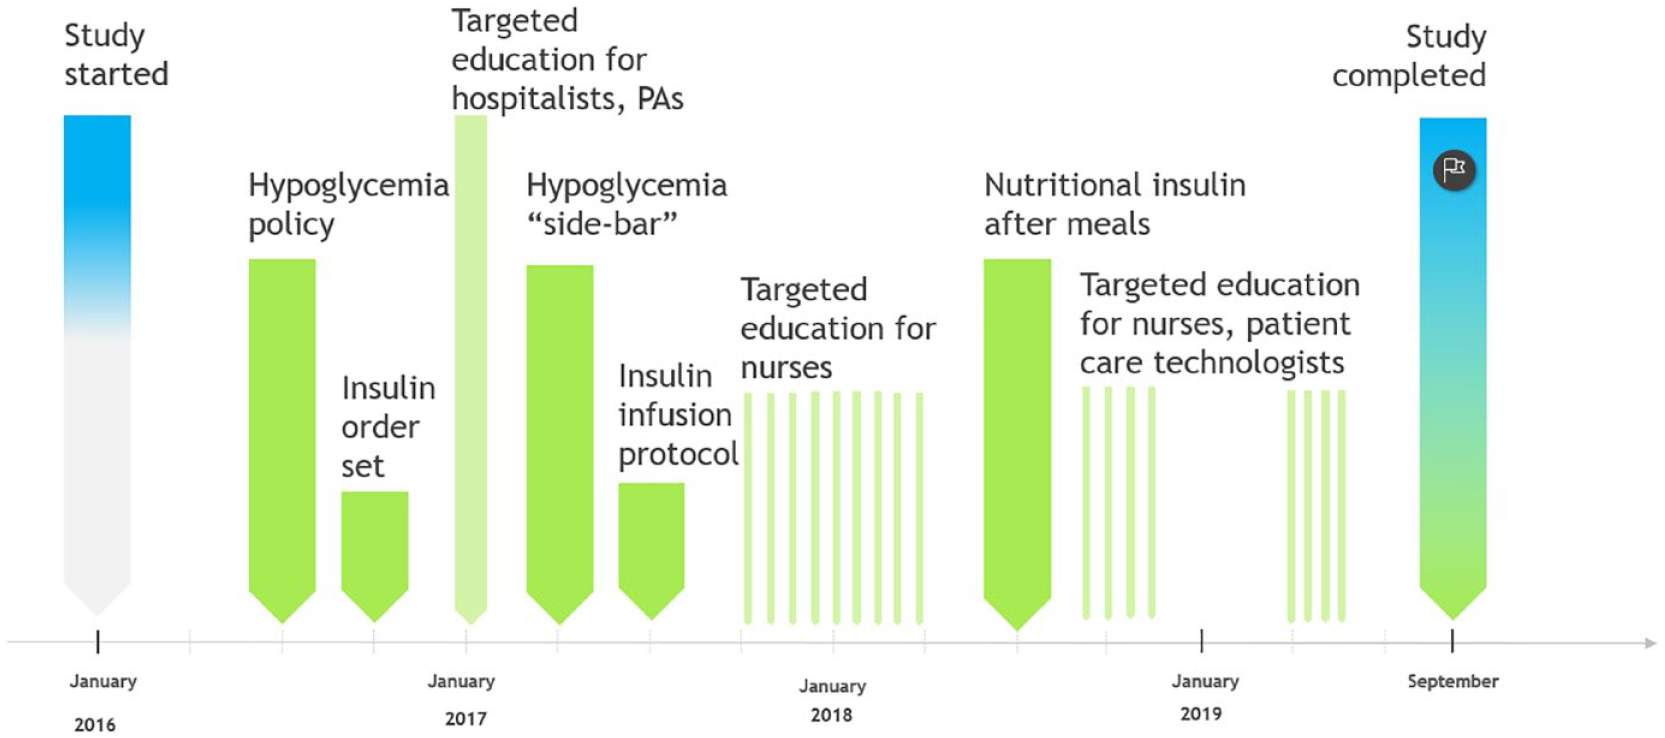
Timeline of hospital-wide hypoglycemia prevention initiatives. PAs, physician assistants.
Description of Hospital-Wide Hypoglycemia Prevention Initiatives.

Calculation of Potential Cost Savings
The potential cost of care savings has been calculated based on a recent study by Spector and colleagues. 12 Specifically, the following formula was used: Cost savings = (hypoglycemiabaseline – hypoglycemiamonth1) × average cost of hypoglycemiamonth1 + (hypoglycemiabaseline − hypoglycemiamonth2) × average cost of hypoglycemiamonth2 + . . .). A 2018 study found 300-bed community hospital with an average of 15 000 annual discharges can expect a cost of hypoglycemia to be over $1.5 million annually. Scaling this, the average monthly cost of hypoglycemia was assumed to be approximately $102 000 for a 240-bed hospital. 8
Statistical Analysis
This retrospective quality improvement cohort study analyzed the data subset from the John Hopkins Health System Armstrong Institute Glucometrics Dashboard. Insulin-induced hypoglycemia was defined as any blood glucose ≤70 mg/dL in a patient who received at least 1 unit of insulin in the previous 24 hours. Moderate hypoglycemia was defined as a blood glucose ≤54 mg/dL. The percentage rate was calculated by dividing patient days with a hypoglycemic measurement by patient days with at least one blood glucose measurement. A “patient day” was defined as a day in which a hospitalized patient received at least 1 unit of insulin. 18
Chi-square test was used to compare differences in frequencies, while linear regression analysis was used to analyze the change in rates over time. Data were transformed as appropriate to maintain assumptions of normality. All statistical analyses were performed using GraphPad Prism 8.4 (GraphPad Software, San Diego, CA).
Results
During the study period, there were 2682 patient days with any hypoglycemia (5.4%) and 874 days with moderate hypoglycemia (1.8%) out of 49 315 total patient days. Patients with type 2 diabetes constituted 84.4% (41 620 patient days) of the cohort, while patients with type 1 diabetes represented 4.4% (2185 patient days). The mean (±SD) number of any hypoglycemic and moderate hypoglycemic patient days per month was 59.6 ± 16.0 and 19.4 ± 7.6, respectively. The frequency of hypoglycemic patient days per month significantly decreased from 7.5% in January 2016 to 3.9% in September 2019 (P = .001; Figure 2). Moderate hypoglycemia rates were not significantly changed over the study period (2.0%-1.1%; P = .22).
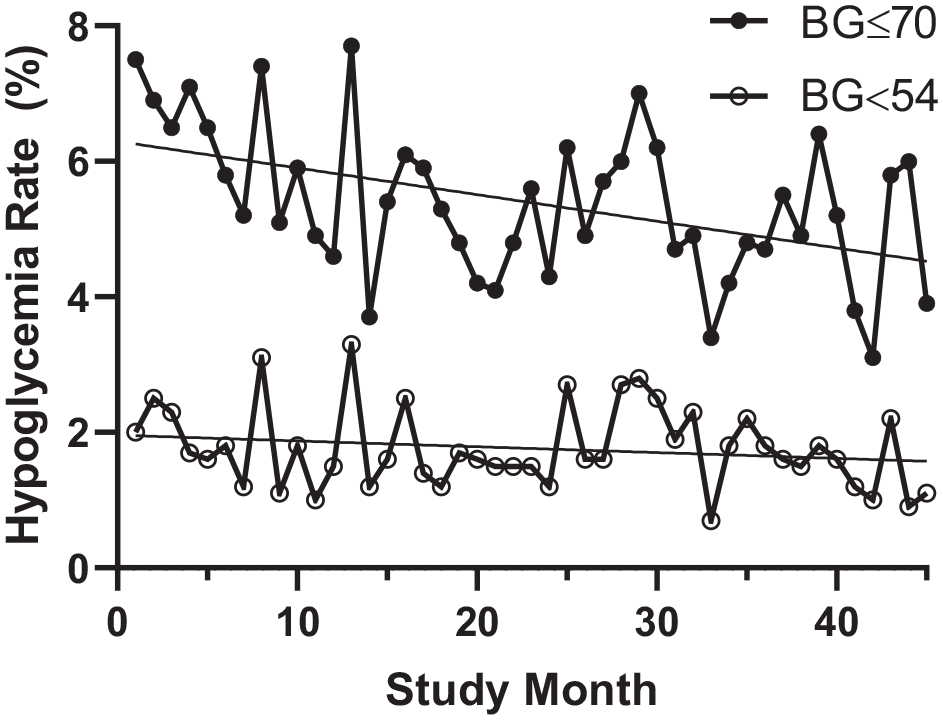
Hypoglycemia rates. Among all inpatients receiving insulin, rates of any hypoglycemia (glucose ≤70 mg/dL) decreased significantly with time (P = .001), while rates of moderate hypoglycemia (glucose <54 mg/dL) were not significantly changed (P = .22). BG, blood glucose.
When analyzing patients with type 1 and type 2 diabetes separately, those with type 2 diabetes demonstrated a significant decrease in the frequency of hypoglycemia (7.4%-3.8%; P < .0001), while among patients with type 1 diabetes the frequency trended downwards but did not reach statistical significance (18.5%-18.0%; P = .08; Figure 3(a)). Rates were unchanged among patients without a diagnosis of diabetes (P = .57).
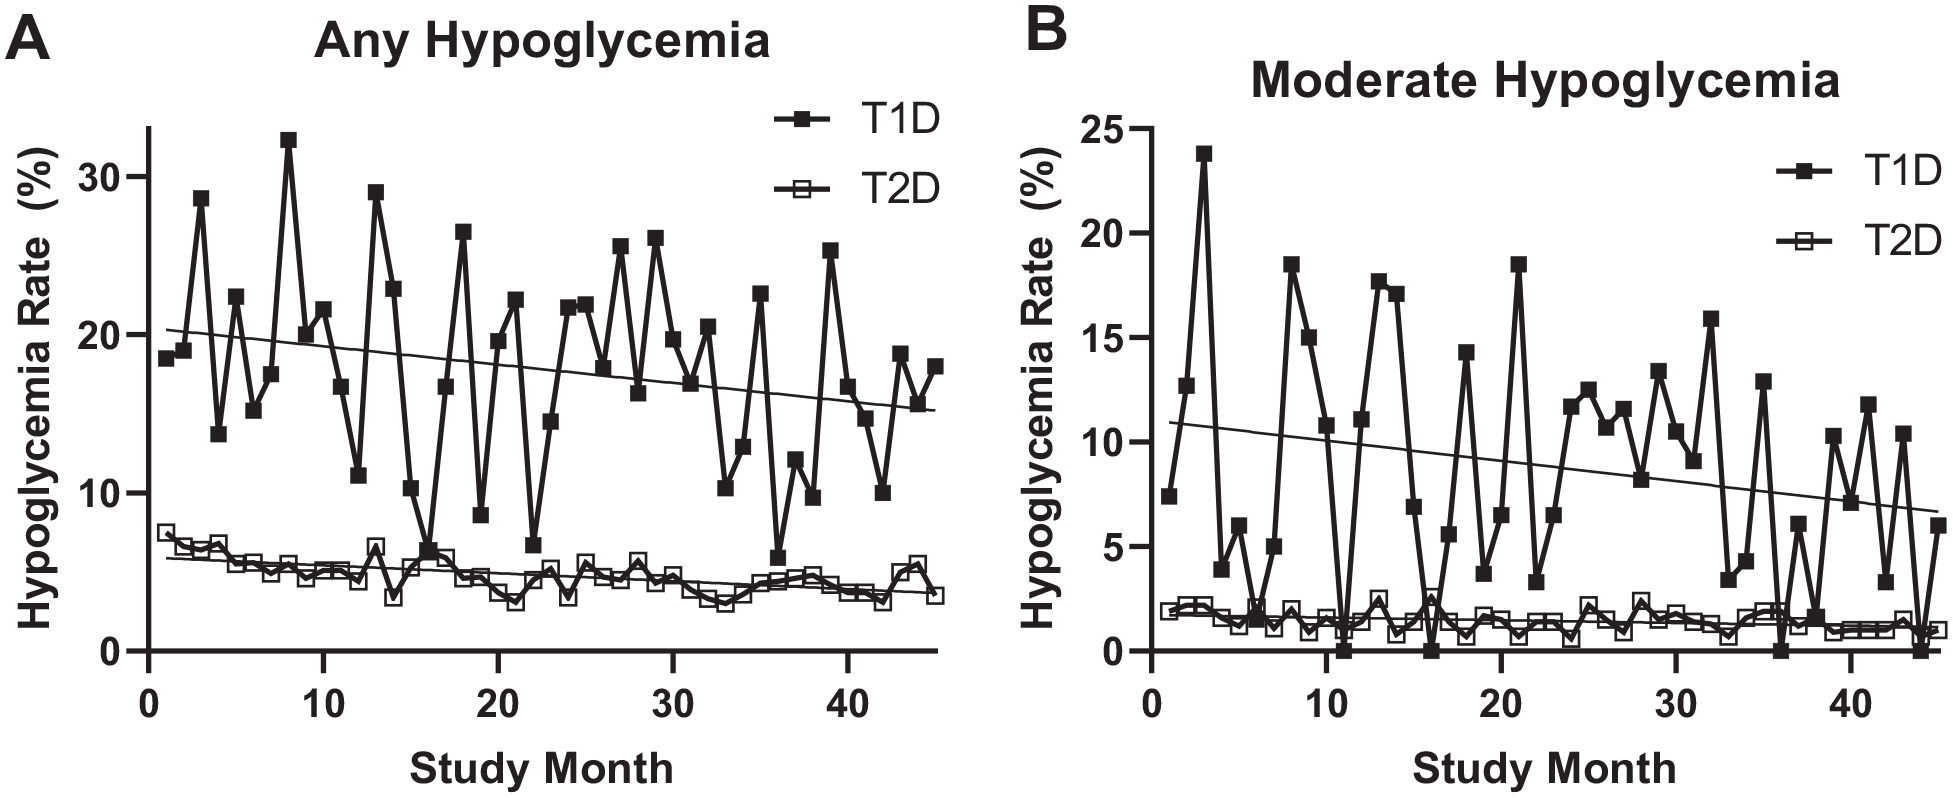
Hypoglycemia rates among patients with type 1 and type 2 diabetes. A. Hypoglycemia (glucose ≤70 mg/dL) rates over time significantly decreased for patients with type 2 diabetes (P < .0001), but did not reach statistical significance for those with type 1 diabetes (P = .08). B. Similarly, a reduction in rates of moderate hypoglycemia (glucose <54 mg/dL) was seen for patients with type 2 diabetes (P = .03), but decreases among those with type 1 diabetes did not reach significance (P = .14).
Similarly, among episodes of moderate hypoglycemia, patients with type 2 diabetes experienced a significant decrease in rates over time (1.9%-1.0%; P = .03), while those with type 1 diabetes did not see a significant change (7.4%-6.0%; P = .14%; Figure 3(b)). Patients not seen by IDMS saw a significant decline in moderate hypoglycemia (1.7%-0.9%; P = .02), whereas those seen by IDMS did not reach statistical significance (3.2%-1.5%; P = .12).
Both patients comanaged by IDMS and those not seen by IDMS experienced significant decreases in hypoglycemic rates (P = .002 and P < .001, respectively; Figure 4). Of note, the number of patients with diabetes per month seen by IDMS increased with time over the study period (P < .0001), while the number of patients with diabetes per month not seen IDMS decreased with time (P < .0001; Figure 5).
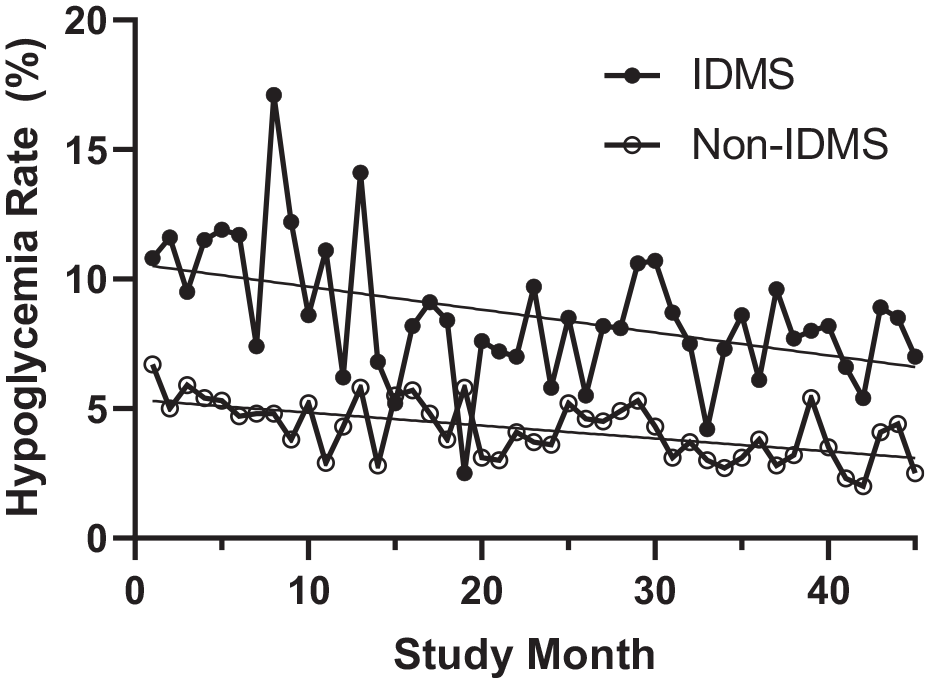
Hypoglycemia rates among patients comanaged by IDMS. Hypoglycemia rates for patients consulted by IDMS and those not seen by IDMS (non-IDMS) decreased significantly with time over the study period (P = .002 and P < .001, respectively).
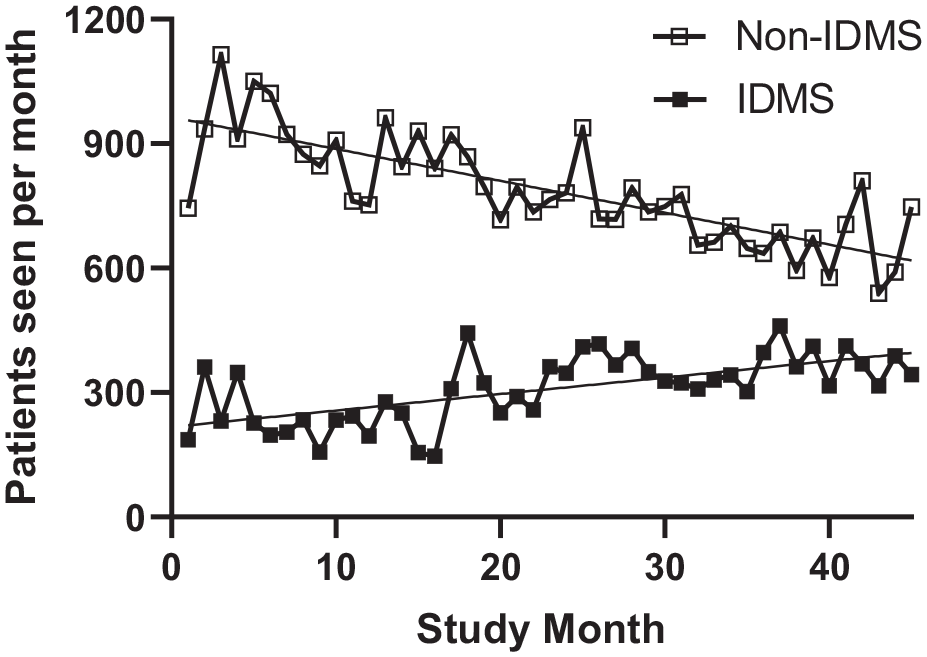
Volume of patients seen by IDMS. The volume of patients on insulin seen by IDMS significantly increased with time (P < .0001), while the number of patients on insulin not seen by IDMS (ie, managed solely by the primary team) significantly decreased with time (P < .0001).
Based on the reduction of hypoglycemia rates, the hospital had an estimated cost of care savings of $98 635 during the study period.
Discussion
In this retrospective quality improvement study in a community hospital setting, we found a reduction of hypoglycemia rates over time. While we are not able to attribute all of these results to just one reason, we speculate that the hospital-wide initiatives targeting hypoglycemia may have played an important role in these improvements.
Indeed, to improve hypoglycemia and glycemic control in the inpatient setting, typically one intervention is not sufficient; rather a multifaceted protocol or “bundle” needs to be undertaken. Griffing et al described a quality improvement project designed to improve patient safety by addressing actions that increase the risk of hypoglycemia by using a case-based approach. 19 Development, implementation, and education of a hypoglycemia protocol led to increased awareness of and significant reduction in hypoglycemic events. Others have also studied multipronged hypoglycemia reduction interventions, utilizing approaches such as education, clinical decision support tools, rapid hypoglycemia identification/notification, and standardized order sets, with significant reductions in hypoglycemia rates.20-23
Education was a major component of our hypoglycemia initiative. Educating patients in regard to diabetes self-management has been shown to reduce rates of hypoglycemia in the outpatient setting. 20 As inpatient nurses frequently are responsible for educating patients, educating nurses in topics related to insulin and diabetes may “trickle down” and improve their patient’s knowledge and glycemic outcomes as well. 21 In a similar vein, diabetes education of physicians, such as the use of basal-bolus insulin regimens instead of just correctional insulin, has also been related to improvements in inpatient glycemic outcomes.24,25 Although impossible to tease out from our other interventions, it is likely that the targeted education of nurses and hospitalists within our hospital also had a significant impact in reducing hypoglycemia rates.
Part of the education in our intervention was improving and/or updating insulin delivery strategies, to be consistent with best practices. Previous large studies have demonstrated that basal-bolus insulin in hospitalized patients results in reductions of hyperglycemia, with variable effects on hypoglycemia.11,26,27 Additionally the Normoglycemia in Intensive Care Evaluation–Survival Using Glucose Algorithm Regulation (NICE-SUGAR) trial demonstrated that among patients in the intensive care unit (ICU), significantly worse outcomes were seen with tight glycemic control (blood glucose 80-110 mg/dL) as compared to conventional glycemic targets (≤180 mg/dL). 28 Although not measured specifically, updating our practices to be in line with these studies likely contributed to the reduction of hypoglycemic rates, particularly among those in the ICU on insulin infusions.
Another action taken by the IDMS team at our institution was moving nutritional insulin to be given after meals, as opposed to preprandial administration. As patients in the hospital frequently have decreased appetites and oral intake due to their acute illness, we found that prior to our intervention, nurses were guessing whether to administer preprandial nutritional insulin or not with meals. 29 Sometimes patients would get their insulin but feel too ill to consume much from their meal tray, resulting in hypoglycemia. Other times the insulin would be held, only to have the patient eat their meal and have resultant hyperglycemia at the next meal. This would then necessitate a profound correctional insulin dose, perpetuating the inpatient glycemia rollercoaster. Postprandial delivery ensures that the nutritional insulin dose is only given in instances where patients have taken in adequate nutrition, thereby reducing hypoglycemia risk. 27
Our results showed that any and moderate hypoglycemia significantly decreased for patients with type 2 diabetes and trended towards but did not reach significance for patients with type 1 diabetes. This is likely due to the small number of patients with type 1 diabetes, resulting in greater month-to-month variability. Both patients seen by IDMS and not seen by IDMS experienced significant decreases in rates of hypoglycemia over the course of the study, although overall patients in the IDMS group had a higher rate of hypoglycemia than those not seen by IDMS. This is likely explained by the fact that the IDMS team cared for the more complicated patients with diabetes, including the vast majority of patients with type 1 diabetes. 5 Moreover, despite seeing an increasing number of patients per month over the study period, the IDMS demonstrated significant reductions in hypoglycemia rates over time.
Financial Impact
As previously discussed, inpatient hypoglycemia can significantly burden hospitals and the US healthcare system at large. 21 A 2018 study found the average marginal cost for an inpatient stay with a hypoglycemic adverse drug event (ADE) was $4312. 3 Scaling this, a 300-bed community hospital with an average of 15 000 annual discharges can expect to experience 357 hypoglycemic ADE per year–a cost of over $1.5 million annually to the hospital. 30 Hypoglycemic-related ADEs seem financially insignificant on a case-by-case basis, but when viewed over a collective annual impact, they are quick to seize administration’s attention.
Importantly, numerous studies have shown the factors driving costs for hospitalized patients with diabetes, including increased length-of-stay and higher readmission rates.8,21-23 IDMS have exhibited significant cost savings as interventional tools for hospitals to better manage the price tag associated with hypoglycemic ADEs. One study estimated that a specialized Diabetes Consultative Service reduced the length of stay through improved glycemic control, thereby reducing cost by an estimated $121 000 over the 3-month study period for the 34 diabetes team patients. 31 Additionally, comprehensive diabetes management programs have shown a return on investment of 467%, a figure largely derived through increased patient throughput as a result of reduced length of stay and readmissions. 30
Implementation Feasibility
Implementation of hospital-wide initiatives to better manage hypoglycemia has been slow to be adopted by organizations over the years. This has been the result of a variety of factors, but three elements have deterred successful integration of such a protocol: insufficient provider expertise in complex dosing, manual methods, and limited resources for endocrine consultation. 32 First, glucose control requires an in-depth understanding, particularly as patients’ clinical conditions are changing or when patients are transferred between levels of care (eg, from ICU to general medical units or from hospital to home).12-14 Some general (non-endocrine) medical providers may not have the requisite level of expertise to accurately adjust insulin doses in these situations. 33 Second, insulin dose adjustments performed in a system using paper charts are plagued by inefficiencies leading to error-prone results. Without an electronic record system, which facilitates integration and communication, as dosing is adjusted and patients transitioned, mistakes can mount. 32 Third, some hospitals may be insufficiently staffed with endocrinologists, leaving hospitalists without adequate assistance/consultation for higher risk cases, despite caring for a large population of inpatients with diabetes.22,32
Given these difficulties, the American Diabetes Association continues to promote inpatient diabetes management programs and advocate for increased endocrinologist staffing. Provider ability to accurately present the case to hospital administrators regarding the return on investment in both improved patient outcomes and financial savings is vital to increase adoption of such programs. In proposing a strong business case to the administration, Sidhaye et al recommend the following steps to effectively attract buy-in from leadership: (1) obtain data on key metrics, (2) identify high-risk units not meeting metrics, (3) define case volumes in these units to determine which units may benefit most from IDMS, (4) develop goals statement and metrics for success, (5) quantify the financial impact of not meeting defined targets, and (6) outline IDMS components and estimate provider full-time equivalent for IDMS. 14 Effective presentation to hospital leadership of the current inefficiencies within the system and proposing a robust IDMS or similar integrated inpatient diabetes management protocol will drive the feasibility of implementation.
Limitations
Our study contains multiple limitations the audience should be aware of. First, this quality improvement study is retrospective. Second, the dashboard dataset has limited information about patient demographic data, clinical status, hemoglobin A1c, or severity of illness score. Third, as many of our interventions occurred either simultaneously or sequentially, it is impossible to assess which particular intervention had the greatest impact and which had minimal effect. Fourth, no severity of illness score was available, and we were not able to adjust hypoglycemia rates for underlying comorbidities. Lastly, there is no “perfect” financial model for the calculation of cost of hypoglycemia.
Conclusions
In a community hospital setting, implementation of hospital-wide initiatives targeting hypoglycemia resulted in a significant and sustainable decrease in the rate of insulin-induced hypoglycemia, thereby significantly improving the safety of inpatients receiving insulin. These high-leverage risk reduction strategies may be translated into considerable cost savings and could be implemented at other community hospitals.
Footnotes
Declaration of Conflicting Interests
The author(s) declared the following potential conflicts of interest with respect to the research, authorship, and/or publication of this article: M.Z. is a consultant for Guidepoint and G.L.G.
Funding
The author(s) received no financial support for the research, authorship, and/or publication of this article.