
Abstract
Background:
Fall-risk assessments for patients with diabetes fail to consider reactive responses to balance loss. The purpose of this study was to assess the feasibility of using a simple clinical tool to evaluate the impact of diabetes and fall history on reactive balance in older adults.
Methods:
We recruited 72 older adults with and without diabetes. Postural perturbations were applied by a waist-mounted spring scale. Stepping thresholds (STs) in the anterior and posterior directions were defined as the lowest spring-loads that induced a step. Balance was assessed via the National Institutes of Health Toolbox Standing Balance Test, and lower extremity sensation was assessed using vibratory perception threshold and Semmes-Weinstein monofilaments. Fall history over the past year was self-reported. Cox regressions and analysis of variance were used to compare hazard rates for stepping and observed STs between groups.
Results:
Anterior STs were elicited in 42 subjects and posterior STs in 65 subjects. Hazard rates for posterior ST were significantly affected by diabetes, with greater hazards for fallers with diabetes versus control fallers and nonfallers, after accounting for balance and sensory loss. For those who stepped, ST was lower in the posterior direction for the diabetes group. Additionally, anterior but not posterior ST was lower in all fallers vs all nonfallers.
Conclusions:
The waist-mounted spring scale is a clinically implementable device that can assess ST in older adults with diabetes. Using the device, we demonstrated that ST was affected by diabetes and could potentially serve as a fall-risk factor independent of balance or sensory loss.
Introduction
More than one in four older adults fall annually, 1 and diabetes increases the risk of falling by 20%-60%.2-4 Falls can significantly impact the health and well-being of older adults with diabetes. In 2017 alone, nearly 900 000 older adults were hospitalized due to serious fall-related injuries, 5 and diabetes is associated with a higher rate of injurious falls requiring hospitalization. 6 Although a considerable number of fall-risk assessment tools exist, the course of treatment following a positive test is not always clear. There is a need to develop novel fall-risk assessment tools for patients with diabetes that can provide information unique from existing measures while simultaneously informing targeted interventions.
Ultimately, falls are generally caused by an inability to react to a postural perturbation in a manner that restores stability. Reactive responses most often involve taking a protective step to establish a new relationship between the center of mass and the base of support. 7 One variable to quantify protective stepping ability is the stepping threshold (ST), that is, the minimum perturbation force required to elicit a protective step. Older adults with a recent fall have lower ST. 8 Moreover, in a prospective study of 242 older adults (sampled from a cohort in which ~13% had diabetes), 9 posterior ST predicted future falls. 10 While age-related sensorimotor and neuromuscular impairments may impact ST, 7 there is reason to believe that diabetes and its complications may impact ST to an even greater extent.
High STs are requisite on the ability to first sense a balance loss and then enact a motor response with adequate speed and magnitude, both of which may be impacted by diabetes and its complications. Regarding the former, there is strong evidence to support the presence of postural instability (balance impairment) in people with diabetic peripheral neuropathy (DPN). 11 Even in the absence of DPN, people with diabetes must contend with subtle sensorimotor and cognitive changes that promote balance impairments and falls.12,13 With regard to reactive responses, a number of studies have shown that removing cutaneous sensory information, a feature of DPN, negatively impacts the response. For example, hypothermically reduced plantar sensations in young adults increased the frequency of anterior steps following perturbations in which participants were instructed not to step. 14 Foot cooling,15,16 as well as anesthetization of the feet17,18 and more directly the presence of DPN, 19 has also been shown to impact the magnitude and timing of ankle and hip muscle activity in response to perturbations, presumably due to impaired sensory feedback. Even after accounting for DPN, diabetes alone may affect the ability to sense a perturbation, 20 and patients with diabetes (without DPN) have declines in reactive balance compared with healthy peers. 21
Although a number of studies have evaluated reactive balance responses in patients with diabetes,19-24 most were interested in the effects of DPN, and none specifically evaluated ST. In addition, none considered whether balance responses distinguished patients with diabetes with and without a history of falls, a strong predictor of future falls. 25 Lastly, the methods used to provide perturbations in these studies, for example, large moveable platforms, are not clinically implementable. The purpose of this study was to use a simple clinical tool to (1) evaluate the impact of diabetes and fall history on ST in older adults and (2) evaluate the extent to which ST is independent of balance or sensory deficits. Evaluating the utility of ST as a measure of fall risk in persons with diabetes is appealing given that deficits, and the associated risk of future falls, can be directly addressed by reactive balance step training. 26
Methods
Participants
We recruited 40 older adults (≥65years) with a self-reported history of diabetes and 36 older adults without diabetes over a 14-month period from an outpatient clinic setting, at a local diabetes exposition, and through community-posted flyers (Table 1). All participants signed an Institutional Review Board approved consent form prior to participating. Exclusion criteria included the use of assistive devices for gait, nondiabetes-related neurological conditions that interfere with gait (eg, Parkinson’s disease), history of amputation, and open foot ulcers.
Demographics.
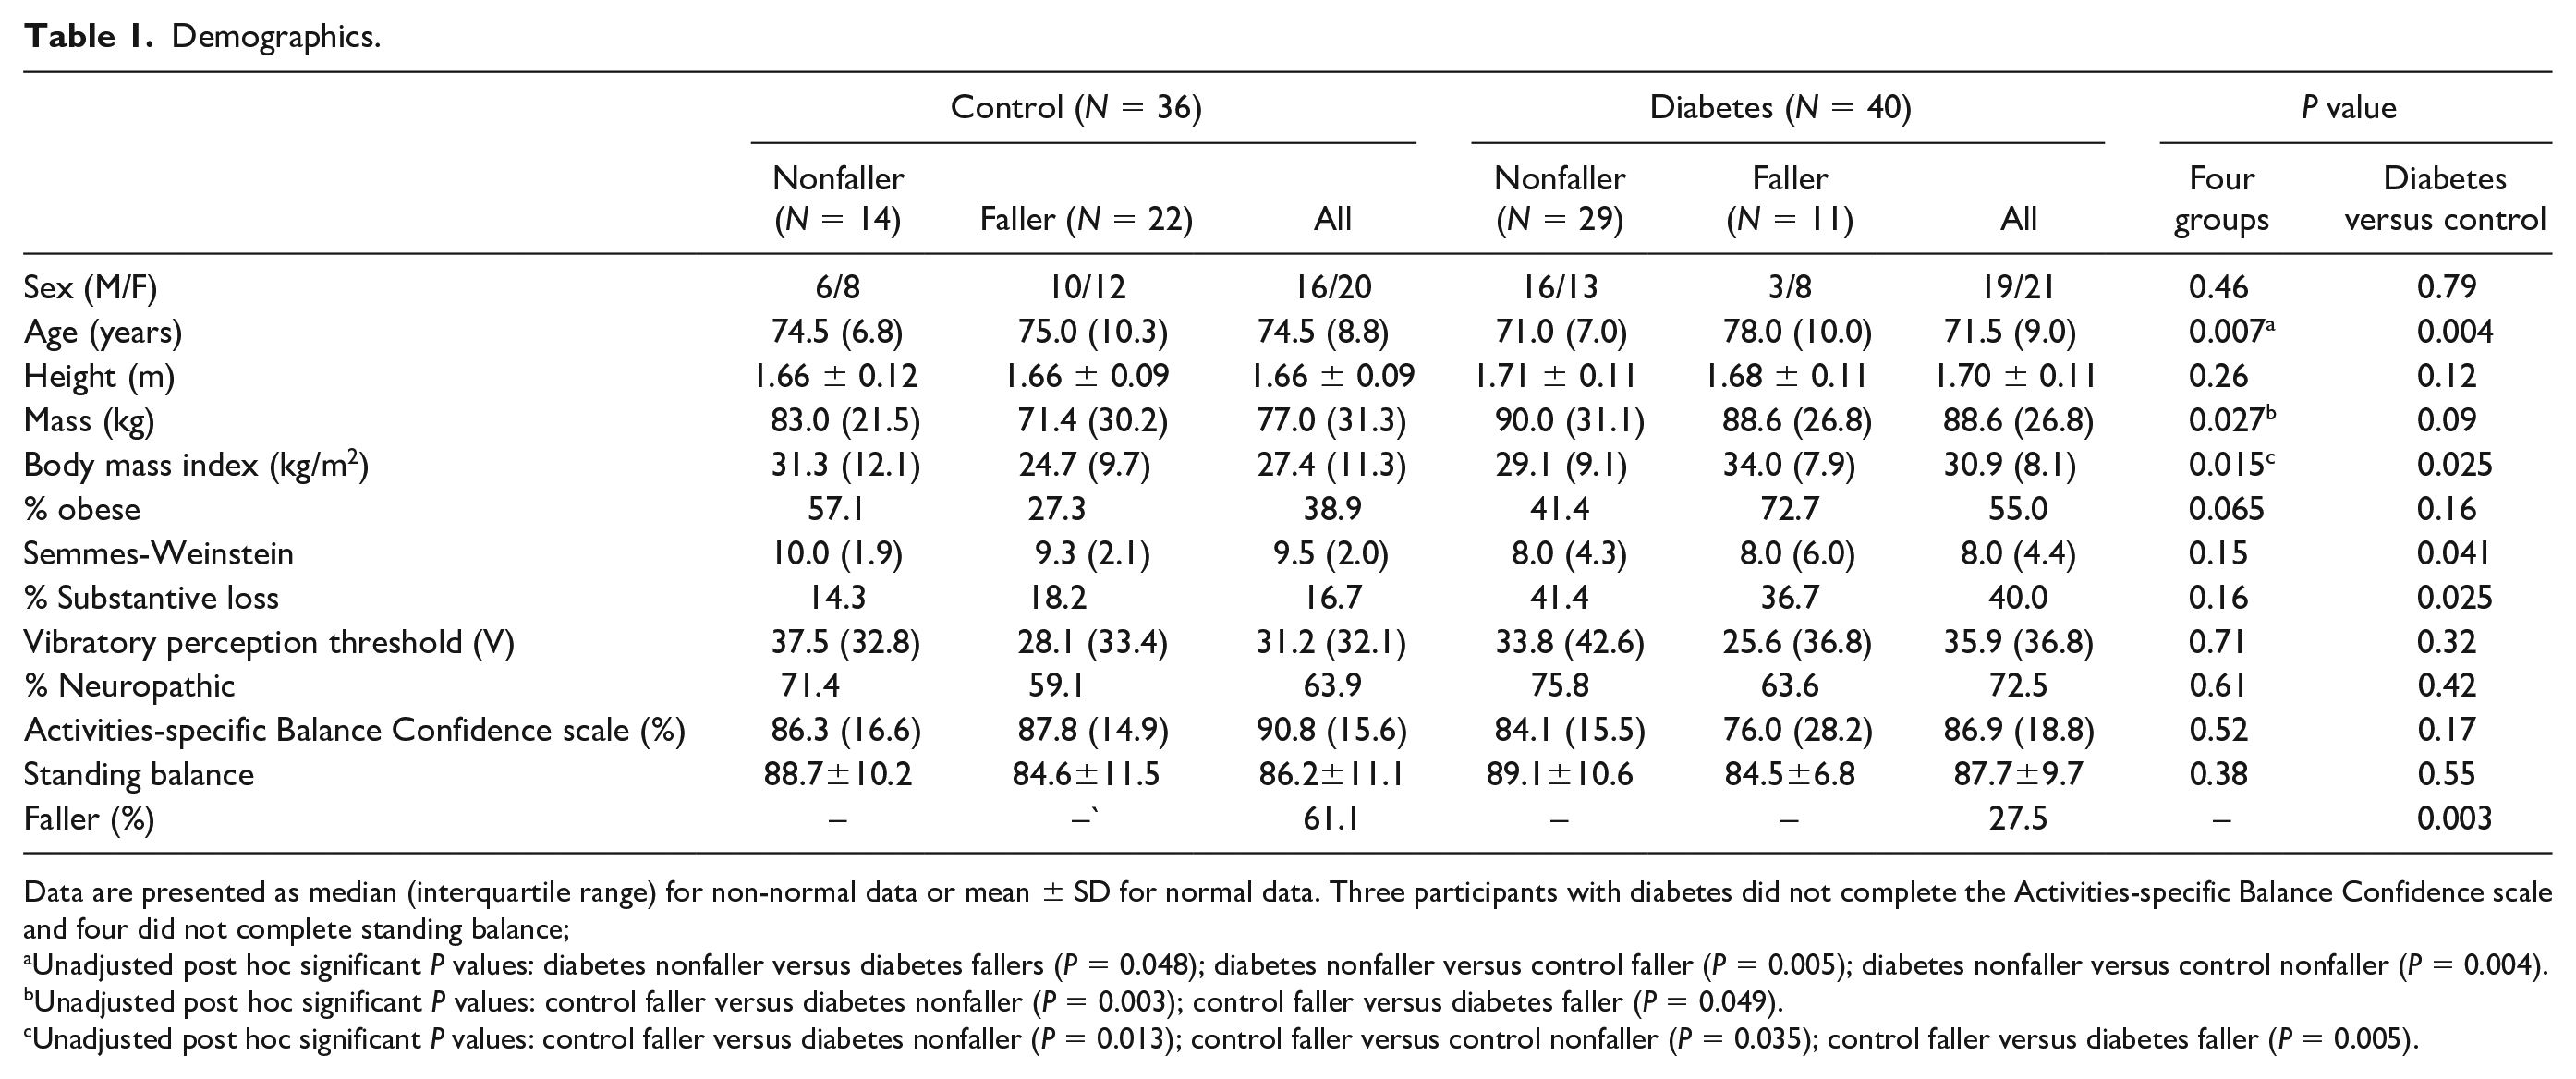
Data are presented as median (interquartile range) for non-normal data or mean ± SD for normal data. Three participants with diabetes did not complete the Activities-specific Balance Confidence scale and four did not complete standing balance;
Unadjusted post hoc significant P values: diabetes nonfaller versus diabetes fallers (P = 0.048); diabetes nonfaller versus control faller (P = 0.005); diabetes nonfaller versus control nonfaller (P = 0.004).
Unadjusted post hoc significant P values: control faller versus diabetes nonfaller (P = 0.003); control faller versus diabetes faller (P = 0.049).
Unadjusted post hoc significant P values: control faller versus diabetes nonfaller (P = 0.013); control faller versus control nonfaller (P = 0.035); control faller versus diabetes faller (P = 0.005).
Protocol
Participants stood barefoot while a waist-mounted spring scale was slowly pulled to a 4.45 N load (1 pound force). The load was held for several seconds, and participants were instructed to try to keep their feet flat on the ground. The load was released at a random interval, and participants were instructed to step only if necessary. The load was then increased in 4.45 N increments (maximum of 115.7 N), and ST was defined as the lowest load at which a step was initiated, expressed as a percent of body weight (BW), consistent with prior studies.27,46-51
Initial load progression followed the Repeated Incremental Predictable Perturbations in Standing (RIPPS) method. 27 However, this protocol was not designed to quantify ST. In this method, loading ceases once failure is reached (ie, the toes/heels cannot maintain ground contact prior to load release or more than three steps are taken following load release); many participants experienced failure before initiating a step (Figure 1). Accordingly, we modified the RIPPS method approximately midway through the study. In the modified version, we attempted to apply loads until a step was initiated upon load release, regardless of whether the heels/toes were grounded prior to release. However, STs were still not elicited in all subjects. Several participants could not avoid stepping in the direction of the load prior to load release and many subjects avoided stepping even at the maximum load (Figure 1).
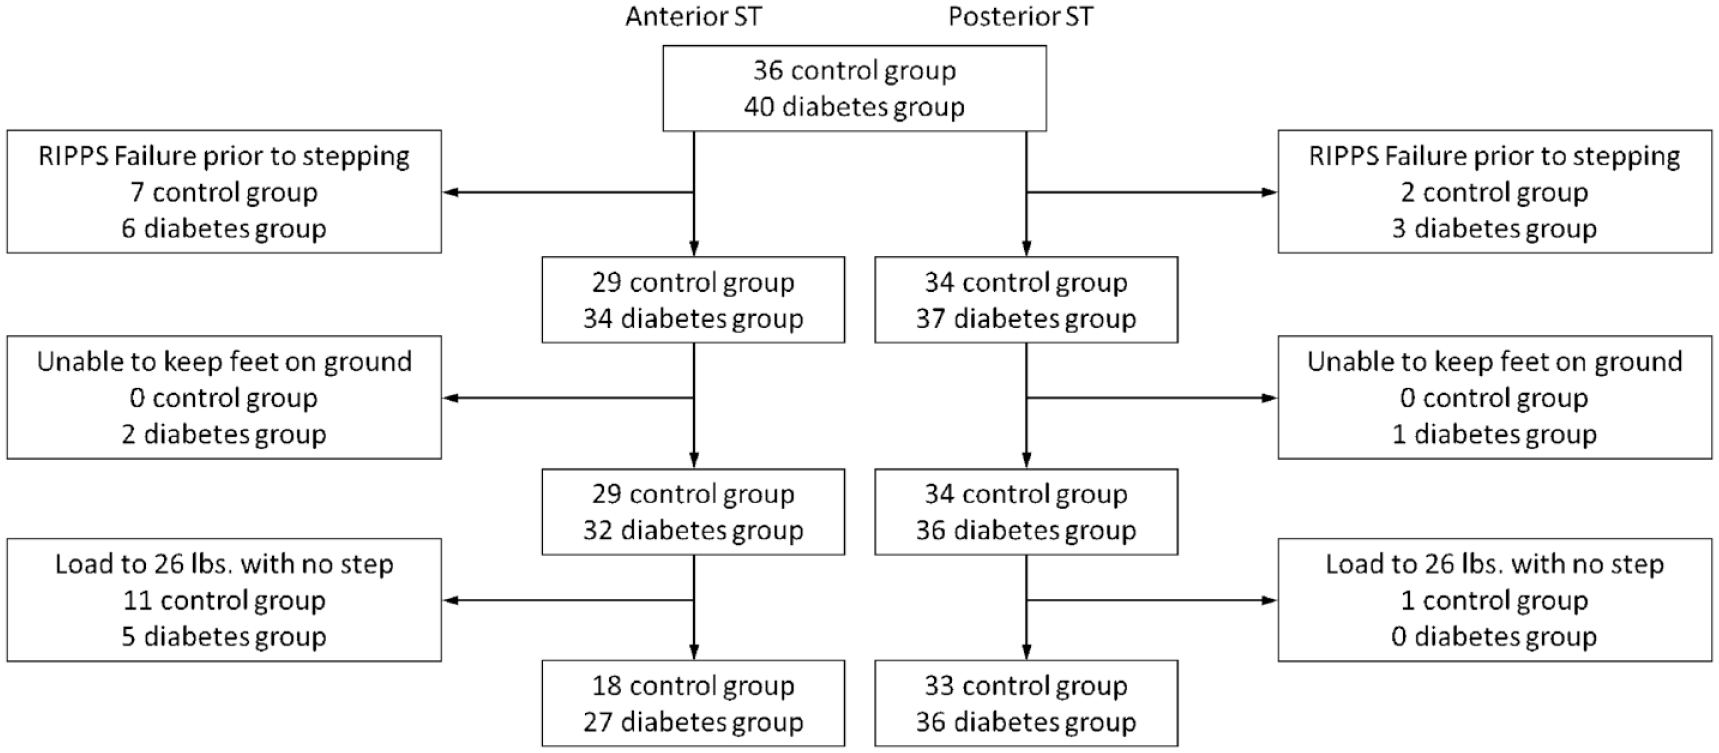
Subject flow diagram.
The ST test was performed first with the examiner pulling in an anterior direction to determine posterior ST - following the release of an anterior-directed pull, participants must rapidly counter any proactive, posterior-directed corrections resisting the pull, which if unsuccessful results in a posterior-directed step. Posterior-directed pulling trials were then used to determine anterior ST. Following the ST protocol, participants were asked if they fell in the past year; “yes” responders were coded as “fallers,” and “no” as “nonfallers.” To quantify balance, we used the National Institutes of Health (NIH) Standing Balance Test which is part of the NIH Toolbox. 28 For the test, participants hold a series of five poses for up to 50seconds each while body sway is recorded using a waist-mounted iPod (Apple Inc., Cupertino, CA, USA) that communicates wirelessly with an iPad (Apple Inc.) application. The NIH Toolbox provides a score by comparing sway to that of a national sample in which average behavior corresponds to a score of 100. Participants also completed the Activities-specific Balance Confidence scale 29 which asks participants to rate how confident they are in their ability to complete a series of tasks without losing balance.
Finally, participants’ light touch sensation was evaluated using a 5.07/10 g Semmes-Weinstein (SW) monofilament to apply force to 10 different positions on the foot with four or more misses on one foot indicating substantial loss of protective sensation. 30 In addition, the vibratory sensation was quantified using a biothesiometer (Xilas Medical Inc, San Antonio, TX, USA). The vibratory perception threshold (VPT) was defined as the minimum vibration setting (1-100 V) participants could perceive at their hallux. A value of >25V on either foot indicated the presence of neuropathy. 31 A value of 100 V was entered if the participant was unable to sense the maximum vibratory level applied by the biothesiometer. The average VPT and SW across each subject’s left and right feet were entered into statistical analyses.
Analysis plan
Shapiro-Wilk’s tests were used to assess the normality of all continuous demographics variables (Table 1). Mann-Whitney U-tests, one-way ANOVAs, or t-tests were then used to compare demographics between groups. A Chi-squared test was used for between-group comparisons of proportions.
As ST was not captured in all participants, we used a series of Cox-regression models to explore the concurrent effects of diabetes and faller status as well as sensation and balance on the hazard of stepping. The first model (Model 1) included group (four levels—control nonfallers, control fallers, fallers with diabetes, and nonfallers with diabetes) and age as dependent variables and was run separately for each loading direction. If, for a given direction, group was significant in Model 1, then we planned to run three independent regressions (Model 2) with the following dependent variables: neuropathy (Yes/No based on VPT), substantial loss of protective sensation (Yes/No based on SW), or standing balance score. Model 3, which was also to be run only if Model 1 was significant, was to be a stepwise regression with dependent variables being: group, as well as any significant variables from the second set of models (and age, if significant in Model 1).
To better understand if ST was affected by diabetes and/or faller status, additional analyses were performed on only those subjects who initiated a step. Specifically, a 2 (control vs diabetes) × 2 (faller vs nonfaller) analysis of covariance, with age as a covariate, was conducted for each pull direction. F values were transformed into Cohen’s d to provide effect sizes.
All statistical analyses were performed in IBM SPSS Statistics 25 (IBM, Armonk, NY) with significance set at P ≤ 0.05.
Results
Only age, body mass, and body mass index (BMI) differed between groups (Table 1). Although BMI was significantly greater in the diabetes group, it was not used as a covariate as STs are already expressed as % BW. Importantly, the ability to observe an ST appears independent of obesity. After excluding RIPPS failures, 97.3% of normal weight and 96.5% of obese subjects initiated posterior steps; 62.5% of normal weight and 80.6% of obese subjects initiated an anterior step.
Initial Cox regressions for the entire cohort (Model 1) demonstrated a significant effect of group on the hazards of both posterior and anterior steps. For both directions, the hazard rate for fallers with diabetes was significantly greater than for control nonfallers or for control fallers (Table 2). In the diabetes group, there was a nonsignificant trend toward higher hazard rates in fallers compared with nonfallers (P < 0.10). For posterior steps, substantial loss of protective sensation and standing balance were significant in Model 2 and entered into Model 3; for anterior steps, only the latter was entered. In the full model (Model 3), standing balance and group, but not loss of protective sensation, remained significant factors to explain hazard rates for posterior stepping (Figure 2), with group differences identical to Model 1. For anterior ST, after accounting for protective sensation, the group provided no additional information regarding the hazards of stepping.
Results from Three Models Used in Cox Regressions.
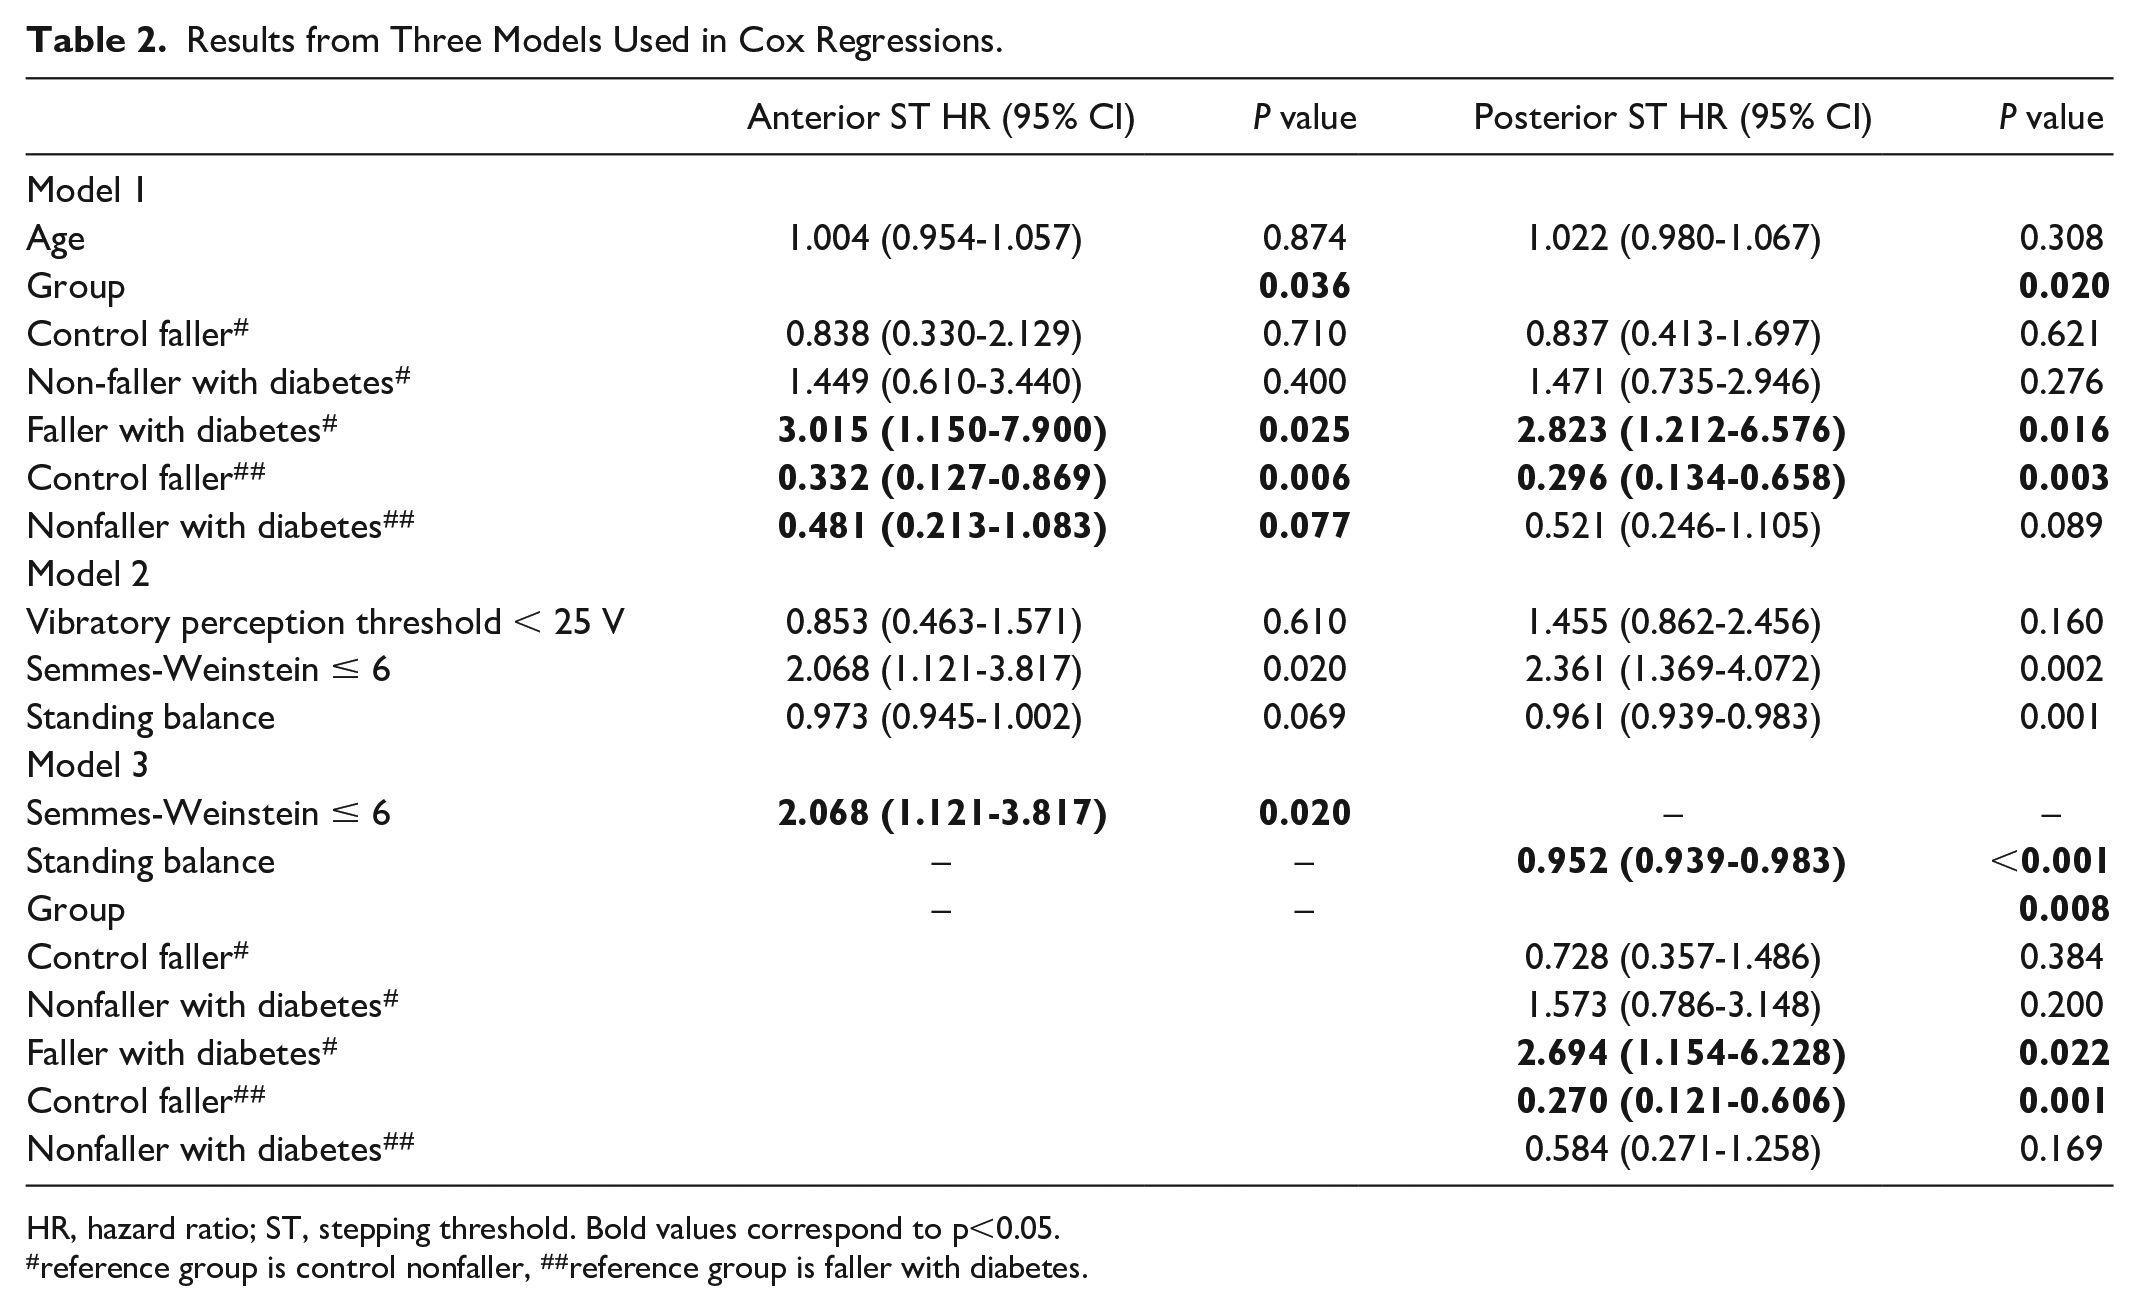
HR, hazard ratio; ST, stepping threshold. Bold values correspond to p<0.05.
reference group is control nonfaller, ##reference group is faller with diabetes.
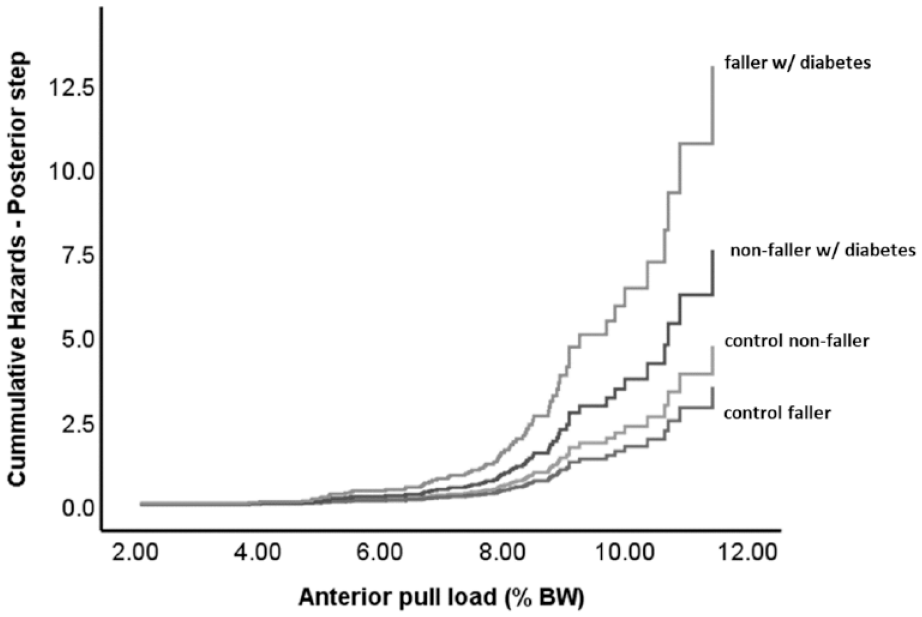
Cumulative hazard curves for the four-group survival analysis for posterior steps, obtained from Model 3. For anterior steps, the grouping variables provided no additional information beyond that of the Semmes-Weinstein with regard to hazard rates and are therefore not presented.
When considering only those who stepped, ST in both directions was ~14% lower in participants with diabetes. The age-corrected values (mean ± SE) for ST in the posterior direction for the control versus diabetes group was 8.15 ± 0.35 % BW versus 7.05 ± 0.35 % BW (P = 0.032, F(1,68) = 4.829, Cohen’s d = 0.54); the age-corrected values for ST in the anterior direction for the two groups were 9.04 ± 0.38 % BW versus 8.10 ± 0.32 % BW (P = 0.067; F(1,44) = 3.54, Cohen’s d = 0.59; Figure 3).
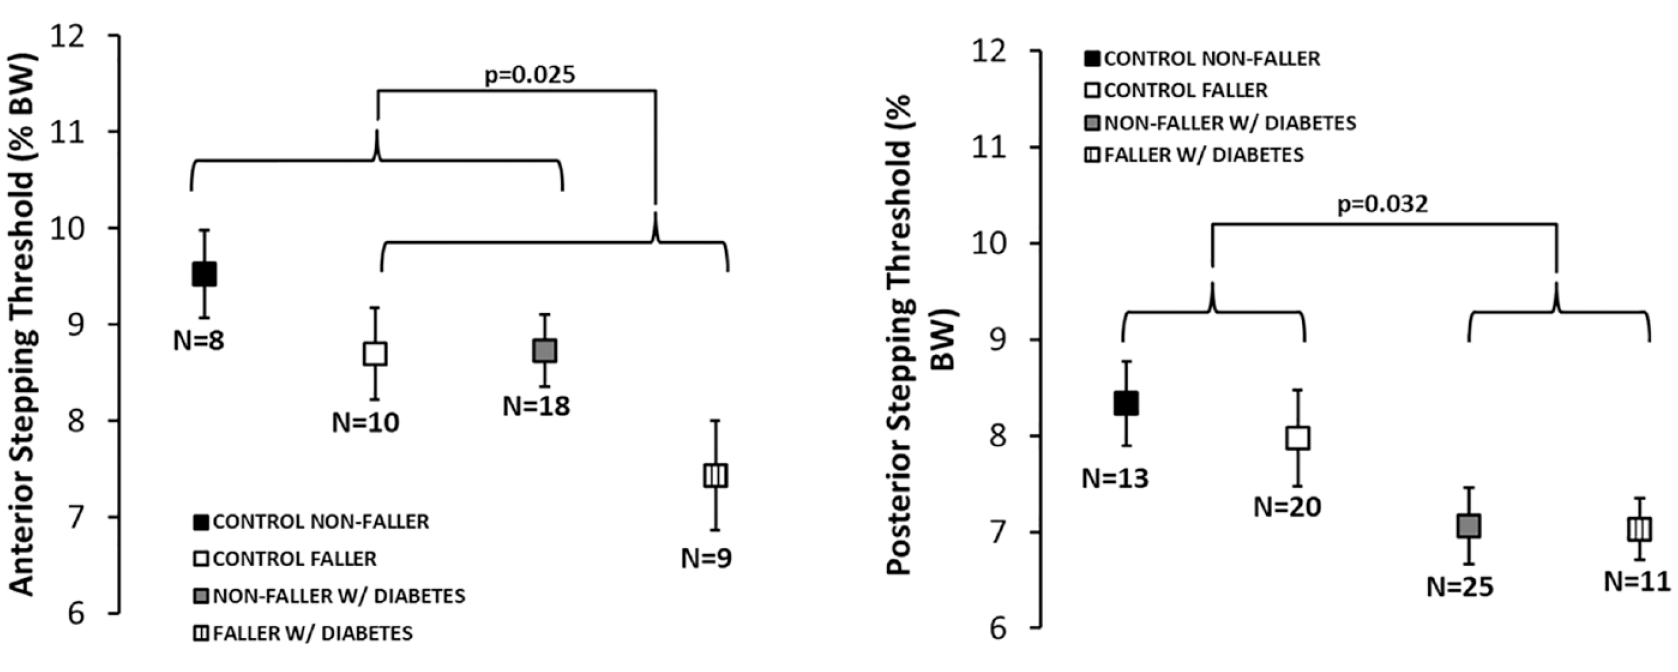
Stepping threshold (ST) values for those who initiated a reactive step in each pull direction: (right) posterior ST obtained during anterior waist pulls and (left) anterior ST obtained during posterior pulls. Data represent means and SEs for the number of participants (N) for whom ST data in a particular direction was available.
Fallers exhibited a significantly lower anterior but not posterior ST. The age-corrected values for ST in the anterior direction for fallers versus nonfallers was 7.98 ± 0.37 % BW versus 9.16 ± 0.33 % BW (P = 0.025, F(1,44) = 5.39, Cohen’s d = 0.71). The age-corrected values for ST in the posterior direction was 7.50 ± 0.33 % BW for fallers versus 7.70 ± 0.33% BW for nonfallers (P = 0.69, F(1,68) = 0.17, Cohen’s d = 0.10). The interaction between diabetes status and falls history was nonsignificant for either direction (anterior: P = 0.56; posterior: P = 0.75).
Discussion
We were interested in evaluating the impact of diabetes and fall history on ST in older adults, and the extent to which ST assessed with a waist-mounted spring scale was independent of balance and protective sensation, in order to preliminarily assess whether ST assessed with this clinical tool could provide unique information regarding fall risk in patients with diabetes. We found that hazard rates for posterior steps were not significantly different between fallers and nonfallers with diabetes, but were different between the former and both control groups. In addition, in the subset of individuals who took reactive steps, posterior STs were significantly lower in those with diabetes, regardless of fall history, and anterior STs were significantly lower in fallers, independent of diabetes. We posit that diabetes in older adults impacts ST but that additional work may be needed to fully understand the extent to which this effect provides fall-risk information in this group.
While hazard rates were not significantly higher in fallers with diabetes compared with nonfallers with diabetes, our method still has promise regarding fall risk assessment in patients with diabetes. The low number of falls reported in the diabetes group may have limited our ability to observe an effect in this group. Surprisingly, less than 30% of the diabetes group reported falls, compared with 61% of the control group, which could reflect recall bias or the fact that falls were not explicitly defined for participants. The fact that STs did not differ between fallers and nonfallers with diabetes may also reflect the high level of balance confidence in our cohort. Our diabetes group may not fear challenging activities that are particularly destabilizing for them, for example, stair ambulation, 32 which may increase participation in, and falls during, such activities. However, stepping responses evaluated while standing on the level, even ground may not well explain falls during such activities. Nonetheless, hazard rates were significantly worse for fallers with diabetes compared with both control groups. Moreover, the combined results from the regression and ANOVA (Figure 3) clearly point to the effect of diabetes on posterior ST, even after accounting for sensation and balance. The idea that diabetes alone can impact ST is consistent with multiple studies demonstrating that diabetes alone impacts sensorimotor control12,33 and predicts falls independent of balance. 34
Preventing a step following a release of a pulling force requires the rapid generation of large torques, primarily in the ankle, 35 which may be impacted by diabetes. Indeed, a series of animal studies reviewed in Sin et al 36 suggest that diabetes specifically promotes atrophy in muscle fibers that most contribute to rapid torque production (type IIb). In addition, ankle strength is lower in patients with diabetes and even lower in individuals with diabetes with a history of falling. 37 However, changes in ankle neuromechanics may not necessarily explain impaired ST. 38 The ability to react following release from a pull relies on both ankle and hip muscles, 35 and individuals with diabetes, regardless of DPN, display greater reliance on hip versus ankle strategies to perform balance 39 and other postural tasks. 40 This is somewhat surprising given that persons with diabetes tend to have reduced hip strength. 41 In addition, somatosensory loss, as in DPN, leads to an increased reliance on the hip strategy during postural corrections following a perturbation. 17 Thus, the effects of diabetes on ST may, in part, reflect changes in hip musculature that impact reactive balance independent of static balance. Such changes also likely include some aspect of altered sensation, independent of vibratory or tactile sense. For example, in patients with DPN, a ratio of hip strength to ankle proprioception predicts falls and injury. 42
The idea that a combination of muscular strength and proprioception may explain lower ST and in turn falls in patients with diabetes is not trivial in terms of fall-risk prevention. Prior studies have shown that simply strengthening muscles used in the stepping response may not improve the response. 43 Rather, to improve the skills involved in successful stepping responses, one should specifically practice protective stepping following unexpected external perturbations. 44 Importantly, even persons with DPN are capable of adapting motor responses following repeated exposure to postural perturbations. 22 In this manner, using a simple clinical device to identify fall risk based on ST may provide direct insight into the necessary form of training to prevent a fall.
The current study suggests that the relationship between ST and fall status, independent of diabetes, depends on pulling direction, which may be clinically relevant. STs differed between fallers and nonfallers in the anterior but not posterior direction. This is somewhat surprising given the finding of Sturnieck that posterior ST is a better predictor of future falls. 10 However, in that study, a minority of participants likely had diabetes, and they defined ST as the lowest disturbance that elicited a step rather than the largest disturbance that could be attenuated without stepping. Thus, the instruction set may be important to consider when assessing ST. With regard to anterior ST, it appears that stepping at low loads may provide information about fall risk (Figure 3), whereas not stepping at high loads provides limited information; nearly identical number of fallers and nonfallers were able to resist anterior steps up to the 115.7 N limit. These observations point to a potential trade-off between sensitivity and specificity of anterior ST. However, given that 13 persons were lacking anterior ST as a result of our initial protocol, additional work is needed to better understand if anterior STs do, in fact, provide important information regarding fall risk and, if so, whether this information is complementary to that obtained from posterior ST. Although it would be premature to dismiss the potential clinical applicability of anterior ST, even with additional data, in the absence of a device that is capable of applying higher maximum loads, it may only be possible to establish a specific fall-risk threshold based on posterior STs. We do not believe the inclusion of mediolateral perturbations would provide additional information given that lateral ST may not predict future falls. 10
Limitations
The current study did not consider the impact of common comorbidities of diabetes including obesity and amputation. While obesity is associated with increased falls and altered reactive stepping ability, 45 it was not specifically considered in our analyses as ST was already normalized to BW. Although normalizing by BW is standard in the field,27,46-51 understanding the extent to which this form of normalization relative to either other normalization techniques or direct covariation best accounts for the effect of body mass on ST, particularly when utilizing a survival analysis, requires further work. Indeed different methods of normalization may differently explain the impact of body weight on ground reaction forces, although ratio normalization, that is, dividing the force by weight, is recommended. 52 Regardless, any impact of obesity on ST in our study may be limited based on our cohort. Most of our participants were classified as Class I or II obese with only four participants categorized as Class III obese (BMI > 40kg/m2). We specifically excluded amputations under the assumption that stepping responses would be affected, as indicated in the literature. 35 Another limitation is that we do not have measures of glycemic control to verify diabetes status or evaluate the impact on STs. Finally, although balance was assessed with the validated NIH toolbox, the NIH toolbox is not considered a gold standard. Given that a primary goal of the present work was to establish the clinical utility of ST by demonstrating its independence from balance measures, such standards are important. Therefore, additional work comparing ST and force/stabilometric plate assessments of balance may be needed to definitively establish the independence of the former from the latter for clinical assessment of fall risk.
Conclusion
In conclusion, the waist-mounted spring scale is a clinically implementable device that can assess ST in older adults with diabetes. Using the device, we demonstrated that ST was affected by diabetes and potentially fall risk, independent of impairments in balance or tactile sensation. Future larger clinical trials in patients with diabetes are needed to establish the repeatability and reliability of the current ST and whether specific cutoffs for fall-risk assessment exist.
Footnotes
Authors’ Note
The content is solely the responsibility of the authors and does not represent the official views of the funding agency (National Institute of Diabetes and Digestive and Kidney Diseases of the National Institutes of Health)
Declaration of Conflicting Interests
The author(s) declared no potential conflicts of interest with respect to the research, authorship, and/or publication of this article.
Funding
The author(s) disclosed receipt of the following financial support for the research, authorship, and/or publication of this article: This study was partially supported by grant 2T35DK074390 from the National Institute of Diabetes and Digestive and Kidney Disease.