
Abstract
Introduction:
The purpose of this study was to investigate the association between the mechanical properties of plantar soft tissue and diabetes status.
Method:
51 (M/F: 21/30) participants with prediabetes onset (fasting blood sugar [FBS] level > 100 mg/dL), age >18 years, and no lower limb amputation were recruited after ethical approval was granted from Pontificia Universidad Catolica del Peru ethical review board. Ultrasound reverberant shear wave elastography was used to assess the soft tissue stiffness at the 1st metatarsal head (MTH), 3rd MTH, and the heel at both feet.
Results:
Spearman’s rank-order correlation (rho) test indicated a significant (P < .05) positive correlations between FBS level and the plantar soft tissue shear wave speed at the 1st MTH: rho = 0.402 (@400 Hz), rho = 0.373 (@450 Hz), rho = 0.474 (@500 Hz), rho= 0.395 (@550 Hz), and rho = 0.326 (@600 Hz) in the left foot and rho = 0.364 (@450 Hz) in the right foot. Mann-Whitney U test indicated a significantly (P < .05) higher shear wave speed in the plantar soft tissue with the following effect sizes (r) at the 1st MTH of the left foot at all tested frequencies: r = 0.297 (@450 Hz), r = 0.345 (@500 Hz), r = 0.322 (@550 Hz), and r = 0.275 (@600 Hz), and at the 1st MTH of right foot r = 0.286 (@400 Hz) in diabetes as compared with the age and body mass index matched prediabetes group.
Conclusion:
An association between fasting blood sugar level and the stiffness of the plantar soft tissue with higher values of shear wave speed in diabetes versus prediabetes group was observed. This indicated that the proposed approach can improve the assessment of the severity of diabetic foot complications with potential implications in patient stratification.
Introduction
The plantar soft tissues of the foot are the first point of contact with the ground during normal gait. The main role of these plantar soft tissues is to act as a shock absorber to reduce the effect of ground reaction forces during activities such as walking, running, and standing.
The plantar soft tissue of the foot consists of highly specialized tissues that present with complex nonlinear, viscoelastic mechanical properties in addition to a complex internal structure comprising of both skin and plantar fat pad. 1
Previous studies show that diabetes is associated with changes in the plantar soft tissue mechanical properties as a result of glycation which is associated with an increased blood sugar level over prolonged periods of time. Specifically, the plantar soft tissue in people with diabetes compared with the age-matched groups of people without diabetes is thicker, 2 stiffer,3,4 harder 5 , and also tends to have less energy return efficiency. 6 In a previous study, the changes in the diabetic fat pad were reported to impair the cushioning ability of the plantar soft tissue in distributing pressure. 7 These changes make the plantar soft tissue more vulnerable to tissue damage and ulceration.
While it has been generally agreed that these changes could be due to the histological changes inside the tissues as a result of glycation, 8 an in vivo study using ultrasound indentation technique in people with diabetes revealed a significantly higher stiffness of heel pad in people with higher levels of fasting blood sugar (FBS). 9 FBS level is commonly recognized as a risk factor for diabetes severity.
Prediabetes (a condition in which the patient has intermediate blood sugar level) 10 has been previously implicated to associate with complications like microvascular and cardiovascular disease11,12 and with microvascular impairment in the skin and retina. 13 While plantar pressure distribution patterns during walking in patients with prediabetes were found to be similar to the participant with diabetes, 14 different gait and balance parameters were found to be affected in patients with prediabetes and those with diabetes. 15 Despite these, the role of blood sugar level on changes in the mechanical properties of the plantar soft tissue has not been previously studied, and it is not known how the mechanical properties of plantar soft tissue are different between patients with prediabetes versus diabetes.
Glycated hemoglobin was recognized as a risk factor for diabetic foot ulceration. 16 Indeed, our previous study shows a direct link between plantar soft tissue mechanical properties and the risk of ulceration using ultrasound strain elastography technique. 17 We also showed that these mechanical properties can be used to enhance the prediction of diabetic foot ulceration. 18
Using strain elastography together with a stand-off material as a reference has addressed a number of issues that are traditionally associated with ultrasound strain elastography and allowed a quantitative measure of the plantar soft tissue. 17 However, as the tissue acts as a viscoelastic material, the strain rate dependency indicates that the frequency at which the tissue undergoes deformation affects the measures of strainability and hence the stiffness.19,20 While in strain elastography, the tissue is deformed at low frequency (1-2 Hz); to manually maintain the exact frequency is challenging.
Shear wave elastography is another noninvasive, ultrasound-based method to assess soft tissue stiffness through the generation of shear waves inside the tissue and measure their propagation speed as they expand laterally in the field of view. However, the use of conventional shear wave elastography is limited in the foot, as the shear waves cannot be formed close to the bone due to excess reflections from the surface of the bone.21,22
To address this limitation, recently a new method known as reverberant shear wave elastography (RSWE) was introduced that allows vibrating the entire tissue with minimal shadowing as the vibration sources propagate in all directions within the medium.
The technique has been previously used for the in vivo assessment of the elastic properties of human liver 23 and breast tissues 24 ; it has not previously been applied to assess the plantar soft tissue where the proximity of bony prominences where reflections of waves exist in conventional ultrasound shear wave elastography methods. Furthermore, the ability of the method to assess the plantar soft tissue of people with diabetes in a clinical setting and association of those properties with disease severity has not been investigated.
Therefore, the aim of this study was to provide a clinically viable method for assessing the mechanical properties of the soft tissue of the foot in people with prediabetes and diabetes and to investigate the association between these parameters and the measures commonly associated with diabetes severity.
Materials and Methods
Participants
After ethical approval was obtained, 51 (M/F: 21/30) participants with hyperglycemia (—FBS level > 100 mg/dL 10 ), age >18 years, and no amputation were recruited at a Militar Geriatrico in Lima, Peru, to participate in this study following a full informed consent. The demographic and diabetes-related blood biochemicals are highlighted in Table 1. In addition, the participants were divided into two groups of both age and body mass index (BMI)-matched diabetes (FBS >125 mg/dl) and prediabetes (125 mg/dL > FBS > 100 mg/dL) (Table 1).
The Median (Range) for Demographic and Diabetes-Related Blood Biochemicals.
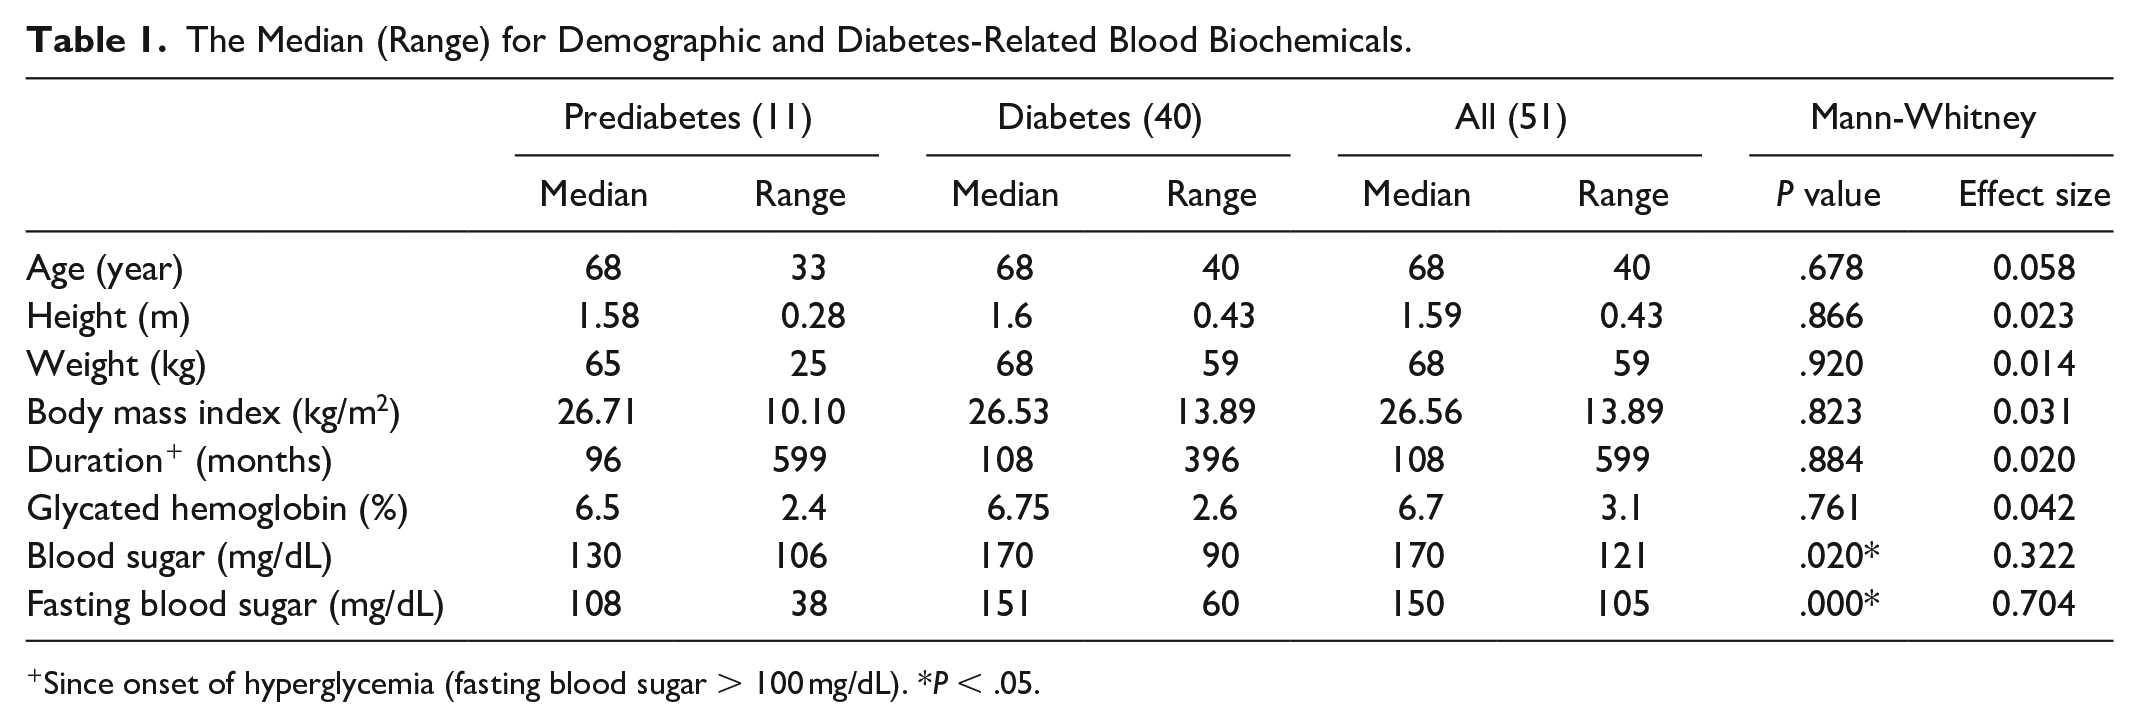
Since onset of hyperglycemia (fasting blood sugar > 100 mg/dL). *P < .05.
Data Acquisition
Data acquisition was performed with the participant lying in a supine position on a hospital bed with their feet positioned at the edge of the bed (Figure 1). The locations imaged for this study were the 1st metatarsal head (MTH), 3rd MTH, and the heel pad as the soft tissue directly over the apex of the calcaneus (heel) as previously reported. 17 All images were collected by a trained sonographer using a linear array model (L7-4, ATL, Bothell, WA, USA) controlled by a Verasonics ultrasound system (Vantage-64, Verasonics, Kirkland, WA, USA).
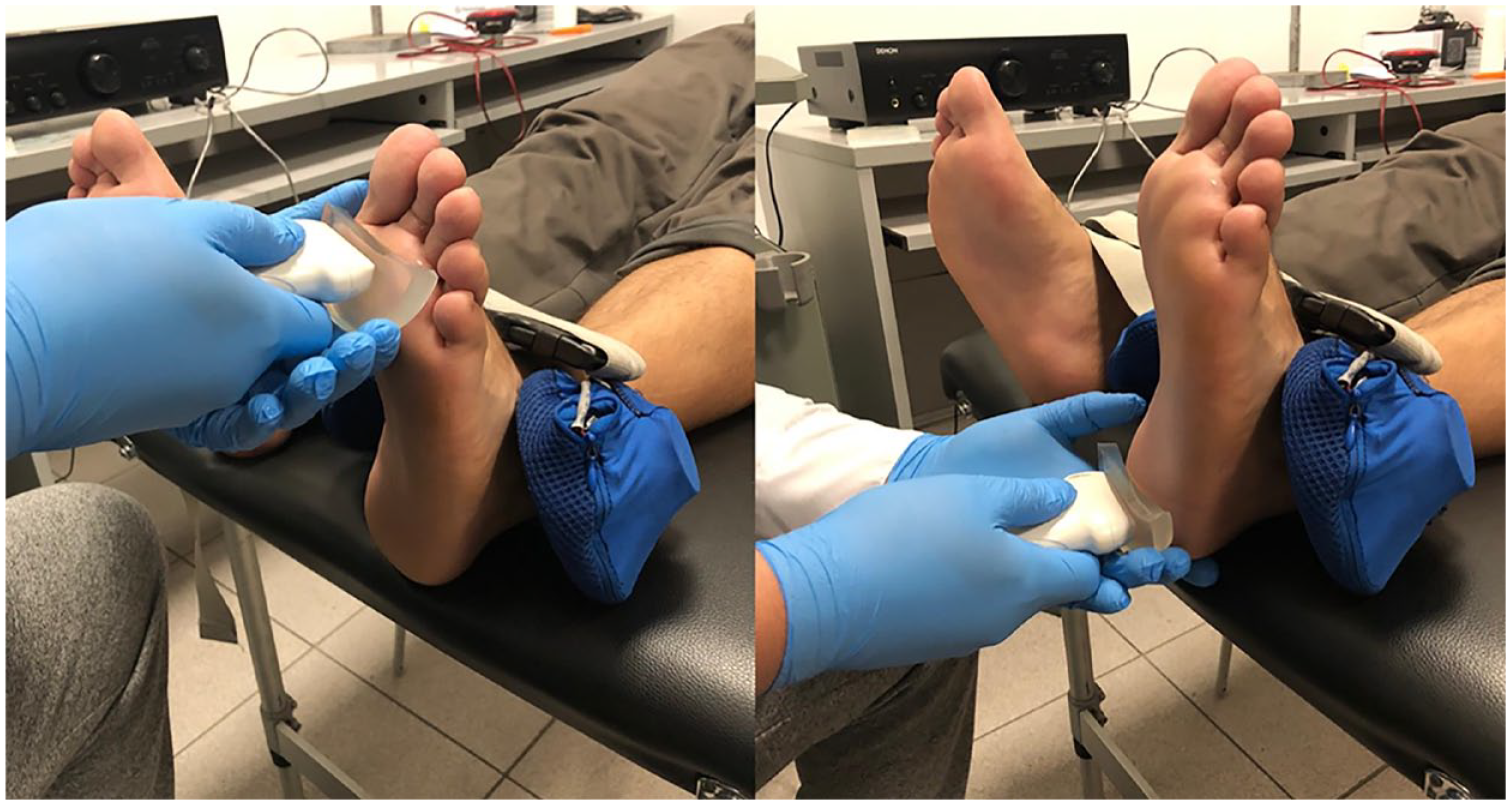
The data collection setup and the positioning of the speakers adjacent to the foot. The probe is shown to be in contact with the plantar skin at the heel through the stand-off material.
Ultrasound coupling gel was applied directly to the participant’s foot along with the standoff material (Figure 2). To image the 1st MTH, the ultrasound probe was placed perpendicular to the plantar surface of the foot imaging the 1st MTH in the frontal plane. The probe was maneuvered so the lateral sesamoid was located at the center of the B-mode image (Figure 2). To image the 3rd MTH, the ultrasound probe was positioned so that the 3rd MTH was in the center of the B-mode image in the frontal plane. Finally, for the heel, the ultrasound probe was positioned so as the apex of the calcaneus, in the frontal plane, was visible and at the center of the B-mode image in line with the previously developed method. 17 Since the amount of compression could affect the stiffness, the shear wave speed in the tissue and the thickness of the standoff were used to assess and normalize the amount of applied force to the tissue. 17 A normalized thickness was calculated as the ratio of soft tissue thickness over the thickness of the interface to account for the effect of loading magnitude on the thickness of soft tissue. 17
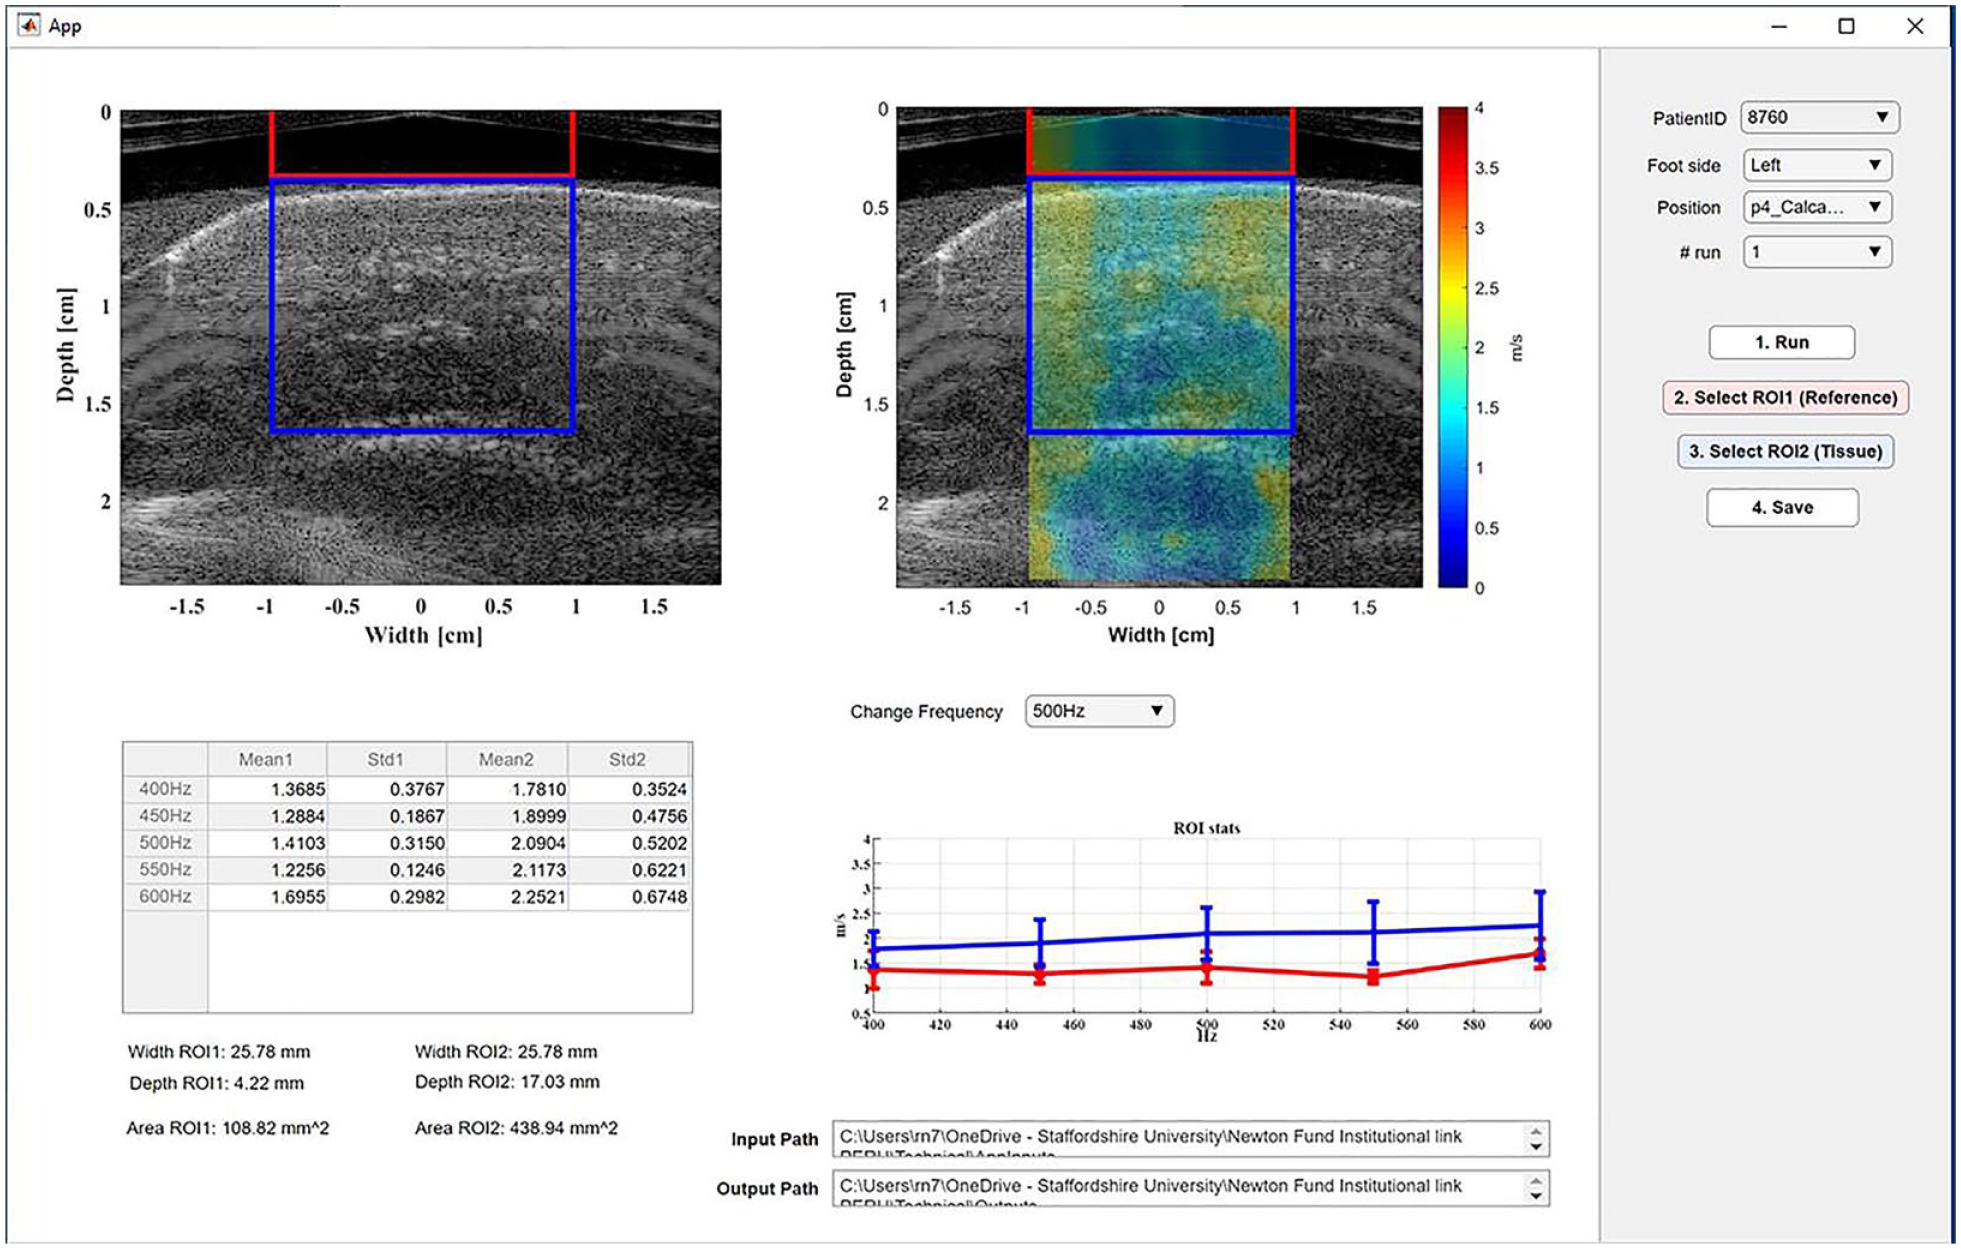
Left side: B-mode image showing the regions of interest including the heel pad tissue (blue box) and the standoff material (red box). The regions of interest in the tissue are defined as the area confined between the skin and the underlying bone (calcaneus in this case). Right side: elastography image obtained with the reverberant shear wave elastography approach superimposed on the B-mode image.
To perform the reverberant shear wave measurements, a customized Graphic User Interface (GUI) was implemented for B-mode imaging and plane wave acquisition in MATLAB software 2019b (The MathWorks, Natick, MA, USA). Once the correct anatomical landmarks had been identified by the sonographer, a set of passively driven speakers (MISCO, Minneapolis, MN, USA) were placed onto the medial and lateral malleoli of the foot being measured. The speakers were powered using an external amplifier (DENON, NJ, USA). When a satisfactory B-mode image was achieved, the custom MATLAB script was started, and the volume of the amplifier was turned up to a prespecified value. The speakers emitted an audio track that consisted of tones of the following frequencies: 400 Hz, 450 Hz, 500 Hz, 550 Hz, and 600 Hz. Once the acquisition time finished, the volume of the speakers was turned down. The frequency spectrum of six points symmetrically spaced between the gel pad and the tissue was shown to confirm the presence of each sinusoidal signal in the temporal-frequency domain and to provide real-time feedback of the quality of the acquisition. Three trials were performed per location per foot, and the average of extracted values for the three trials was used in data analyses. The average error was calculated for test-retest repeatability based on the values extracted from these three trials. In-phase and quadrature (IQ) signal data were saved for post-processing.
Data Processing
Particle displacements were calculated by using the Loupas algorithm. 25 A fixed amount of signals with 10 periods were extracted pixel by pixel. After that, a bandpass temporal frequency filter centered at each vibration frequency with a bandwidth of 20 Hz was applied. Additionally, a spatial frequency domain filtering was applied considering wavenumber limits setting minimum and maximum values of expected shear wave speed values (0.7 m/s and 5 m/s, respectively). Phase information was extracted and analyzed following the method we previously reported. 26 RSWE estimator was performed using a 7.7 × 15.4 mm2 kernel size to evaluate the spatial autocorrelation of particle velocity complex matrix. The real part of the normalized autocorrelation was calculated, and then the lateral profile was extracted (∆z = 0). Local wavenumber was estimated using a curve fitting to the theoretical autocorrelation function in the lateral direction. Each pixel generated an R2 value that was compared with 0.7 as a minimum threshold. Pixels with lower cut-off values were not considered. Finally, the shear wave speed was calculated using the following equation:
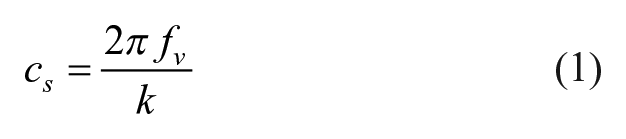
where cs is the shear wave speed, fv is the vibration frequency, and k is the wavenumber.
Statistical Analysis
The coefficient of variation was calculated as the ratio between Standard Deviation and average based on the parameters calculated during the three data collection trials for each site. Shapiro-Wilk test indicated a non-normal distribution (P < .05).
Spearman’s rank-order correlation (rho) test was used to assess the association between the parameters that indicate the severity of diabetes and the tissue stiffness measured using the RSWE approach.
In addition, the participants were divided into age and BMI-matched diabetes (FBS >125 mg/dL) and prediabetes (125 mg/dL > FBS > 100 mg/dL), and Mann-Whitney U was used to assess the differences between the plantar soft tissue mechanical properties between the two groups for both left and right feet separately. All statistical analyses were conducted using commercially available software (IBM SPSS v.24).
Results
The repeatability for test-retest was presented by the average coefficient of variation as shown in Table 2.
The Repeatability for Test-Retest Presented by the Average Coefficient of Variation for Different Parameters.
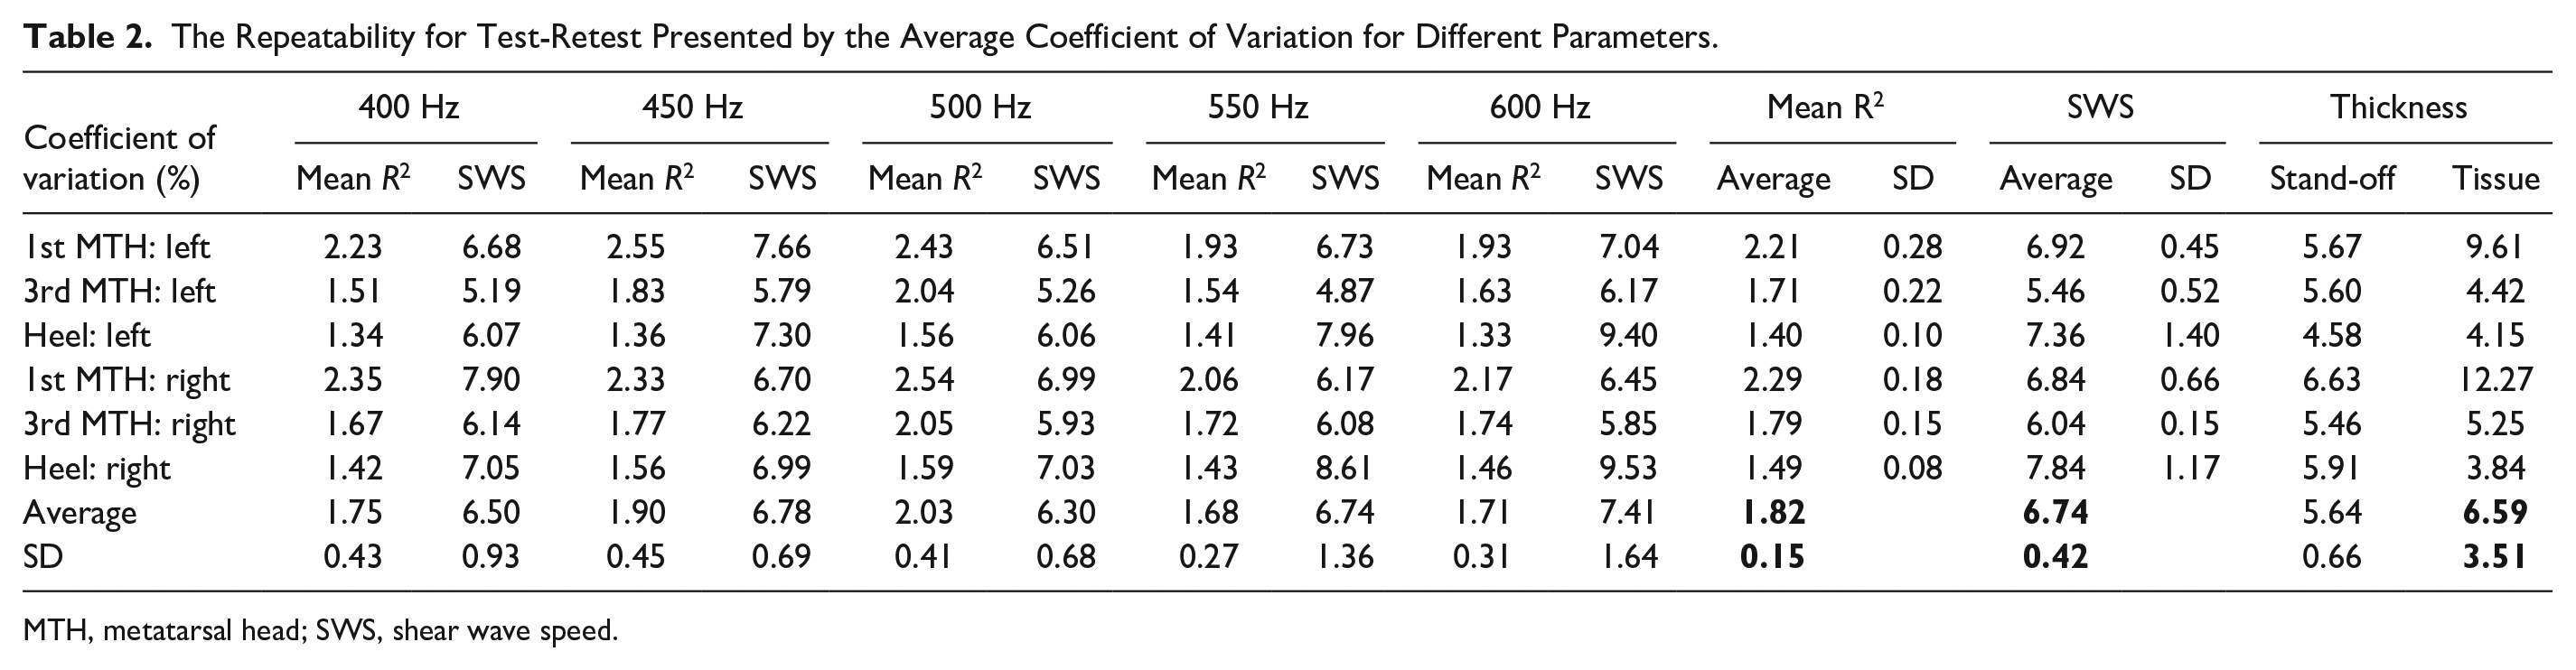
MTH, metatarsal head; SWS, shear wave speed.
Spearman’s rank-order correlation (rho) indicated significant (P < .05) positive correlations between the FBS level and the plantar soft tissue’s shear wave speed at the 1st MTH of the left at all tested frequencies as follows: rho = 0.402 (@400 Hz), rho = 0.373 (@450 Hz), rho = 0.474 (@500 Hz), rho = 0.395 (@550 Hz), and rho = 0.326 (@600 Hz) (Table 3). A significant (P < .05) positive correlation was also observed between the FBS level and the plantar soft tissue’s shear wave speed at the 1st MTH of the right foot: rho = 0.364 (@450 Hz; Table 4). There was no other significant correlation observed between the shear wave speeds measured at different frequencies for any sites and any other parameter that indicated the severity of diabetes (Tables 3 and 4).
Correlation (Rho) Shear Wave Speeds at Different Frequencies and Sites Versus the Parameters Indicating the tissue thickness and the Diabetes Status at the Left Foot.
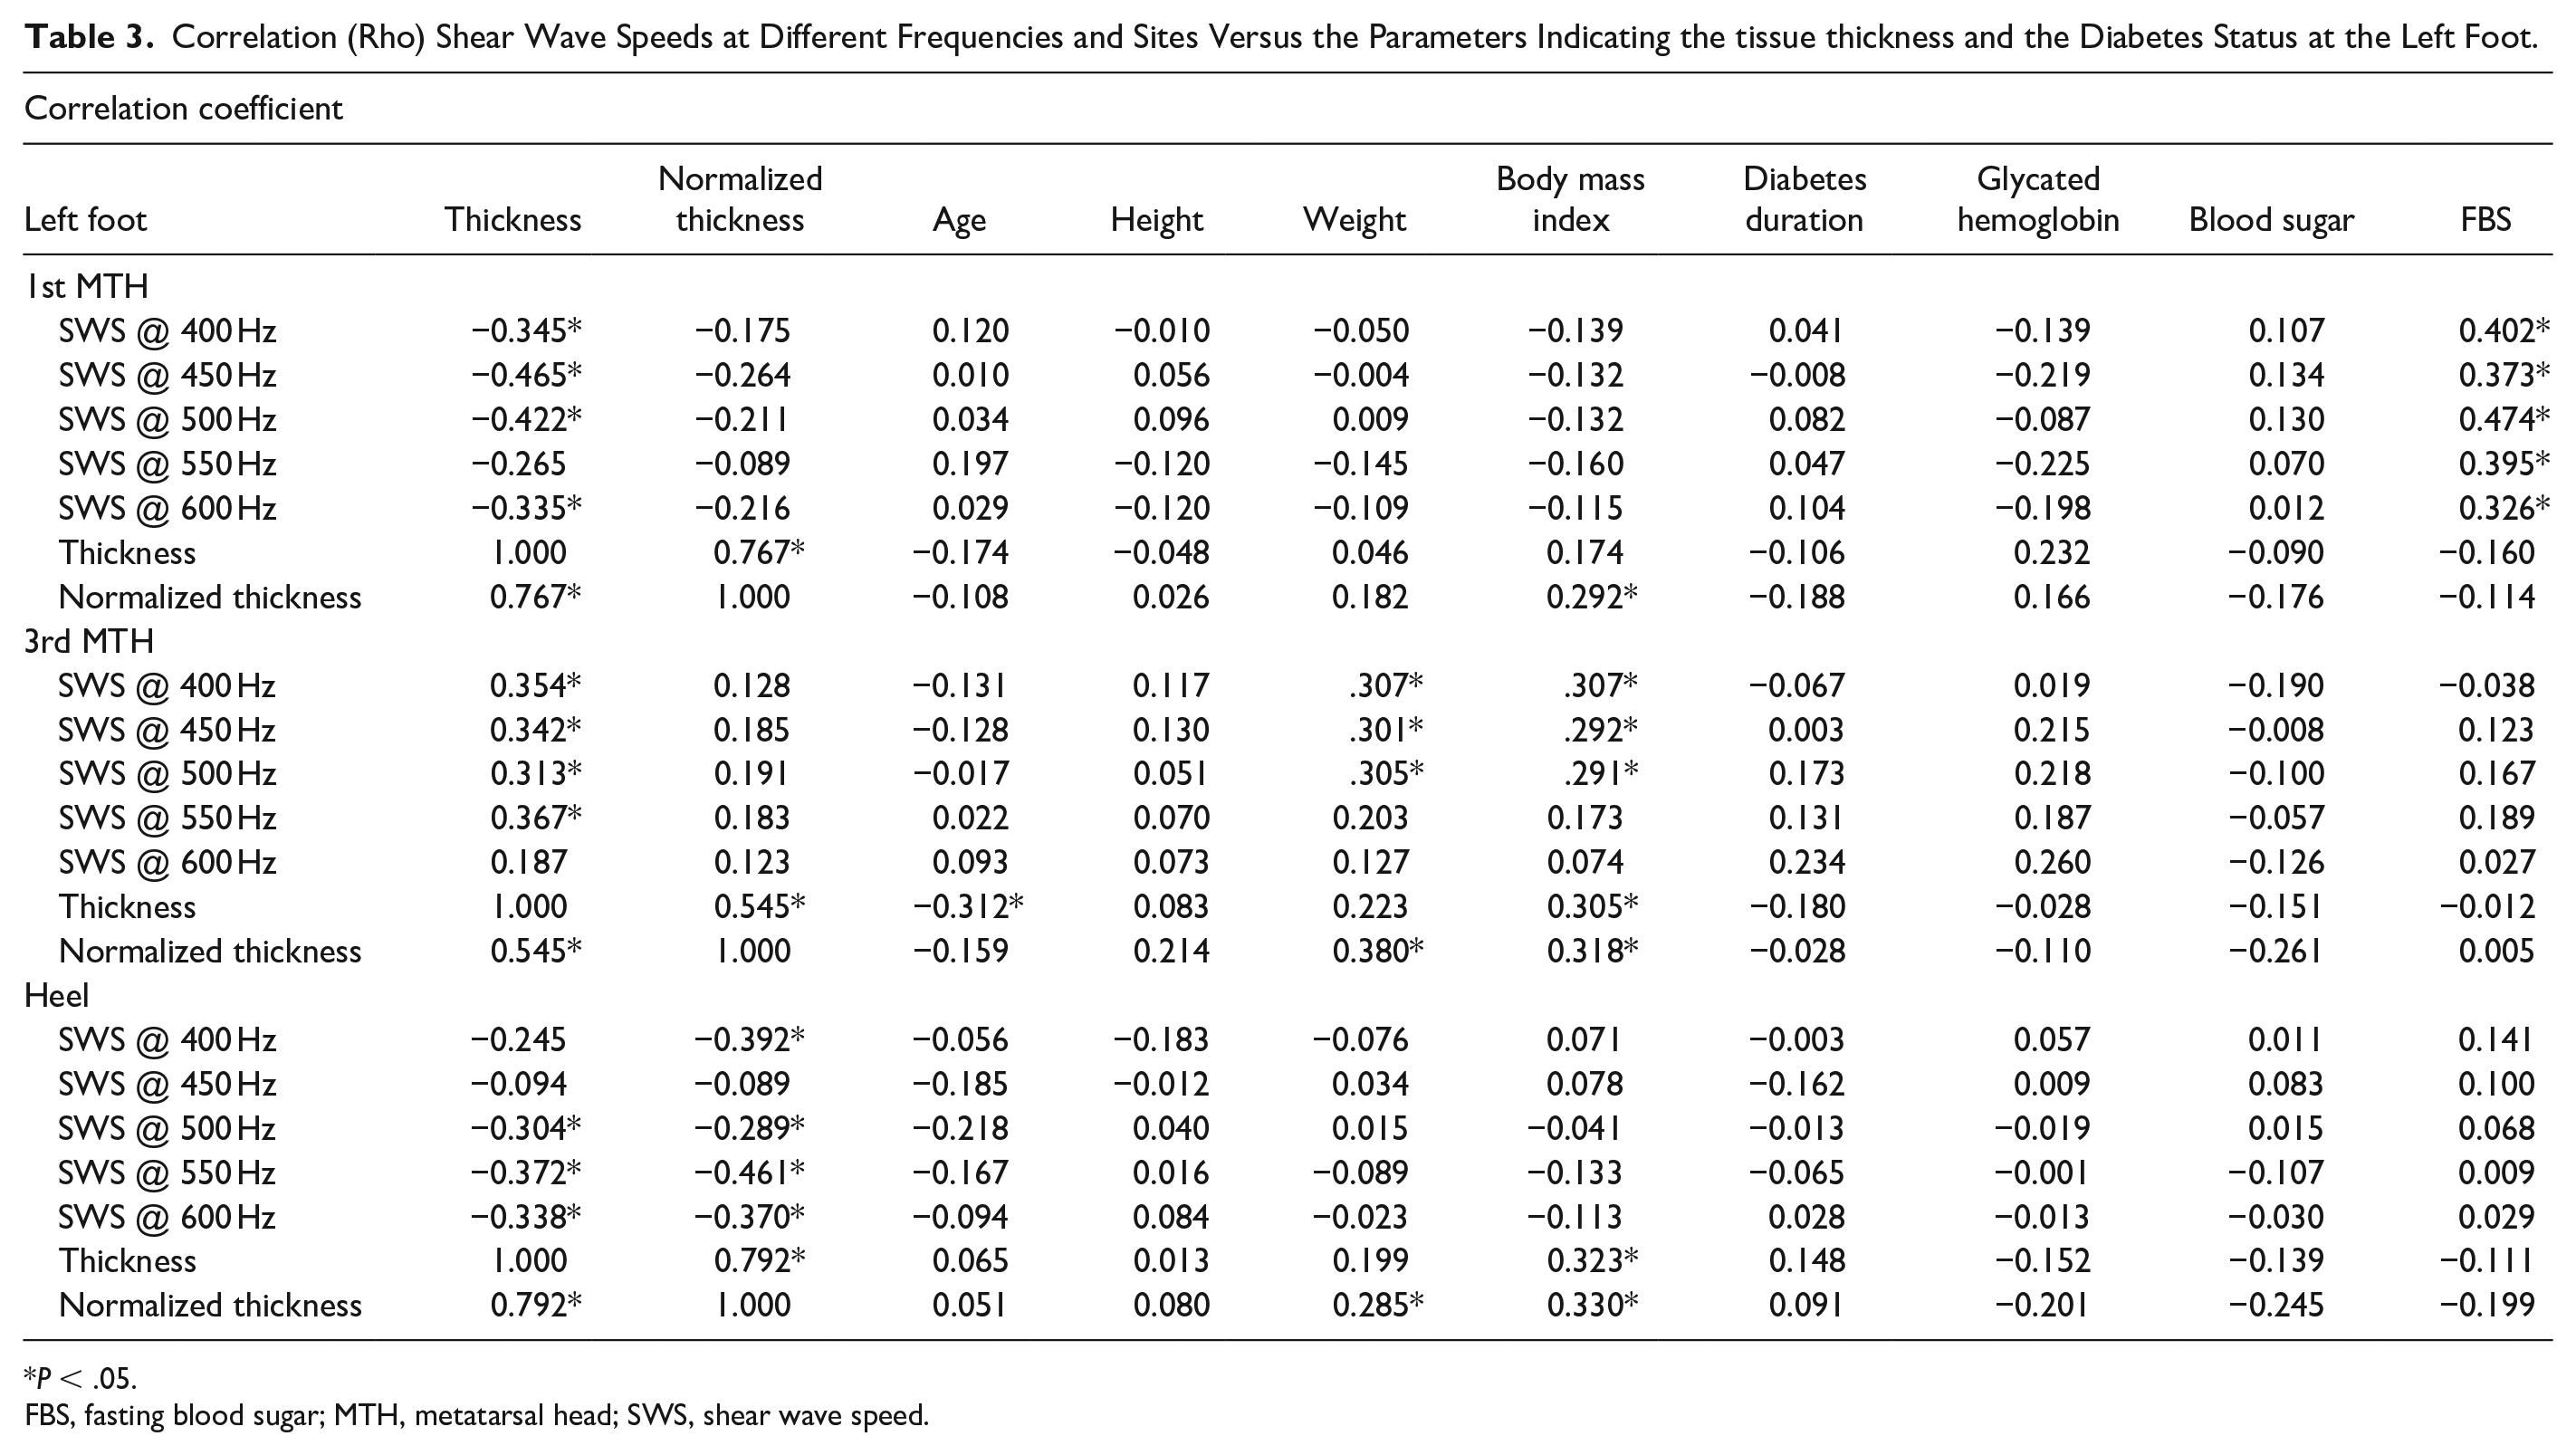
P < .05.
FBS, fasting blood sugar; MTH, metatarsal head; SWS, shear wave speed.
Correlation (Rho) Shear Wave Speeds at Different Frequencies and Sites Vs the Parameters Indicating the tissue thickness and the Diabetes Status at the Right Foot.
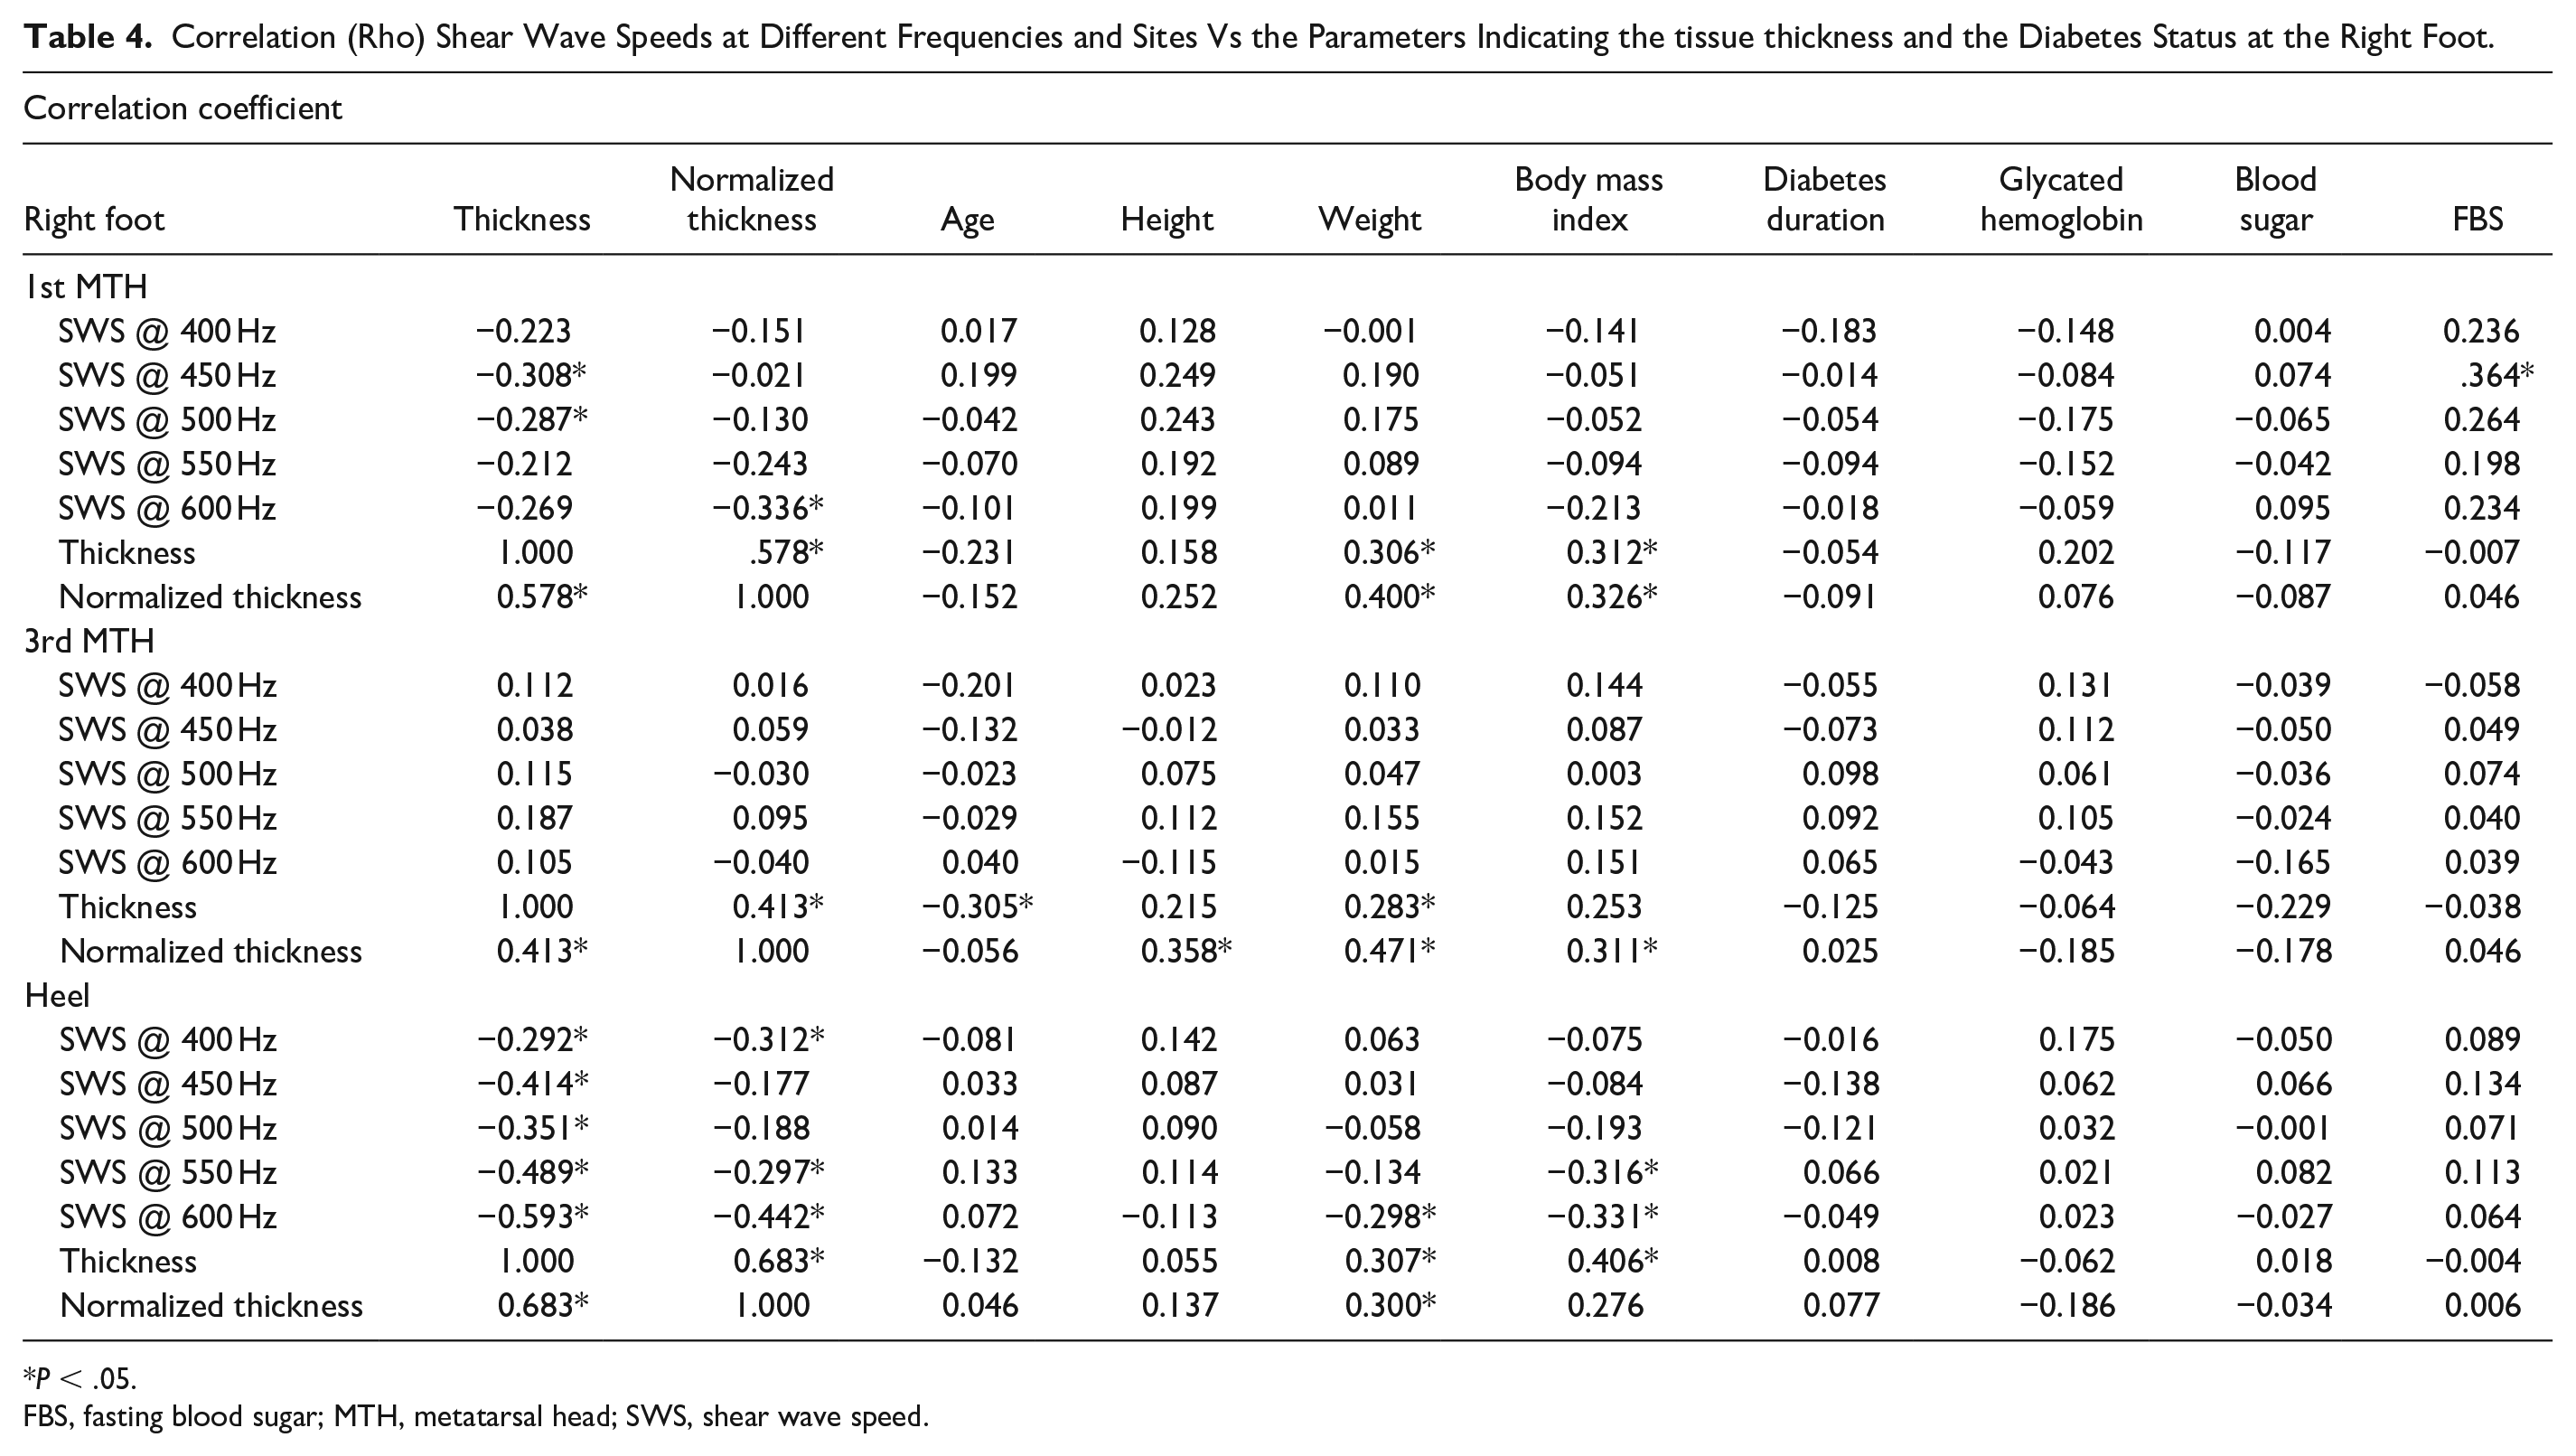
P < .05.
FBS, fasting blood sugar; MTH, metatarsal head; SWS, shear wave speed.
In addition, the test of difference indicated a significantly (P < .05) higher shear wave speed in the plantar soft tissue at the 1st MTH of the left foot at all tested frequencies as follows with the effect sizes (r): r = 0.297 (@450 Hz), r = 0.345 (@500 Hz), r = 0.322 (@550 Hz), and r = 0.275 (@600 Hz) in diabetes (FBS >125 mg/dL) as compared with the prediabetes (125 mg/dL > FBS > 100 mg/dL) group (Table 5). Moreover, the diabetes group showed to have a significantly (P < .05) higher shear wave speed in the plantar soft tissue at the 1st MTH of the right foot at 400 Hz, with the effect size r = 0.286 (Table 6). No other significant differences in the shear wave speed were measured at different frequencies for any sites between diabetes and prediabetes groups (Tables 5 and 6).
Shear Wave Speed Measured at Different Frequencies and the Thickness of the Tissue at Different Sites for the Left Foot and Difference.
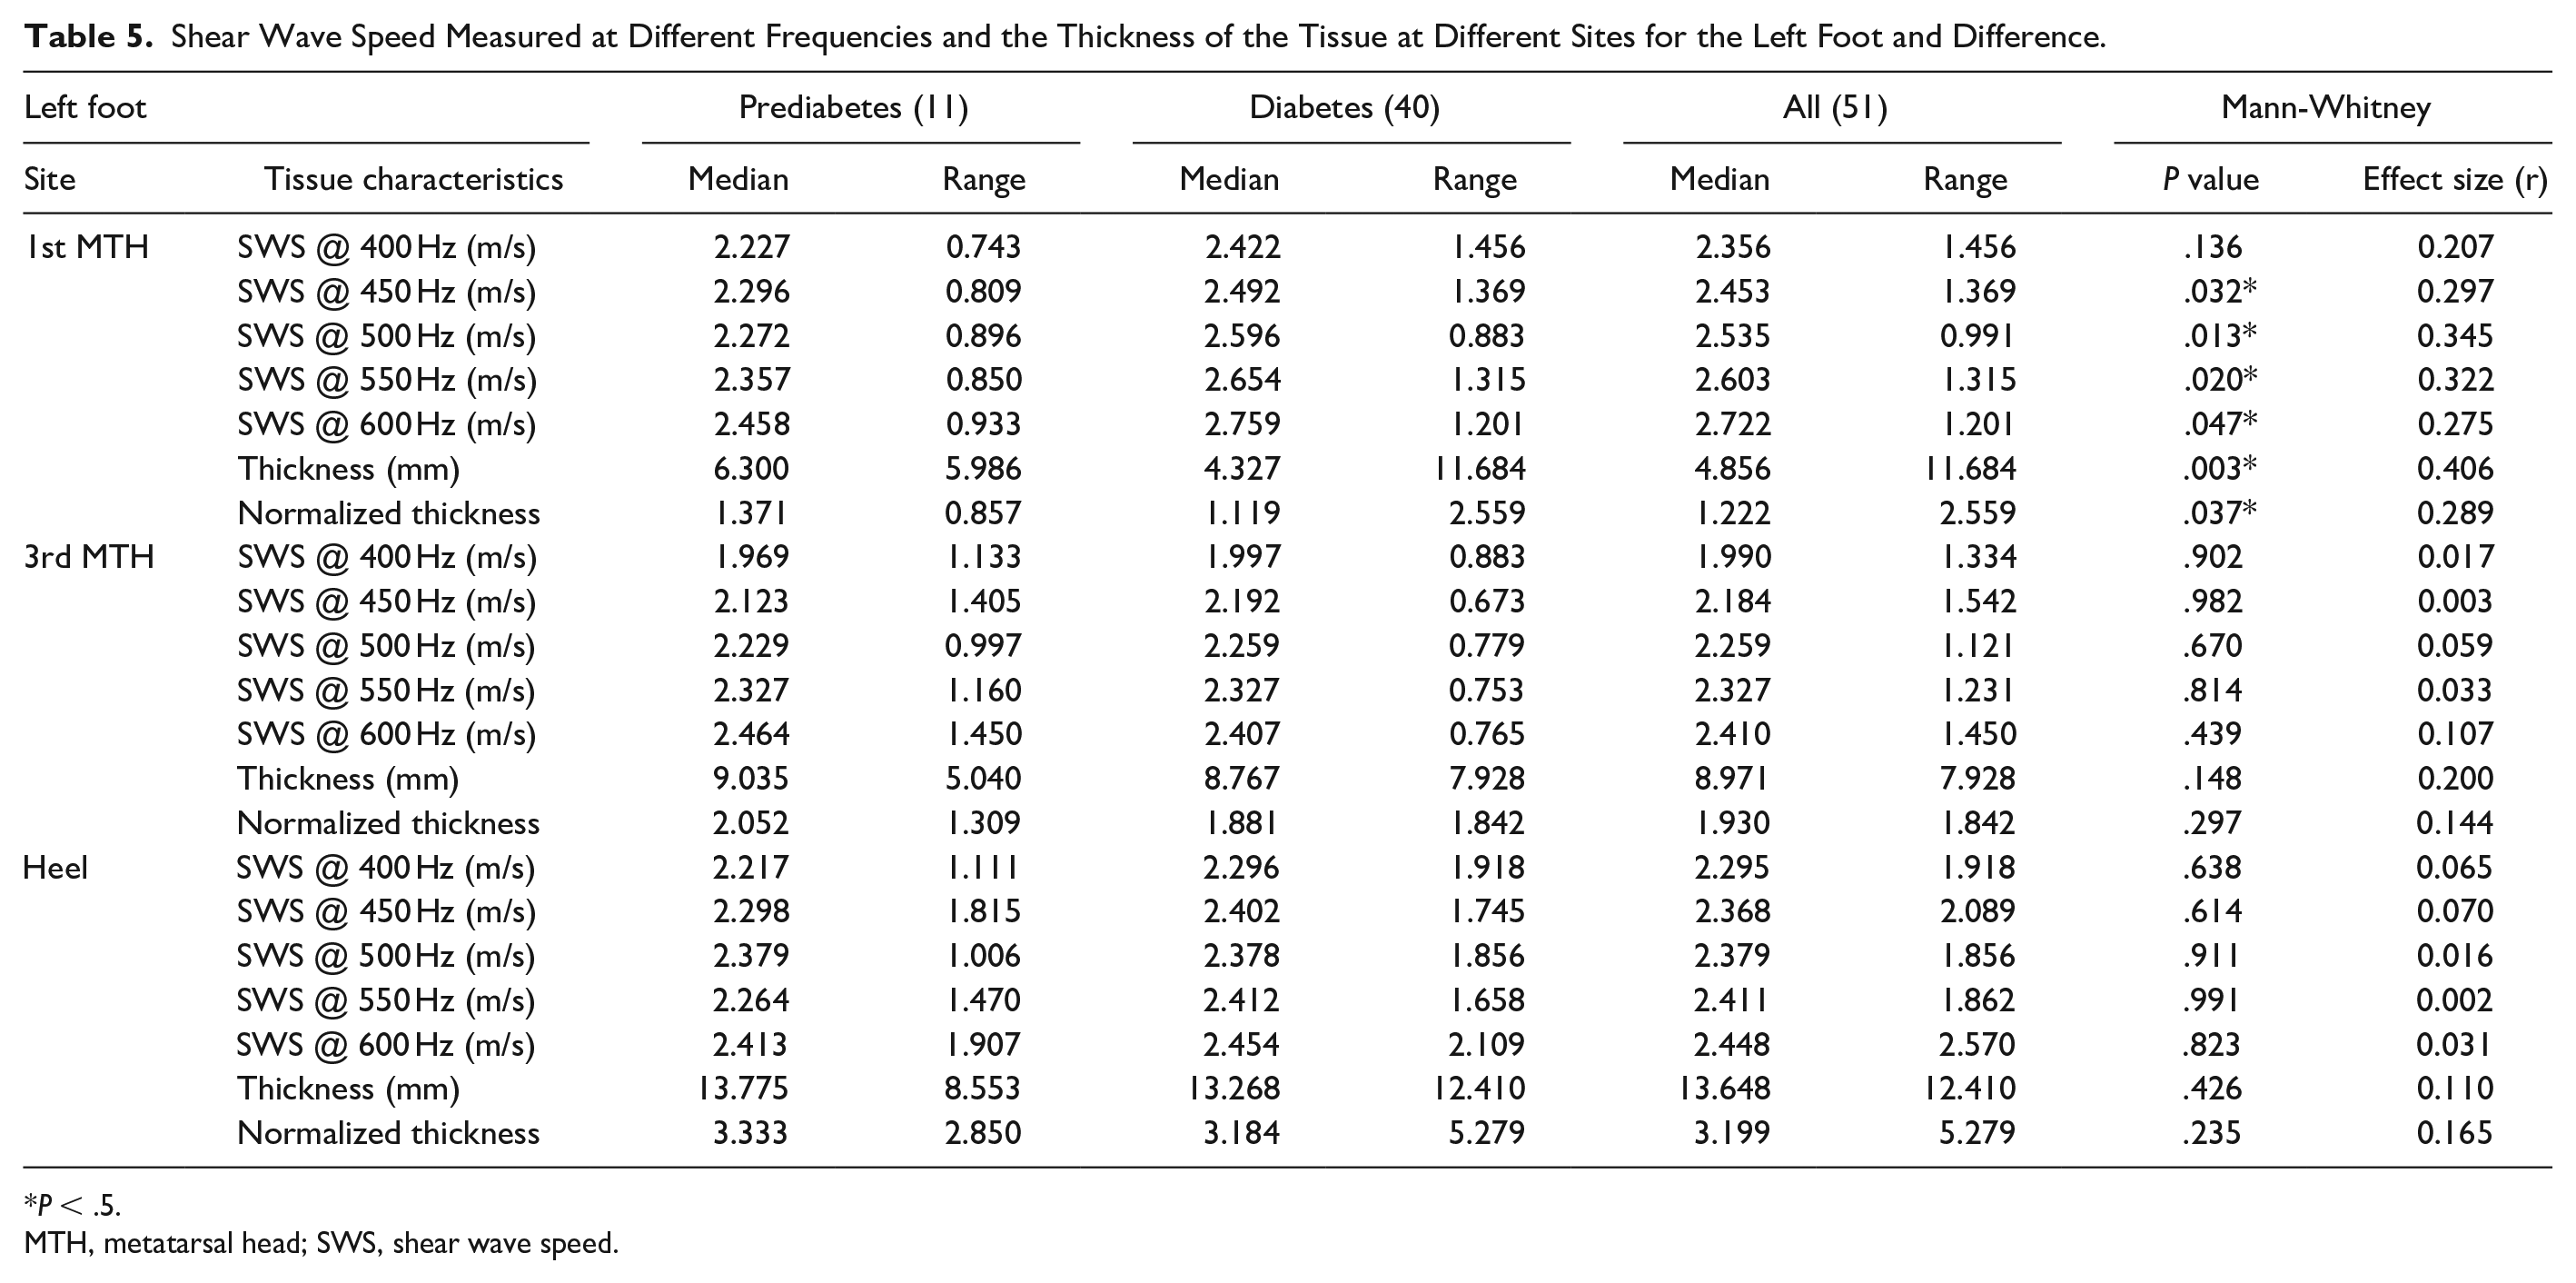
P < .5.
MTH, metatarsal head; SWS, shear wave speed.
Shear Wave Speed Measured at Different Frequencies and the Thickness of the Tissue at Different Sites for the Right Foot and Difference.
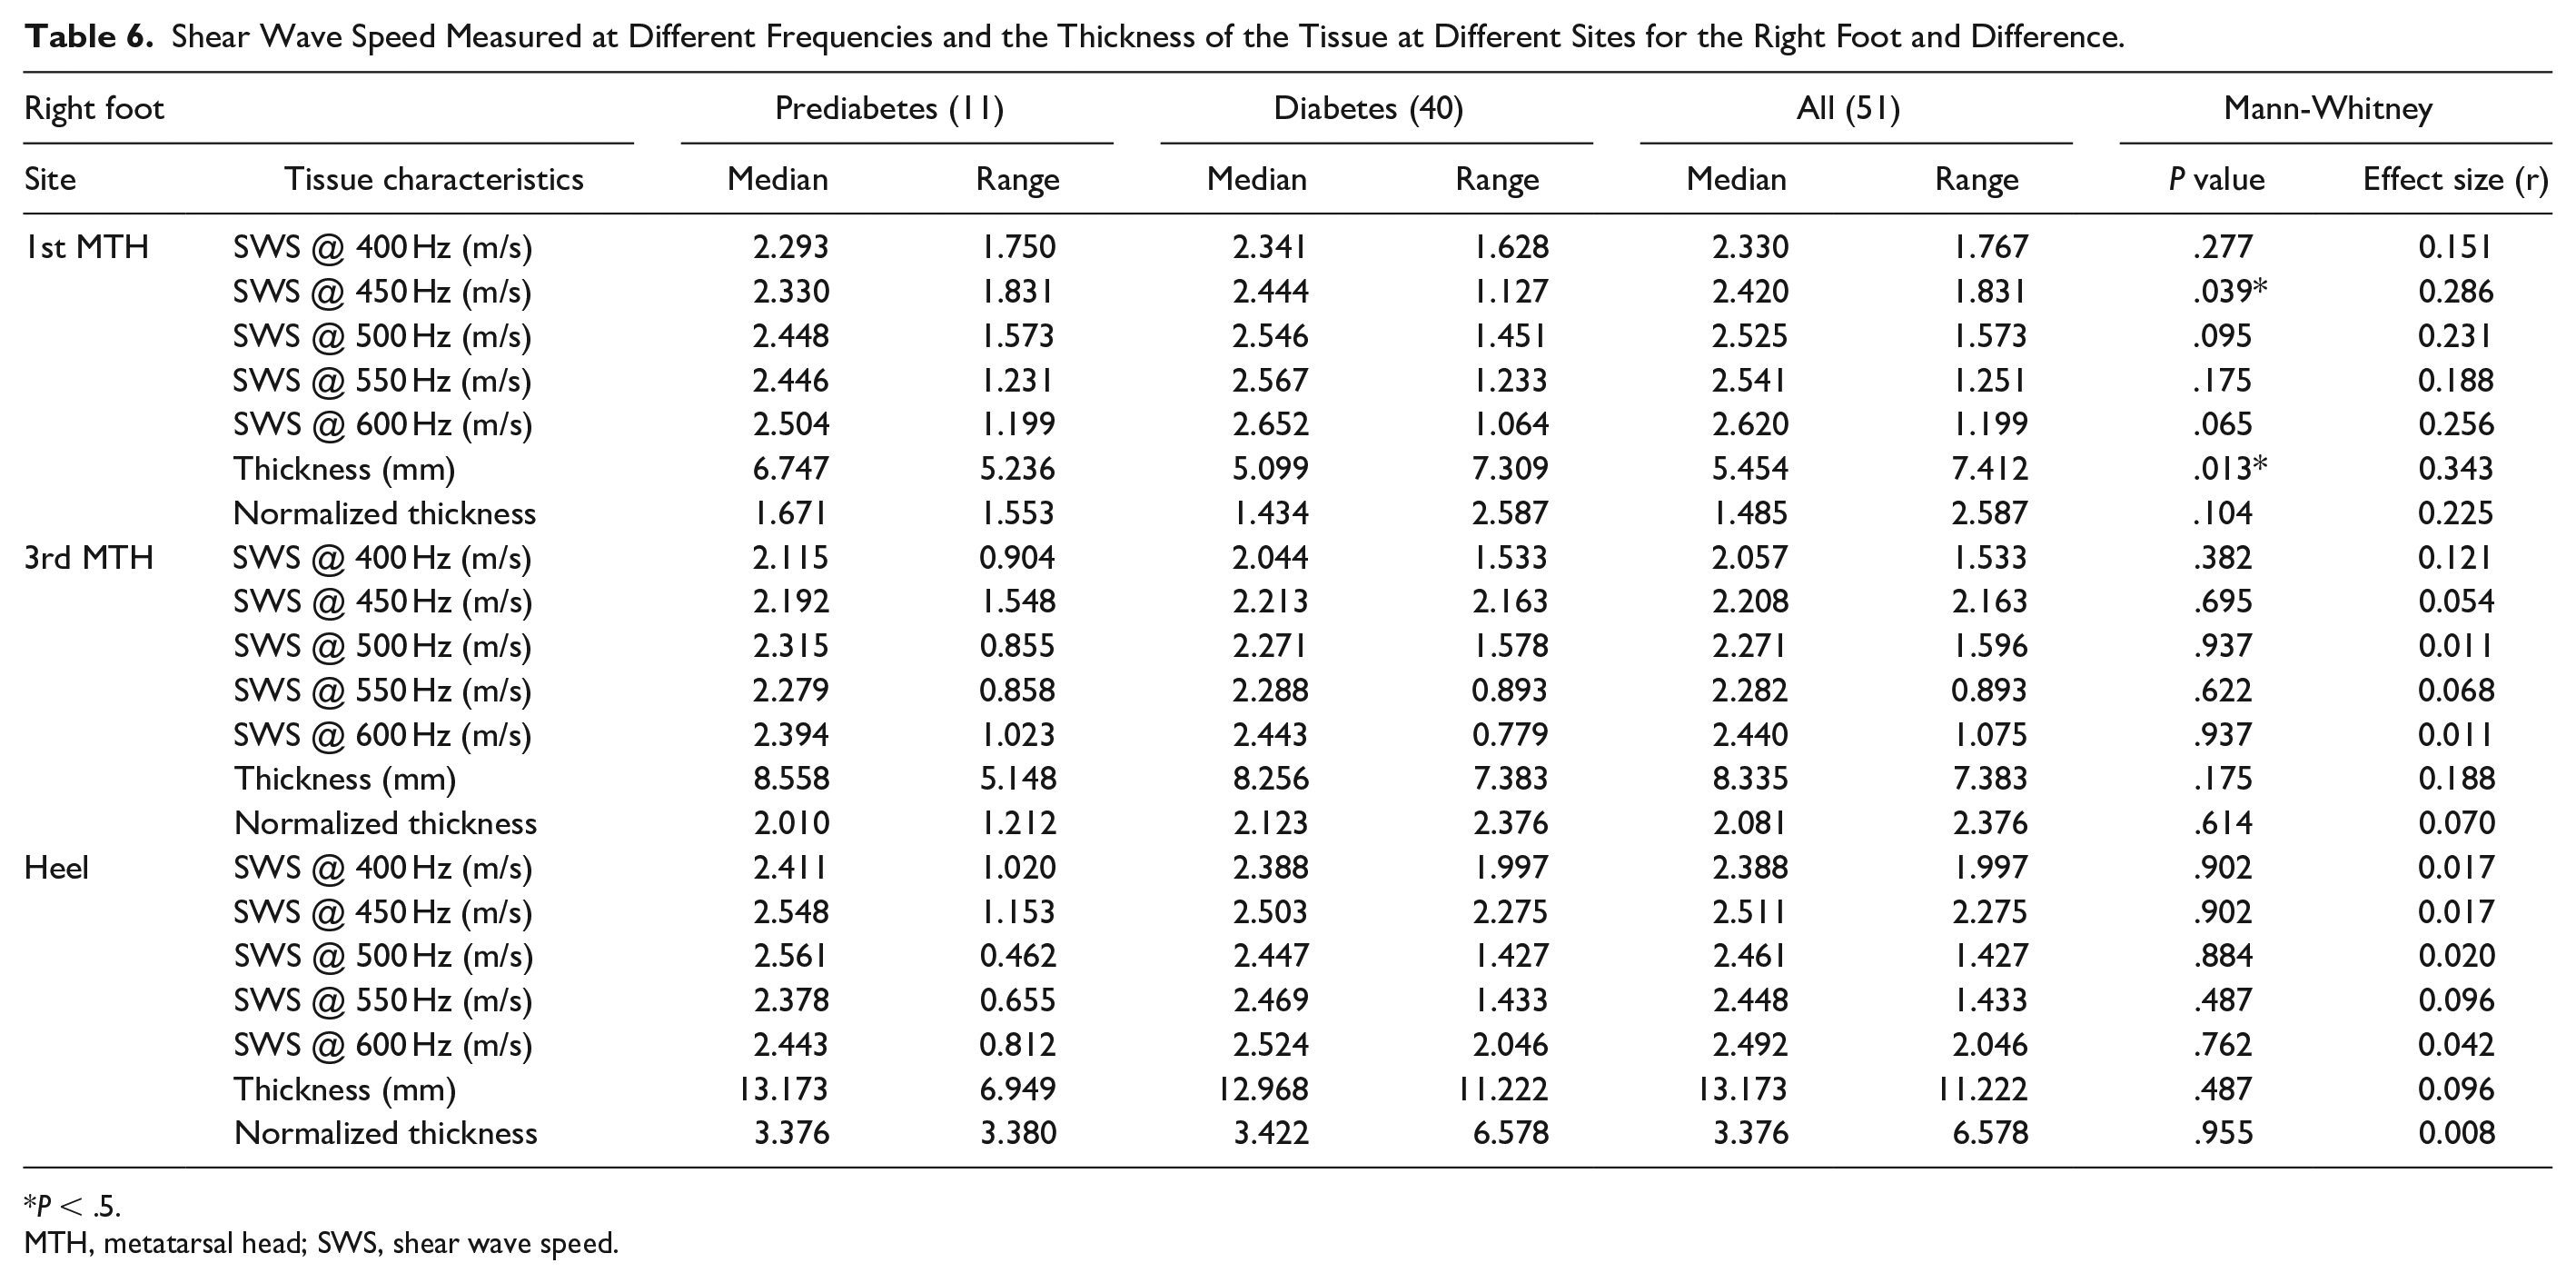
P < .5.
MTH, metatarsal head; SWS, shear wave speed.
Discussion
The purpose of this study was to investigate the association between the mechanical properties of the plantar soft tissue and the measures associated with diabetes severity . The proposed ultrasound RSWE approach when applied to the foot showed to produce repeatable results for test-retest with low coefficient of variation (average ± SD) as 1.82 ± 0.15% for mean R2 and acceptable coefficients of variation for shear-wave speed (6.74 ± 0.42%), tissue thickness (6.59 ± 3.51%), and standoff thickness (5.64 ± 0.66%)as highlighted in Table 2.
The shear wave speed at the 1st MTH was found to be significantly associated with the FBS level. As the higher shear wave speed can be associated with the higher stiffness of the tissue, the results of this study are in line with the results of previous investigations on the heel pad where significant association were reported between FBS level and tissue stiffness. 9 Indeed, the elevated glycemic gap was found to predict the adverse outcome of patients with diabetes with necrotizing fasciitis (Chen et al 2019) 27 .
This is the first study that has utilized ultrasound RSWE to characterize the mechanical properties of the plantar soft tissue of the foot. In addition, this study is unique as, for the first time, the mechanical properties of the plantar soft tissue in people with diabetes were assessed using shear wave elastography.
There is a clear trend that as the vibration frequency increases, there is generally an increase in the shear wave speed (Figure 3). This in line with the previous literature, using RSWE in which the shear wave speed was found to increase with an increase in frequency in the lower limb muscles. 28 Interestingly, Pai and Ledoux 8 have also shown similar results when plantar soft tissue was tested in vitro using compression testing at low frequencies (1-10 Hz).
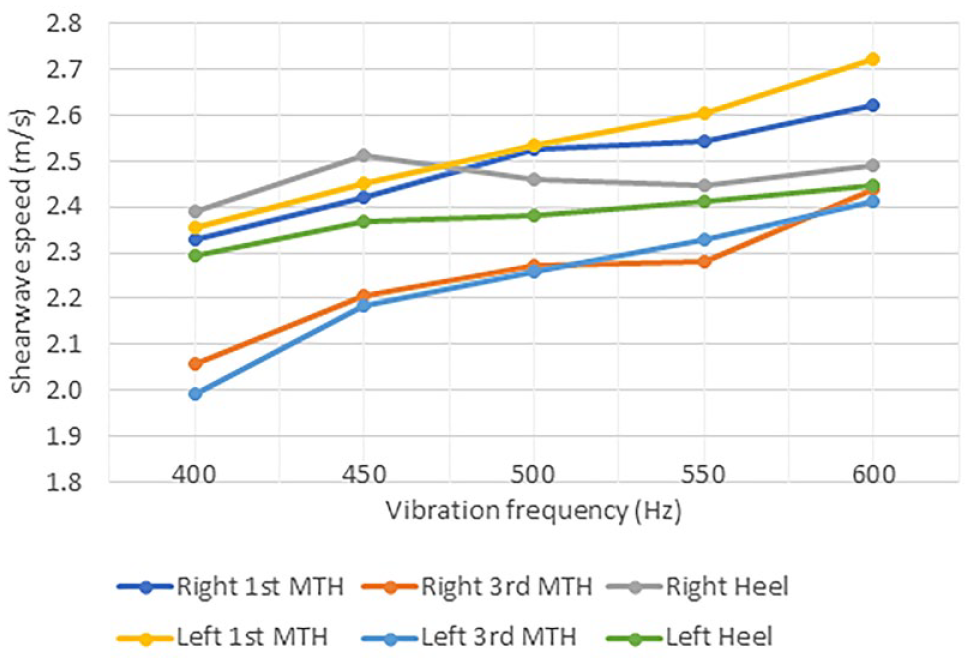
Median shear wave speed at different frequencies at different sites.
The values found in the current study for the shear wave speed at the heel (2.29-2.44 m/s) are comparable to the mechanical properties of the heel pad of healthy participants that were reported using shear wave elastography in a previous study. 22 That study reported an average maximum shear wave speed of 2.8 m/s (calculated based on the reported stiffness value of 23.5 kPa) and a minimum value of 1.35 m/s (calculated based on the reported stiffness value of 5.46 kPa). 22 However, it should be noted that limited information is available about the frequency of the generated shear waves in commercial ultrasound machines. Hence, a direct comparison of the shear wave speed reported in previous studies and the values obtained in this study is not possible.
The relationships between tissue thickness and the measured shear wave speeds were generally observed to be inconsistent (Tables 3 and 4). There were a few significant negative correlations between the shear wave speed and tissue thickness at the 1st MTH and heel in both feet (Tables 3 and 4); however, only in the left foot, a significant positive correlation was observed between the tissue thickness and shear wave speed at the 3rd MTH (Table 3). To eliminate the possible effect of compression on the measured shear wave speed, the relationship between the normalized tissue thickness only showed negative significant correlations with tissue thickness at the heel at few frequencies, while there was no significant relationship observed for either the 1st or the 3rd MTH at any site for either feet (Tables 3 and 4). This indicated that the normalized thickness of tissue does not affect the amount of measured shear wave speed at the 1st and 3rd MTH. However, at the heel, the normalized thickness plays a role and a heel with higher thickness seem to be affiliated with lower reverberant shear wave speed. This can be related to the fact that vibrating the entire tissue in a thicker tissue would be more difficult using the external vibrators.
In this study, the shear wave speed was observed to be higher at the heel compared to the 1st MTH that is in line with the results of our previous study in which strain elastography was used to assess the mechanical properties of the soft tissue of participants with diabetes. 17
The distinct differences between diabetes and prediabetes groups indicate that the transition to diabetes status is associated with a significant increase in tissue stiffness at specific sites where there is more vulnerability to diabetic foot ulcers.
This can have practical applications in early diagnosis of stiffening of the plantar soft tissue as a result of diabetes and can inform appropriate foot care in these groups of patients. The results of the current study are particularly important and have clinical implications as the general positive trend toward the increase in the plantar soft tissue stiffness and the FBS level.
Comparing the diabetes and prediabetes groups in this study, the results show a higher shear wave speed values for the plantar soft tissues of the foot in those with diabetes when compared with participants with prediabetes status. In the absence of previous studies in which the shear wave speed of plantar soft tissue was compared between diabetes and prediabetes group, no direct comparison with the literature could be made.
While in previous studies, prediabetes status has been associated with higher arterial stiffness 29 and with liver stiffness, 30 the current study is the first to investigate the mechanical properties of the soft tissue in people with prediabetes and to compare that against people with diabetes. The observed association between the shear wave speed and the FBS reported in the current study can be linked to the effect of glycation on the plantar soft tissue.
Glycation is the nonenzymatic bonding of a sugar molecule to a protein or lipid molecule that occurs as a result of a prolonged increase in blood glucose levels (hyperglycemia) and is linked to the structural and functional changes in the soft tissue. 31
In this study, a correlation was found between the FBS level and the shear wave speed at different frequencies, given that glycated hemoglobin (HbA1c) represents more long-term effects of glycation, a similar if not stronger correlation would have been expected between HbA1c and shear wave speed. The lack of such a relationship can be related to the fact that the standardization of HbA1c assay is poor, while the standardization of glucose assay is easier to implement. Inaccuracies in measurement and poor standardization of HbA1c measurements are still a common problem. 32 Although the standardization for plasma glucose is not perfect, the implementation of FBS could be more easily aligned to a standard than A1C 32 . This could have been the main reason behind not observing any association between A1c and the plantar shear wave speed in this study.
The plantar fat pad is characterized by a honeycomb configuration in which fibrous septa (composed of collagen and elastin fibers) envelope adipose compartments. 33 Fibrous septa provide constraint to the deformation of adipose chambers that are made of closely packed fat cells. 34 The results of the current study in which shear wave speed is correlated with the FBS level is in line with the in vitro studies of cadaveric diabetic feet in which a thicker fibrous septa with an increase in elastin concentrations 35 was linked to the increased stiffness in the mechanical properties of plantar soft tissue in diabetes. 36
The observed discrepancies between the results of the left and right foot in the current study are in line with previous observations in a few biomechanical studies on the diabetes population. For example, asymmetry was reported between ipsilateral and contralateral regions of the foot in a study of patients with diabetes. 37 Furthermore, in our previous study, we found differences in the mechanical properties between ulcerated and nonulcerated patients only on the left and not on the right foot. 17 This could be the result of the asymmetry in loading the feet during gait that was previously reported. 38
Conclusion
This study for the first time showed the ability of the ultrasound RSWE approach in assessing the mechanical properties of plantar soft tissue in people with diabetes. A significant association was found between the shear-wave speed at the 1st MTH and the FBS. The method also showed to be able to differentiate between the mechanical properties of plantar soft tissue at the 1st MTH of people with diabetes and those with prediabetes status. The results of this study support the notion that the biomechanical changes in the blood affect the mechanical properties of the soft tissue in people with diabetes. Furthermore, this study indicates a distinct and significantly higher stiffness at the 1st MTH stiffness in people with diabetes as compared with their BMI and age-matched prediabetes counterparts. These indicate that the proposed approach can improve the ability of assessing the severity of diabetic foot complications and can have potential implications in patient stratification.
Footnotes
Acknowledgements
We are grateful to Elastance Imaging for the loan of the vibration sources equipment. We also thank Dr Kevin J. Parker for his advice regarding the implementation and application of the reverberant shear wave elastography.
Abbreviations
FBS, fasting blood sugar; RSWE, reverberant shear wave elastography.
Declaration of Conflicting Interests
The author(s) declared no potential conflicts of interest with respect to the research, authorship, and/or publication of this article.
Funding
The author(s) disclosed receipt of the following financial support for the research, authorship, and/or publication of this article: this study is supported by the Newton Fund Institutional Links grant, under the project title: “Development of an ultrasound-based diagnostic tool to identify diabetic foot ulceration risk in Peruvian population”. This was a collaboration between Staffordshire University (UK) and Pontifical Catholic University of Peru (March 2019-February 2020), grant agreement number: 414703139.