
Abstract
Background:
GlucoTab, an electronic diabetes management system (eDMS), supports healthcare professionals (HCPs) in inpatient blood glucose (BG) management at point-of-care and was implemented for the first time under routine conditions in a regional hospital to replace the paper insulin chart.
Method:
To investigate quality of the eDMS for inpatients with type 2 diabetes mellitus a monocentric retrospective before-after evaluation was conducted. We compared documentation possibilities by assessing a blank paper chart vs the eDMS user interface. Further quality aspects were compared by assessing filled-in paper charts (n = 106) vs filled-in eDMS documentation (n = 241). HCPs (n = 59) were interviewed regarding eDMS satisfaction.
Results:
The eDMS represented an improvement of documentation possibilities by offering a more structured and comprehensive user interface compared to the blank paper chart. The number of good diabetes days averaged to a median value of four days in both groups (paper chart: 4.38 [0-7] vs eDMS: 4.38 [0-7] days). Median daily BG was 170 (117-297) mg/dL vs 168 (86-286) mg/dL and median fasting BG was 152 (95-285) mg/dL vs 145 (69-333) mg/dL, and 0.1% vs 0.4% BG values <54 mg/dL were documented. Diabetes documentation quality improved when using eDMS, for example, documentation of ordered BG measurement frequency (1% vs 100%) and ordered BG targets (0% vs 100%). HCPs stated that by using eDMS errors could be prevented (74%), and digital support of work processes was completed (77%). Time saving was noted by 8 out of 11 HCPs and estimated at 10-15 minutes per patient day by two HCPs.
Conclusions:
The eDMS completely replaced the paper chart, showed comparable glycemic control, was positively accepted by HCPs, and is suitable for inpatient diabetes management.
Introduction
Challenges for inpatient diabetes management are common and multifaceted. For example, healthcare professionals (HCPs) are not only confronted with missing implementation of evidence-based guidelines and missing diabetes experts at point-of-care, but they also have to deal with management of hyper- and hypoglycemia and the use of insulin as a high-risk medication. These challenges do not only influence quality of care and patient outcomes but they also have an impact on documentation quality.1-5
The paper insulin chart is the most commonly used type of diabetes management documentation in hospitals. They are not only used for documentation but also for communication and interpretation of diabetes management by various HCPs such as physicians, nurses, and dietologists. 6 Especially insulin prescription and administration are often error prone.7,8 According to the National Diabetes Inpatient Audit, 4 31% of inpatients with diabetes experience a medication error during inpatient stay. Incorrectly administered insulin doses, varying abbreviations in insulin prescription, illegible handwriting, incorrect names, and doses or types of insulin prescription are some of the main risks in paper-based documentation.6-11
Guidelines recommend a standardized documentation of inpatient diabetes management and thus the implementation of digital documentation systems.1,2 Digital systems can assist HCPs in providing transparent and readable documentation. Further, electronic prescriptions are less likely to cause medication errors in inpatients with diabetes. 4 Digital decision support for clinical pathways and decision support for complex treatment regimens (eg, basal-bolus insulin therapy) are recommended by evidence-based guidelines.1,2 To adopt these recommendations, GlucoTab, an electronic diabetes management system (eDMS), has been developed in the last 10 years. This eDMS offers a point-of-care solution for inpatient diabetes management and the integrated digital workflow support provides assistance for various workflow steps in diabetes care including planning, performance, and documentation. Efficacy, safety, and user acceptance of the eDMS has been shown in several clinical studies.12-15 These clinical studies were based on strict study protocols and might thus be of limited value with regard to translatability to everyday clinical routine. To assess the eDMS in daily clinical routine, we implemented the eDMS for the first time in a regional public hospital.
The aim of this study was to investigate the impact of the eDMS on quality of care (eg, glycemic management) and documentation quality in routine diabetes management under treating physicians’ supervision in inpatients with type 2 diabetes mellitus (T2D) replacing the paper chart. Focus of the study was the practicability of several new features rather than the use of decision support for basal-bolus insulin therapy (eDMS BBT).
Methods
This study was a monocentric, retrospective before-after evaluation. Ethical approval from the ethical board of the Medical University of Graz (EK-No. 30-429 ex 17/18) was obtained. The study was performed according to the principles of Good Clinical Practice and in accordance with the Declaration of Helsinki.
Hospital Hartberg is a 180-bed, regional, public hospital and is responsible to provide both in- and outpatient care including internal medicine, surgery, gynecology & obstetrics, anesthesiology & intensive care, radiology, and psychiatry.
Inpatients with T2D aged >18 years, who received insulin for a minimum of two days, were included for the before-after evaluation. Patients with type 1 diabetes, gestational diabetes, and/or pregnancy were excluded. For paper chart evaluation, records of patients with diabetes were screened from November 2016 backward until the required number of patients according to the power calculation was reached. In total, 106 patients met the inclusion criteria. For eDMS evaluation, all records from patients treated using the eDMS in 2017-2018 were screened. In total, 241 patients met the inclusion criteria and we were able to include more patients than required based on the power calculation. For each included patient the whole inpatient stay was assessed for evaluation. Main patient characteristics were comparable in both groups and are listed in Table 1.
Main Demographic and Baseline Characteristics of Patients with Diabetes (n [%], Median [Minimum-Maximum]).
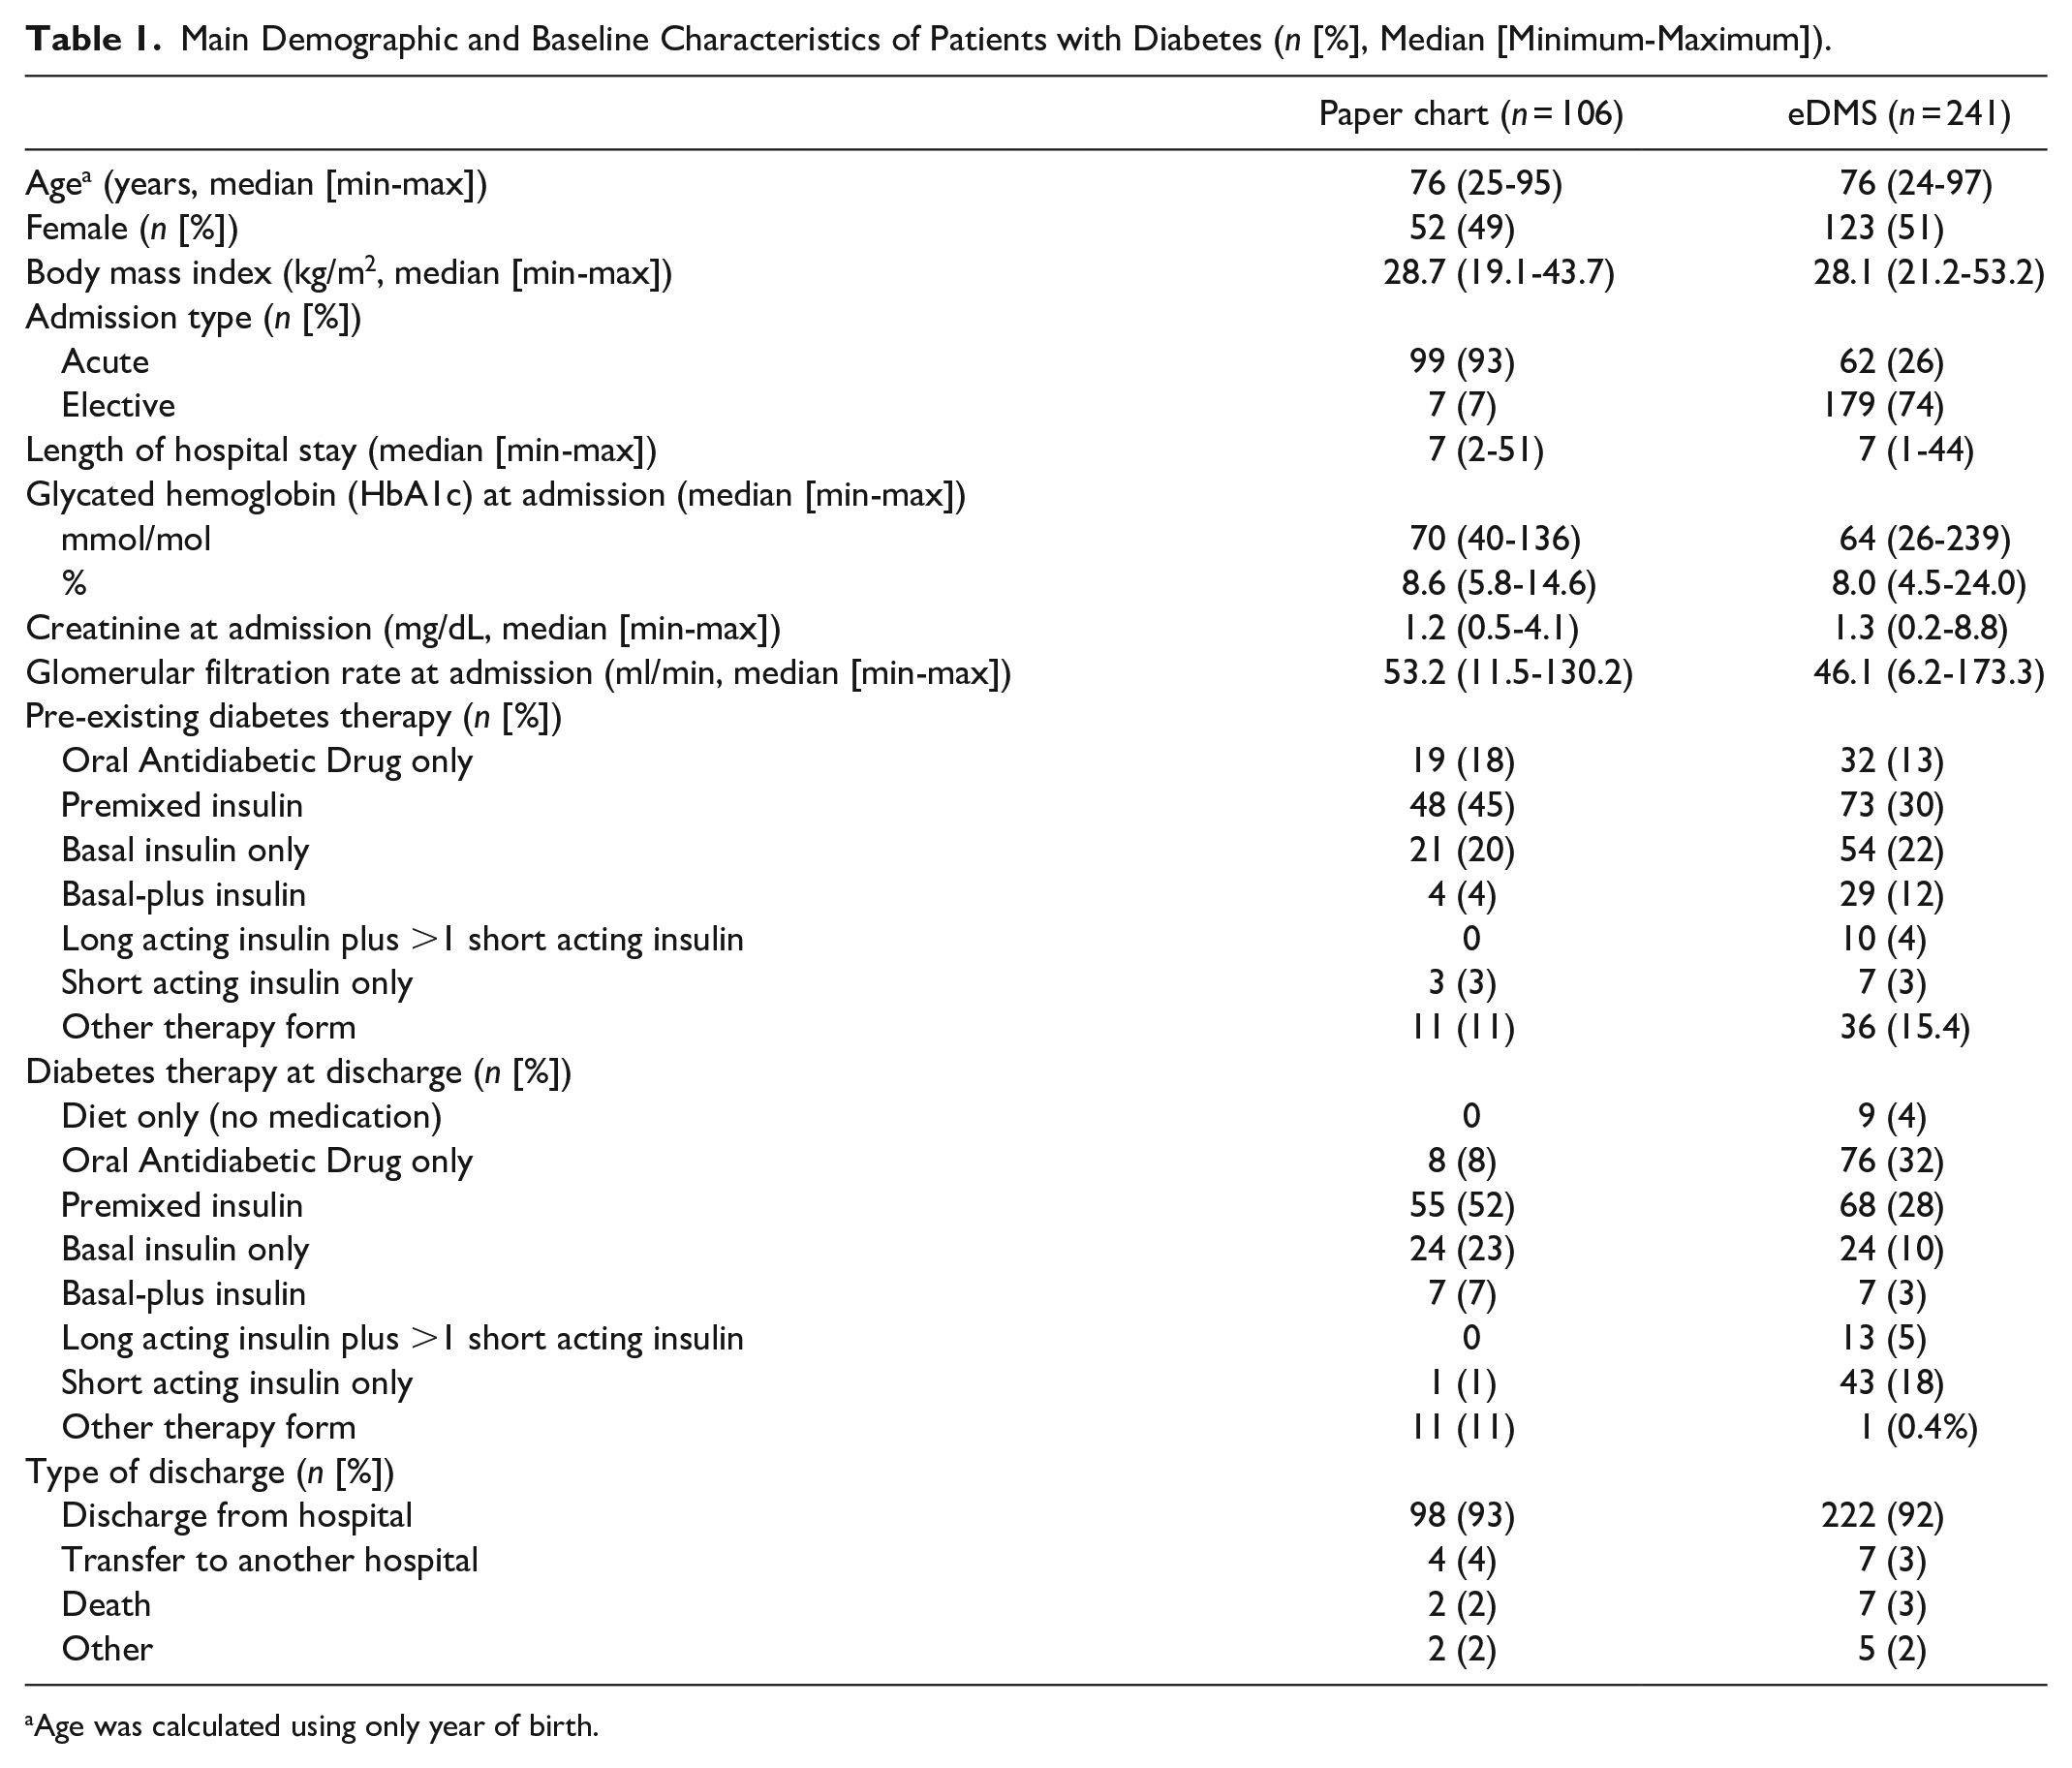
Age was calculated using only year of birth.
Implementation of the eDMS Management System
Before the eDMS was implemented, Hospital Hartberg did not use any standard operating procedures or inpatient diabetes guidelines in routine diabetes care (eg, standardized diabetes therapy regimens, standardized diabetes discharge management, and standardized diabetes related advanced training/education for HCPs) and a paper insulin chart was used for documentation.
The eDMS was initially developed by the Medical Univer-sity of Graz and JOANNEUM RESEARCH Forschungsge-sellschaft GmbH and was further developed by decide Clinical Software GmbH. The eDMS was implemented as a pilot at Hospital Hartberg to replace the paper chart. The CE marked eDMS offers a point-of-care solution for inpatient diabetes management including workflow support by visualization of open tasks, support with a documentation interface, automated suggestions for insulin dose and adjustment regarding BBT, and suggestions for blood glucose (BG) measurement frequency. Despite its general availability, the eDMS’s BBT algorithm was not focus in this study.
The eDMS was extended to be used on a desktop PC or laptop and it was embedded in the electronic medical record (Figure 1). HCPs were also able to use the eDMS on a tablet. Workflow was also documented and supported for therapies without eDMS BBT algorithm (prescription of diabetes medications according to the treating physician, flexibility timing when determining the insulin dose by doctors, possibility of subsequent documentation, eg, for patient self-management). The eDMS was implemented stepwise at departments, starting with three wards at the department of internal medicine followed by two wards at the surgery department. eDMS implementation also included a 75-minute group training of end-users before implementation.
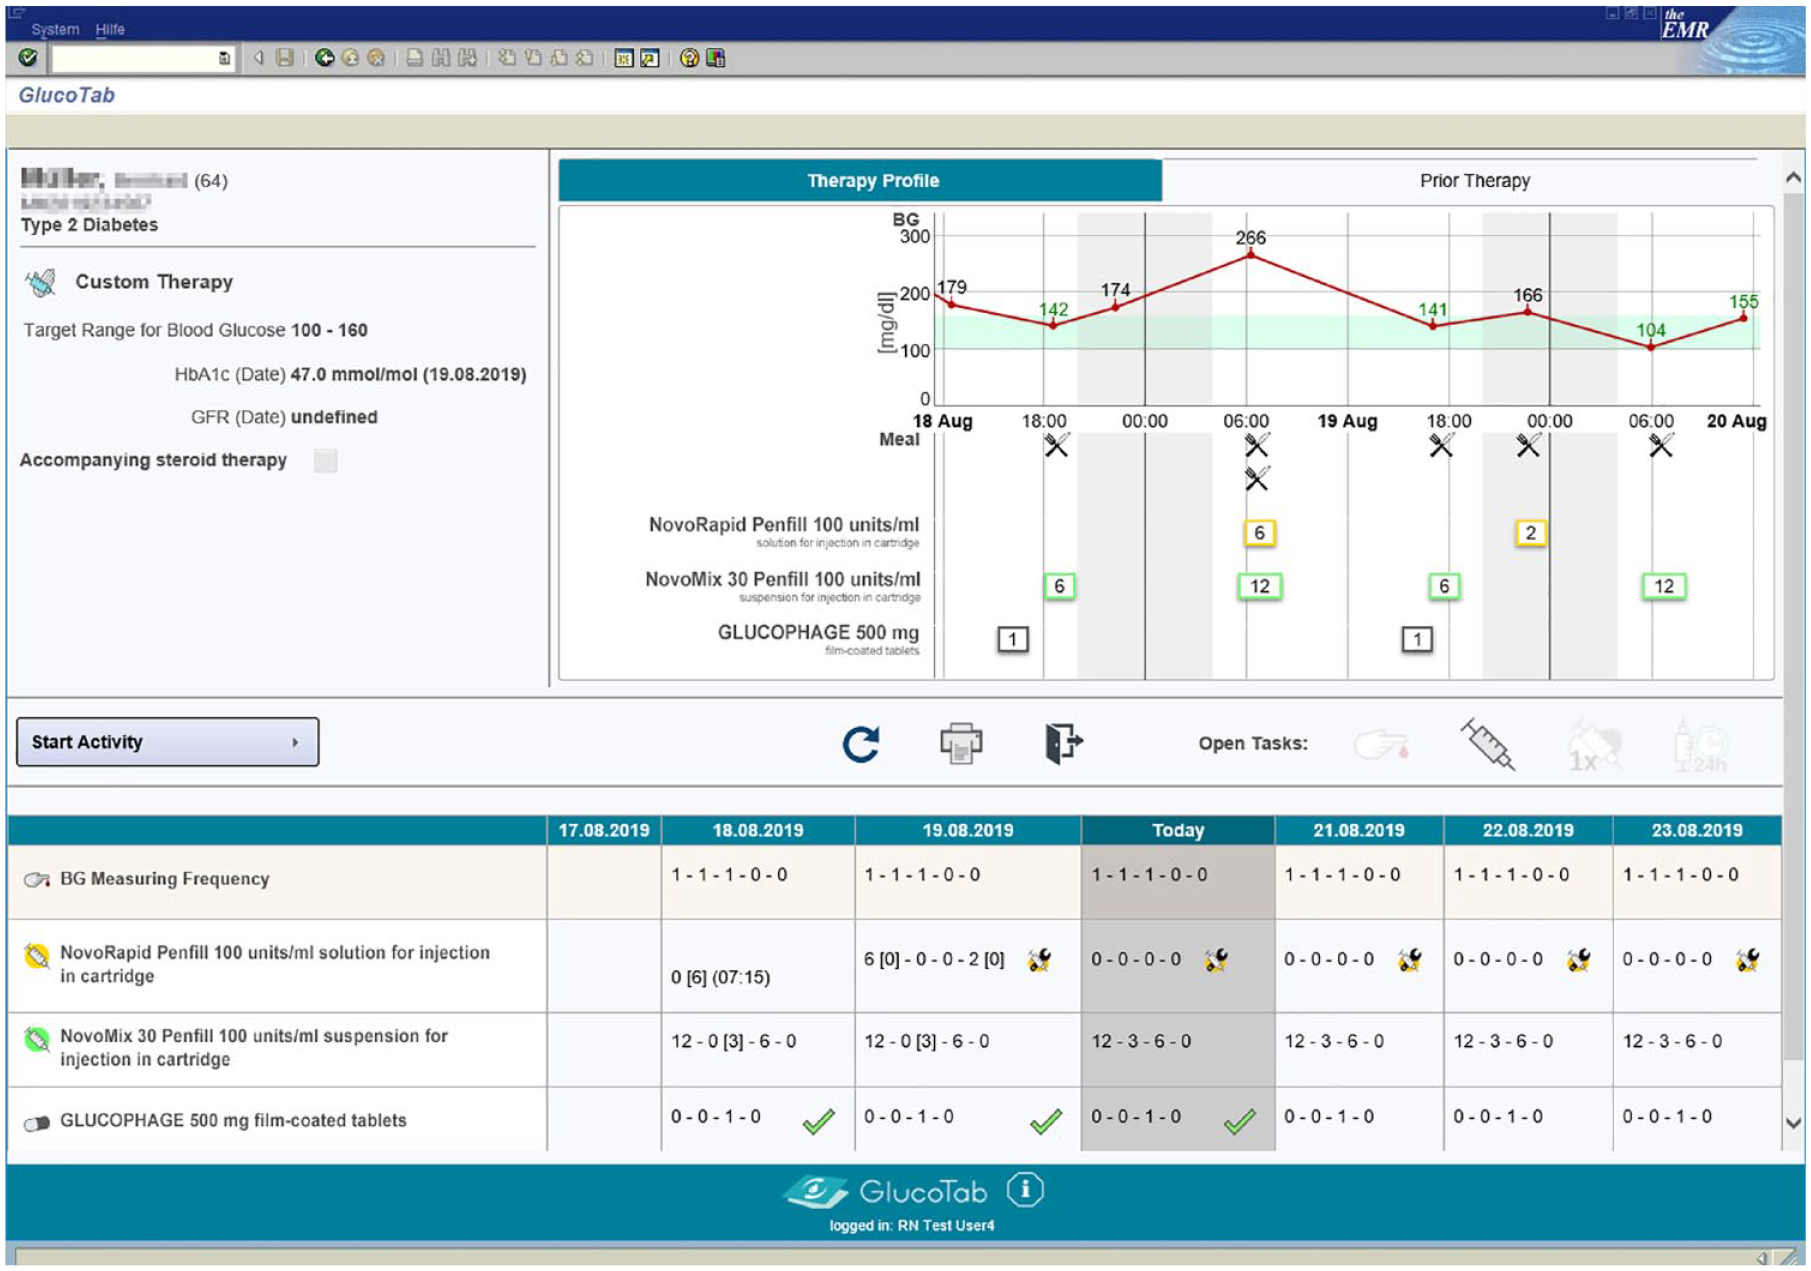
Screenshot of the eDMS course of therapy view embedded in the electronic medical record on a desktop PC or laptop. Abbreviation: eDMS, electronic diabetes management system.
Data Collection
We used a before-after study design to compare the quality of diabetes management using the paper chart (before, 2015-2016, n = 106) and the newly implemented eDMS (after, 2017-2018, n = 241). Patient data were obtained retrospectively from the following different sources: electronic medical record including paper charts, eDMS documentation, hospital information system, and laboratory information system.
Desk research was used to evaluate the documentation possibilities by comparing the blank paper chart with the user interface of the eDMS regarding options for documentation of BG management. The evaluation was based on known quality indicators.6,7,9,16,17 Further quality aspects were evaluated by assessing data from the filled-in paper charts vs the filled-in eDMS documentation. The evaluations were based on the methodology of the National Diabetes Inpatient Audit. 17 In addition, HCPs were first interviewed regarding satisfaction with the paper chart using semi-standardized guidelines before eDMS implementation. Second, HCPs who were working with the eDMS were asked to complete a questionnaire (see Supplemental Appendix S1, six-point Likert scale) regarding satisfaction with the eDMS after 4 to 13 months of eDMS use. Third, HCPs were asked qualitative questions during phone interviews about efficiency (including time savings through the eDMS use) at follow-up.
Endpoints
The following endpoints were defined before study start: the primary endpoint “good diabetes days” for the hospital stay scaled to seven days (days on which the BG measurement frequency is appropriate and at most one value >198 mg/dL and no value <72 mg/dL) was calculated similar to NDIA 2016 17 for inpatients who received insulin on more than 80% of the treatment days. BG measurement frequency was regarded appropriate, when two or more BG values were measured per day for patients with insulin therapy (all insulin therapies except basal bolus) and when four or more BG values were measured per day for patients with basal-bolus insulin therapy.
Secondary endpoints regarding chart documentation possibilities included: documentation possibilities for time points, therapy prescription and administration (insulin and other antidiabetic medication), pre-existing diabetes therapy, BG measurement frequency, BG targets, hypoglycemia thresholds and hypoglycemia therapy, patient identification, HbA1c, BG values per day, diabetes type, and correction scheme. Secondary endpoints regarding further quality aspects included: predominant diabetes therapy during hospital stay, BG measurements, daily BG, BG values in different ranges, daytimes when hypoglycemia occurred, administered insulin dose, therapy changes, prescribed correction scheme, documentation quality, and user satisfaction with eDMS.
Data Management
Collected data were added to an electronic data management system (OpenClinica). All data entered were checked for plausibility, duplicate entries were removed, and open/unclear points were clarified. All collected patient-related data were pseudonymized with nontraceable ID numbers following data protection guidelines and standard operating procedures. Interviews were recorded electronically and were transcribed later. To ensure that the interviewers had drawn the correct conclusions, to eliminate any misunderstandings in the data collection, and to increase the intersubjective traceability, the participants reviewed the transcript and signed it. Data collected from the interviews were evaluated using the Mayring qualitative content analysis. 18 Data collected from questionnaires had already been anonymized when questionnaires were filled in. Questionnaire data were collected with the EvaSys software (version no. V7.1 19 ). Qualitative phone interviews were recorded electronically with permission and written down afterward.
Statistical Analysis
Sample size was calculated based on the “percentage of good diabetes days per patient” (primary endpoint). For patients treated with the eDMS system, it was assumed that an average of 60% ± 25% (mean ± standard deviation [SD]) of study days would be “good diabetes days.” In contrast, for patients treated using paper chart we assumed 50% ± 25% (mean ± SD) based on the results of previous studies.14,20 The SD in both groups (paper chart, eDMS) was set to 25%. Standard values were used for alpha and beta errors: alpha = 0.05 and beta = 0.2. In order to demonstrate an effect with an alpha error of 5% and a power of 80% (=beta error of 20%), a total of 200 participants were required.
As far as possible and reasonable, data were compared before and after the implementation using descriptive and inferential statistics. The significance level was set to 0.05 in all tests. Median is presented with min-max, mean ± SD. The data analysis was carried out using the statistical software SAS 9.4.
Results
Documentation Possibilities on Blank Paper Chart vs eDMS User Interface
The eDMS offered more structured and comprehensive documentation possibilities compared with the blank paper chart. The eDMS had more flexible documentation of time points for therapy prescription and administration compared with predefined daytimes on the paper chart. Fields for prescription and administration were not always filled-in correctly on the paper chart. In contrast, the eDMS had clearly separated displays for prescription and administration and provided dedicated functionality for these operations, with access control based on HCPs’ user roles. The eDMS had more options to document pre-existing diabetes therapy, BG measurement frequency, BG targets as well as hypoglycemia thresholds and hypoglycemia therapy, none of which had a designated field on the paper chart. Both documentation types provided the possibility to document patient identification, HbA1c as well as BG values per day. No documentation possibility with regard to diabetes type was present on the paper chart, whereas the eDMS offered two possibilities for documentation: “diabetes type 2” and “other diabetes type.” Other antidiabetic medications and insulin therapy could be documented in both documentation types; however, if insulin therapy was adjusted frequently, the paper chart did not offer enough space. A correction scheme with implemented hyperglycemia thresholds for elevated BG levels could only be ordered on the eDMS.
Glycemic Management and Documentation Quality of Filled-In Paper Charts vs eDMS Documentation
Overall, the number of good diabetes days had a median value of 4.4 days (0-7 days, min-max) in both groups, before and after the implementation of the eDMS.
Predominant diabetes therapy during hospital stay differed: 52% of patients treated using the paper chart were on premixed insulin and 26% of patients treated using eDMS were on basal insulin therapy only, followed by 25% on premixed insulin. Further therapy details are listed in Table 2. In the eDMS group, a total of seven patients were treated using the eDMS BBT algorithm provided by the eDMS, with a treatment duration between 13% and 75% of inpatient stay days. The patients of both groups had a median of 1 (0-6) (paper chart) vs 2 (0-6) (eDMS) treatment changes during their inpatient stay. Median daily insulin dose per subject was 18 (3-85) IU vs 17 (3-110) IU. Three vs 19 patients had a correction scheme prescribed. Patients treated using the paper chart and patients treated using the eDMS had a median value of 0.8 (0.5-0.8) and 3.5 (0.4-19.8) prescribed days with a correction scheme, respectively.
Quality Features of Glycemic Management With Paper Chart vs eDMS (n [%], median [minimum-maximum]).
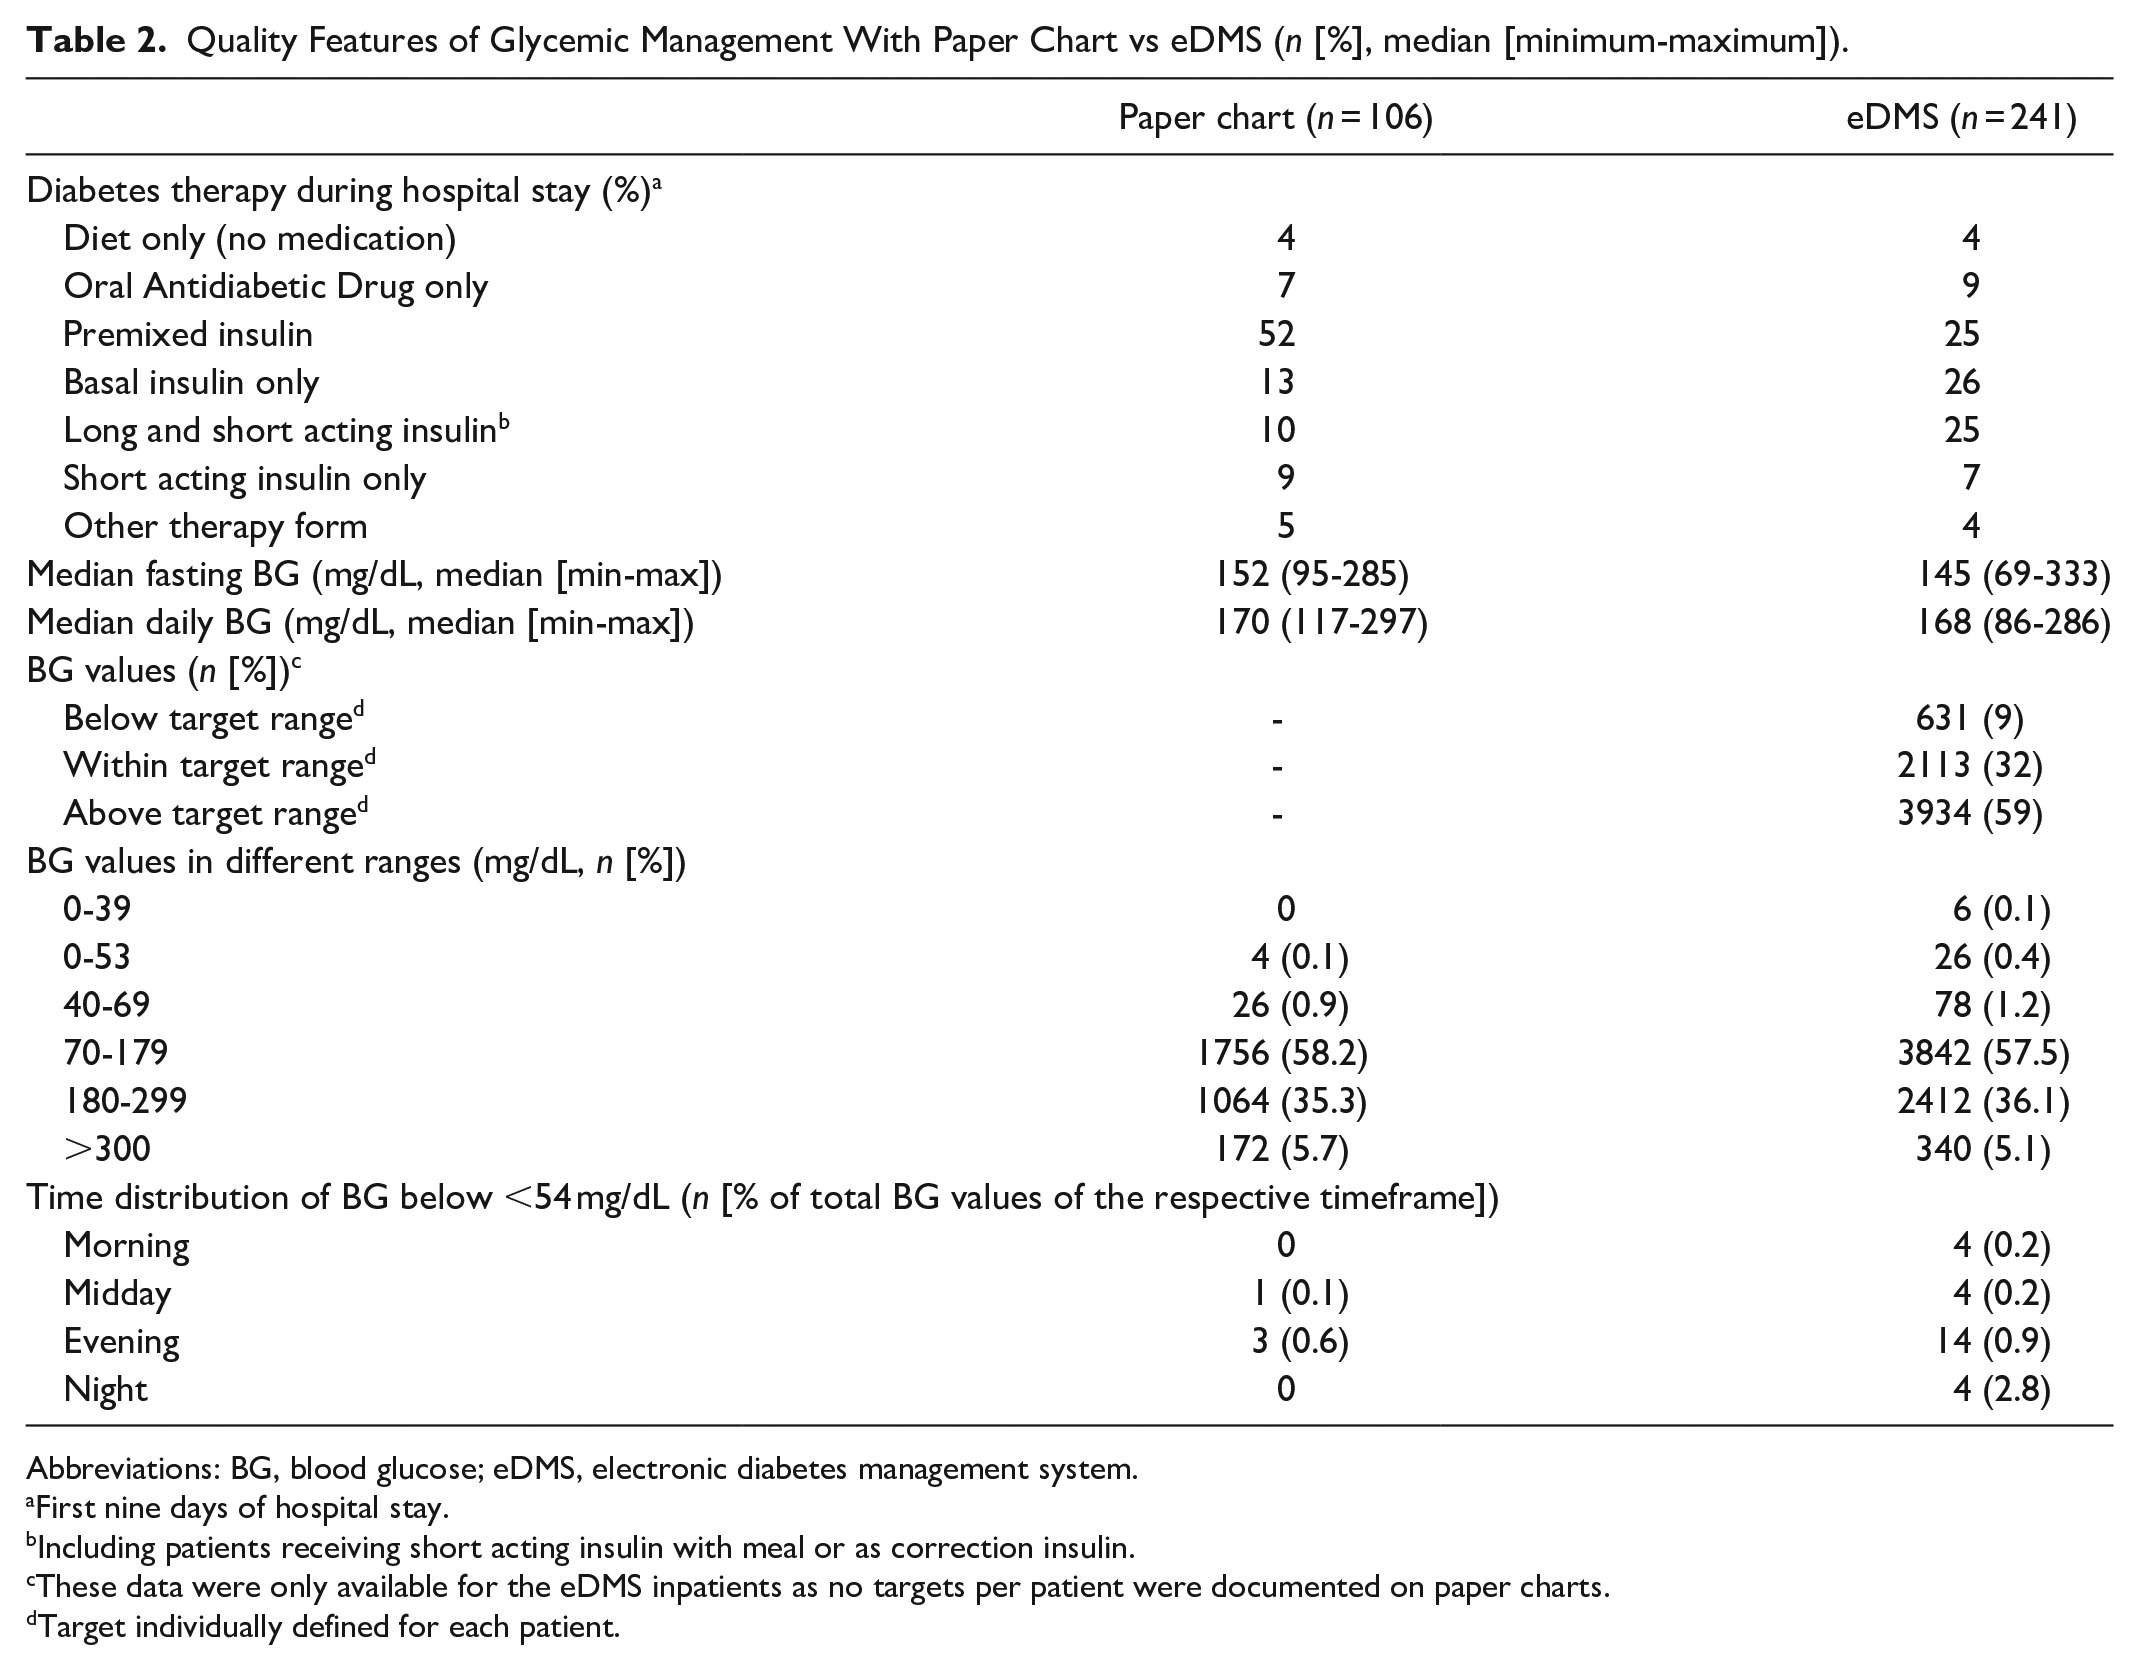
Abbreviations: BG, blood glucose; eDMS, electronic diabetes management system.
First nine days of hospital stay.
Including patients receiving short acting insulin with meal or as correction insulin.
These data were only available for the eDMS inpatients as no targets per patient were documented on paper charts.
Target individually defined for each patient.
The total number of BG measurements was 3018 before vs 6678 after eDMS implementation. Median daily BG was 170 (117-297) mg/dL vs 168 (86-286) mg/dL and median fasting BG was 152 (95-285) mg/dL vs 145 (69-333) mg/dL. BG values below, within, and above the target range, which is individually defined in the routine treatment of each patient, occurred in 9%, 32%, and 59%, respectively, when documented in the eDMS. The amount of BG values in different ranges was similar in both groups (paper chart vs eDMS): 0.9% vs 1.3% in range 0-69 mg/dL, 58.2% vs 57.5% in range 70-179 mg/dL, 35.3% vs 36.1% in range 180-299 mg/dL, and 5.7% vs 5.1% in range ≥300 mg/dL. A total of 0.1% vs 0.4% of BG values <54 mg/dL were documented which were detected most commonly in the evening. Overall, six severe hypoglycemic events <40 mg/dL occurred in the eDMS group, whereas no BG value <40 mg/dL was observed in the paper chart group. None of the hypoglycemic events ≤40 mg/dL had occurred using eDMS BBT with decision support, rather the suspected reasons included clinical status of the inpatients (Table 2).
Diabetes documentation was filled-in more frequently when the eDMS was used: diabetes type (0% vs 100%), pre-existing diabetes therapy (52% vs 93%), ordered BG measurement frequency (1% vs 100%), BG target range (0% vs 100%), and correction scheme (1% vs 8%) were documented more often on eDMS compared to paper charts. Patient identification was correctly documented on paper chart and eDMS documentation (100% vs 100%), and HbA1c was documented more often on paper charts (93% vs 81%) (Table 3).
Quality of Diabetes Documentation (n [%]).
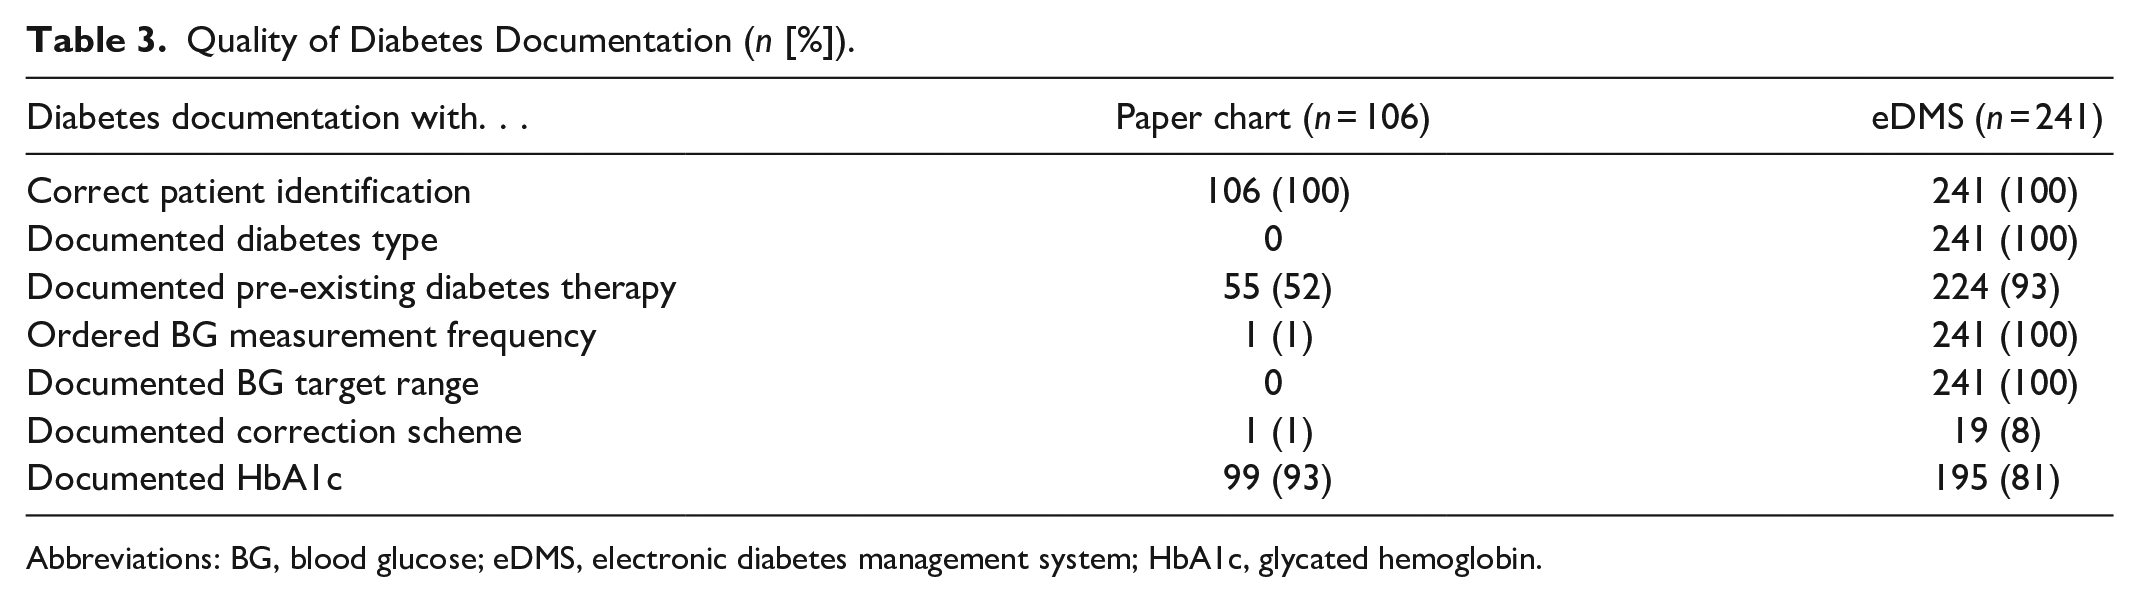
Abbreviations: BG, blood glucose; eDMS, electronic diabetes management system; HbA1c, glycated hemoglobin.
Perception and Satisfaction With the Paper Chart and the eDMS by HCPs
Before eDMS implementation, 12 HCPs (2 physicians, 6 nurses, and 4 nursing assistants) were interviewed regarding satisfaction with the paper chart. In general, HCPs were satisfied regarding previous diabetes management documentation, but HCPs stated their request for an electronic documentation system. Declared challenges in diabetes management included, for example, that the average time between BG measurements until insulin injection takes a long time (up to two hours), that diabetes therapy is adjusted for every single BG level, that frequent insulin therapy adjustments make patients feel uncertain, and that Oral Antidiabetic Drug (OADs) are not dispensed because prescription is on second page.
Overall, 59 HCPs completed the questionnaire (16 physicians, 40 nurses, and 3 not specified) and reported consistently positive user satisfaction regarding the eDMS (for complete questionnaire results, see Supplemental Appendix S2). HCPs felt safe when using the eDMS (77%) and most of the HCPs (76%) stated that technical support was rarely needed. HCPs stated that the use of the eDMS could prevent errors (74%), digital support of work processes was completed (77%), and the need for consultation of diabetes experts was reduced (73%). Seventy-seven percent of HCPs stated that correct administration of the prescribed insulin dose was easier using the eDMS compared to the paper chart. Further, 63% of HCPs indicated that individual diabetes management was performed more efficiently by using the eDMS.
Additionally, the same HCPs (two physicians, five qualified nurses, four nursing assistants, and one nurse were lost at follow-up) who were interviewed before eDMS implementation were interviewed with qualitative questions by phone at follow-up again. Concerning time saving through eDMS use, eight HCPs stated time savings, three HCPs stated no time saving, whereby one HCP stated that he/she had rarely worked with the eDMS. Time savings were defined as follows during the qualitative phone interviews by HCPs: 10 minutes per patient per day (n = 1), 10 minutes per day (n = 1), 15 minutes (n = 1), no time specification (n = 2), time saving for physicians, not for nurses (n = 1), 50% time saving with waiting time (n = 1), and time expenditure has been halved (n = 1).
Discussion
The eDMS was able to completely replace the paper chart and led to quality improvements compared with the paper chart. The user interface of the eDMS offered more structured and comprehensive documentation possibilities compared with the paper chart. The eDMS provided a high level of traceability due to mandatory HCP user authentication and separate display of insulin prescription and administration, whereas traceability was limited on paper charts. Further, evidence-based elements for diabetes management were displayed and visual reminders for open tasks were provided by the eDMS. As recommended by current guidelines,1,2 the eDMS offered standardized documentation for inpatient diabetes management. Chart documentation possibilities were improved compared with the paper chart. It can be assumed that similar to a study that evaluated paper charts, structural features have an impact on documentation and treatment quality. 21 One quality aspect of the diabetes management process is the degree of complete documentation which was higher with the eDMS.
The mean number of good diabetes days per week was similar for the paper chart and eDMS groups (on average four good diabetes days in each group). This result agrees with an evaluation of paper charts at the University Hospital Graz where on average 4 ± 3 good diabetes days were observed 21 and the average number of three good diabetes days per week reported by the National Diabetes Inpatient Audit from England and Wales. 4 No significant differences were detected regarding glycemic control between the paper chart and the eDMS. The predominant diabetes therapy during inpatient stay differed between the paper chart and eDMS group: in the paper chart group, patients primarily received premixed insulin during hospitalization, whereas the eDMS group primarily received basal insulin only, followed by premixed insulin.
Despite its general availability, the eDMS’s BBT algorithm was not focus in this study. Only seven patients received basal-bolus insulin therapy according to the eDMS BBT algorithm during their inpatient stay. There are several reasons why the eDMS BBT algorithm was used less than expected: First, the hospital’s main interest was to replace the paper chart and to investigate practicability of the extended features for documentation and workflow support. Second, the initially infrequent use of the eDMS BBT algorithm could be related to the introduction of a novel technology and HCPs might have been hesitant to change too many processes at a time. Third, patients with no relevant hyperglycemia at admission received their pre-existing diabetes therapy as recommended by the Austrian national guidelines for inpatient diabetes management. And fourth, the eDMS BBT algorithm was not the preferred treatment option for geriatric patients with relaxed glycemic target ranges.1,2,22 The eDMS BBT algorithm has already shown its capacity to improve glycemic control by significantly increasing the number of BG values in the target range (100-140 mg/dL) as compared to standard diabetes management in several clinical trials.12-15 Future analyses will assess whether the increased use of the eDMS BBT algorithm at Hospital Hartberg will support these findings.
HCPs were very satisfied with the eDMS that replaced the paper chart. HCPs stated that they felt safe to use the eDMS, rarely needed technical support, and that the functions of the eDMS fully reflected the actual processes of inpatient diabetes management. These results on user satisfaction are comparable with previous clinical studies with the eDMS.12-15 No additional workload for documentation was reported. Some HCPs even indicated increased efficiency with estimated time savings of 10-15 minutes per patient day. We thus assume that implementing the eDMS on a broader scale will improve not only treatment quality and patient safety but also lead to more effective use of resources.
Conclusion
In conclusion, the eDMS integrated into the hospital electronic medical record was able to provide a complete digital replacement of the paper chart and was very well received by HCPs in routine inpatient diabetes management. The eDMS now can be widely made available in hospitals and further rollout has already been started. Already available eDMS functions for algorithm driven therapy were not in the focus of this study and will now be further extended and promoted to leverage their already demonstrated effects on BG control.
Supplemental Material
Appendix_1_questionaire_page_1 – Supplemental material for Electronic Diabetes Management System Replaces Paper Insulin Chart: Improved Quality in Diabetes Inpatient Care Processes Due to Digitalization
Supplemental material, Appendix_1_questionaire_page_1 for Electronic Diabetes Management System Replaces Paper Insulin Chart: Improved Quality in Diabetes Inpatient Care Processes Due to Digitalization by Julia Kopanz, Katharina M. Lichtenegger, Constanze Koenig, Angela Libiseller, Julia K. Mader, Klaus Donsa, Thomas Truskaller, Norbert Bauer, Brigitte Hahn, Gerald Sendlhofer, Peter Beck, Bernhard Höll, Frank Sinner, Franz Feichtner and Thomas R. Pieber in Journal of Diabetes Science and Technology
Supplemental Material
Appendix_1_questionaire_page_2 – Supplemental material for Electronic Diabetes Management System Replaces Paper Insulin Chart: Improved Quality in Diabetes Inpatient Care Processes Due to Digitalization
Supplemental material, Appendix_1_questionaire_page_2 for Electronic Diabetes Management System Replaces Paper Insulin Chart: Improved Quality in Diabetes Inpatient Care Processes Due to Digitalization by Julia Kopanz, Katharina M. Lichtenegger, Constanze Koenig, Angela Libiseller, Julia K. Mader, Klaus Donsa, Thomas Truskaller, Norbert Bauer, Brigitte Hahn, Gerald Sendlhofer, Peter Beck, Bernhard Höll, Frank Sinner, Franz Feichtner and Thomas R. Pieber in Journal of Diabetes Science and Technology
Supplemental Material
Appendix_1_questionaire_page_3 – Supplemental material for Electronic Diabetes Management System Replaces Paper Insulin Chart: Improved Quality in Diabetes Inpatient Care Processes Due to Digitalization
Supplemental material, Appendix_1_questionaire_page_3 for Electronic Diabetes Management System Replaces Paper Insulin Chart: Improved Quality in Diabetes Inpatient Care Processes Due to Digitalization by Julia Kopanz, Katharina M. Lichtenegger, Constanze Koenig, Angela Libiseller, Julia K. Mader, Klaus Donsa, Thomas Truskaller, Norbert Bauer, Brigitte Hahn, Gerald Sendlhofer, Peter Beck, Bernhard Höll, Frank Sinner, Franz Feichtner and Thomas R. Pieber in Journal of Diabetes Science and Technology
Supplemental Material
Appendix_2_Evaluation_GlucoTab_LKH-Hartberg_English – Supplemental material for Electronic Diabetes Management System Replaces Paper Insulin Chart: Improved Quality in Diabetes Inpatient Care Processes Due to Digitalization
Supplemental material, Appendix_2_Evaluation_GlucoTab_LKH-Hartberg_English for Electronic Diabetes Management System Replaces Paper Insulin Chart: Improved Quality in Diabetes Inpatient Care Processes Due to Digitalization by Julia Kopanz, Katharina M. Lichtenegger, Constanze Koenig, Angela Libiseller, Julia K. Mader, Klaus Donsa, Thomas Truskaller, Norbert Bauer, Brigitte Hahn, Gerald Sendlhofer, Peter Beck, Bernhard Höll, Frank Sinner, Franz Feichtner and Thomas R. Pieber in Journal of Diabetes Science and Technology
Footnotes
Acknowledgements
The authors acknowledge the critical review of the manuscript and the editorial assistance of S. Mautner (Medical University of Graz); technical implementation of J. Rodriguez, V. Grogger, and M. Rabl, B. Wenk (KAGes); data management of C. Krainer (Joanneum Research GmbH) and L. Jantscher (KAGes); and statistical analysis of B. Lackner (Joanneum Research GmbH). The authors thank all involved healthcare professionals of the LKH Hartberg for their contribution in eDMS implementation.
Author Contributions
JK, KML, CK, AL, JKM, KD, TT, NB, BH, GS, PB, and BH designed the study, interpreted data, and contributed to discussions. JK and KML drafted the manuscript. FF, FS, and TRP interpreted data, contributed to discussions, supervised the project, and are the guarantors of this work. All authors critically revised the article and approved the final version of the manuscript.
Declaration of Conflicting Interests
The author(s) declared the following potential conflicts of interest with respect to the research, authorship, and/or publication of this article: JKM, KD, FS, PB, and TRP are shareholders of decide Clinical Software Ltd. JKM is a member in the advisory board of Becton Dickinson Diabetes Care, Boehringer Ingelheim, Eli Lilly, Medtronic, Prediktor A/S, Roche Diabetes Care, and Sanofi-Aventis and received speaker honoraria from Abbott Diabetes Care, Astra Zeneca, Dexcom, Eli Lilly, NovoNordisk A/S, Roche Diabetes Care, Servier, and Takeda. TRP is a member in the advisory board of Arecor, Novo Nordisk, Sanofi, Astra-Zeneca, and Adocia and received speaker honoraria from Novo Nordisk. All other authors have no potential conflicts of interest to declare.
Funding
The author(s) disclosed receipt of the following financial support for the research, authorship, and/or publication of this article: This work was supported by the Gesundheitsfonds Steiermark (Grant number 30.00-2/2016-15).
Prior Presentation of Data
Parts of this study were presented at the Congress of the German Diabetes Federation (2019, Berlin, Germany), the Annual Meeting of the European Association for the Study of Diabetes (2019, Barcelona, Spain), the Annual Meeting of the Austrian Diabetes Federation (2019, Salzburg, Austria), and the International Conference on Advanced Technologies and Treatments for Diabetes (2020, Madrid, Spain).
Supplemental Material
Supplemental material for this article is available online.
References
Supplementary Material
Please find the following supplemental material available below.
For Open Access articles published under a Creative Commons License, all supplemental material carries the same license as the article it is associated with.
For non-Open Access articles published, all supplemental material carries a non-exclusive license, and permission requests for re-use of supplemental material or any part of supplemental material shall be sent directly to the copyright owner as specified in the copyright notice associated with the article.