
Abstract
Background:
A wide range of optical techniques has recently been presented for the development of noninvasive methods for blood glucose sensing based on multivariate skin spectrum analysis, and most recent studies are reviewed in short by us. The vibrational spectral fingerprints of glucose, as especially found in the mid-infrared or Raman spectrum, have been suggested for achieving largest selectivity for the development of noninvasive blood glucose methods.
Methods:
Here, the different aspects on integral skin measurements are presented, which are much dependent on the absorption characteristics of water as the main skin constituent. In particular, different mid-infrared measurement techniques as realized recently are discussed. The limitations of the use of the attenuated total reflection technique in particular are elaborated, and confounding skin or saliva spectral features are illustrated and discussed in the light of recently published works, claiming that the attenuated total reflection technique can be utilized for noninvasive measurements.
Results:
It will be shown that the penetration depth of the infrared radiation with wavelengths around 10 µm is the essential parameter, which can be modulated by different measurement techniques as with photothermal or diffuse reflection. However, the law of physics is limiting the option of using the attenuated total reflection technique with waveguides from diamond or similar optical materials.
Conclusions:
There are confounding features from mucosa, stratum corneum, or saliva, which have been misinterpreted for glucose measurements. Results of an earlier study with multivariate evaluation based on glucose fingerprint features are again referred to as a negative experimental proof.
Keywords
Introduction
In recent years, a wide range of optical techniques have been published for the development of noninvasive methods for glucose sensing based on spectral skin analysis. Vibrational spectroscopy, comprised of either mid- infrared (IR) and near-infrared (NIR) or Raman spectroscopy, is one of the most promising technologies when it comes to noninvasive identification and quantification of glucose in blood and interstitial fluid. Different frequencies of the electromagnetic radiation effect the excitation of characteristic vibrations, uniquely assignable to the glucose molecules. 1 In this study, our focus is on the mid-IR spectral range, especially on the limitations of the attenuated total reflection (ATR) technique for in vivo skin measurements. However, an overview with relevant literature about closely related vibrational spectroscopic techniques is included.
Due to lower molecular absorptivities in the NIR electromagnetic spectrum between 800 and 2500 nm, intrinsic to overtone and combination bands, penetration depth into the skin dermis is possible, and can therefore provide information from integral tissue measurements, probing also molecular composition information from interstitial fluid and vascular blood. The key challenge here is the extraction of weak specific glucose signatures from the variable background of broad overlapping vibrational bands of water and other chromophores in skin tissue. There are many publications with utilization of short- and long-wave NIR radiation, with even more sophisticated approaches by photoplethysmography for sensing the arterial vascular compartment for approaching the ultimate goal of noninvasive blood analysis by avoiding integral skin probing with different tissue compartments. However, we refer to our recent two reviews that summarized the state of the art,2,3 as well as to another review by Yadav et al. 4
Another vibrational spectroscopic approach, advantageously less affected by water interferences, is Raman spectroscopy, often complementary to IR spectroscopy. However, it is based on the interaction of visible and short-wave near IR laser radiation with high penetration depth into skin, revealing another chemical fingerprint of the target analyte. Critical drawbacks in Raman spectroscopy of skin tissue are weak glucose-related Raman cross-sections as well as skin-related changing autofluorescence and a strong spectral noise. The literature up to 2018 has recently been reviewed by Pandey et al., 5 as well as by us. 2 Developments are fast, and promising results were presented by Kang et al., overcoming issues with noisy glucose signatures. In their work, an 830 nm diode laser was used for the illumination of the skin site with a power of 250 mW. For collection of the Raman backscattered photons, a noncontact multifiber optical bundle with an attached filter for the exclusion of Rayleigh scatter was waveguiding to a charge-coupled device detector. For the analysis of glucose concentrations in skin, three distinct bands were chosen after spectral pretreatment. This work demonstrates a first linear dependency between subcutaneous glucose concentrations and associated Raman peaks. 6 For a significant improvement in measuring blood glucose instead of interstitial fluid noninvasively, Li et al. suggested a method that uses a laser for focusing on blood microvessels in the human nail fold. The chosen skin site is characterized by thin stratum corneum and epidermis layers, leading to good transmittance into the microvessel within dermal tissue, found at a depth of about 100 µm. Glucose quantification was possible after sophisticated chemometrics including principal component analysis and a back propagation artificial neural network. 7 Raman spectroscopic uncertainties as obviating accurate glucose determinations that result from changes in environmental or sample conditions require robust nonlinear multivariate data analysis models, such as least squares support vector machine algorithms, showing improved results when compared to conventional regression models. 8
Mid-IR radiation in the wavelength range between 2500 nm and 25 µm (in wavenumbers 4000-400 cm−1) shows highest selectivity when it comes to small analyte concentrations in complex organic matrices due to the detection of fundamental vibrations, resulting in a specific fingerprint spectrum. 2 However, most approaches using mid-IR radiation are limited by the strong absorptivity of water in biological tissue, leading to only small penetration depths of photons with radiation focused into skin. Diffuse reflection spectroscopy can access glucose molecules from the epidermis layer, whereas photoacoustic or photothermal detection can provide information even from a depth of 20-100 µm. 9 In view of the possible penetration depths, an extensive study by Petrich et al. revealed the optical constants of skin (here: porcine dermis), showing only a very low percentage in backscattered photons with an upper fraction limit of 10−4 from within a depth of only ~10 µm. These results were obtained by Monte Carlo simulation of radiation transport within turbid media and accounted for by high absorption, as well as by predominantly forward scattering photons. 10
Recent mid-IR developments were presented by Werth et al., 11 using an external cavity quantum cascade laser (EC-QCL) as radiation source and either an integrating sphere or a bundle of optical fibers for the collection of backscattered photons from the skin. An advantage has been the implementation of a pulsed quantum cascade laser, providing high peak power and therefore the probing of glucose-relevant information from deeper skin layers that were previously considered undetectable. 12 A noninvasive photoacoustic spectroscopy setup has been developed by Kottmann et al. 13 Mäntele et al. developed photoacoustic and photothermal detection approaches for in vivo skin spectroscopy, using a fast tunable EC-QCL for reaching epidermal skin layers (a contribution from this researcher team is available in this special issue). A windowless photoacoustic setup enabled for reproducible epidermal measurements by avoiding skin contact, which would increase the stratum corneum humidity content, as well as minimizing the influence of changing temperature and pressure effects. Different skin sites were tested, prioritizing the thumb as well-suited location.9,14,15 Meanwhile, we became aware of a review summarizing the development of the use of mid-IR QCLs for in vitro and in vivo glucose measurements, including a noncritical assessment of ATR measurements for a noninvasive glucose assay using human lip tissue. 16
Mid-IR spectroscopy using the ATR technique has been very successful for the quantitative analysis of body fluids such as whole blood, plasma, and serum, as it can provide small transmission equivalent layer thicknesses coping with the strong water absorptivities. While ATR spectroscopy is physically unable to provide any information about the chemical composition of skin layers deeper than less the radiation wavelength, it has been claimed recently as another option for a noninvasive blood glucose assay.17-21 In this article, the physical limitations are explained in detail and spectroscopic challenges are discussed by providing also earlier practical results from a noninvasive ATR analysis of oral mucosa and saliva with several oral glucose tolerance tests. 22 In general, all mentioned vibrational spectroscopic techniques enable a noninvasive multicomponent analysis without the need of any chemical skin pretreatment with exception of utilizing the mid-IR ATR technique as explicated in the following.
Methods
IR spectra were recorded from various human skin sites, from oral mucosa, saliva, and aqueous glucose solutions. For the recording of ATR spectra, different fiber-optic probes were used. The probes allow for remote sensing and were constructed with silver halide fiber waveguides each, transporting the IR radiation from the interferometer via an off-axis paraboloidal mirror to the diamond prism or a U-bent fiber section as the probe head (see Figure 1) and then back to a liquid nitrogen-cooled mercury cadmium telluride (MCT) photodetector. The diamond prism acts as a retroreflector and allows a two-fold reflection with evanescent waves within the sample.
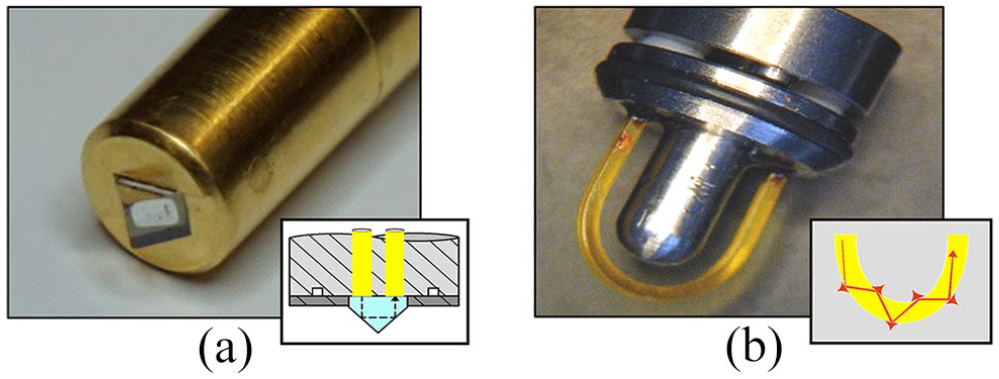
(a) Close-up on the fiber-optical probe head with the embedded diamond prism and silver halide fibers for waveguiding. The schematic diagram provides insight into the ATR measurement principle; (b) photo of the fiber-only probe head with a U-shaped fiber element for reproducible skin surface measurements with schematics for evanescent wave sensing. All fiber-optical probes were assembled at infrared fiber sensors (Aachen, Germany). ATR, attenuated total reflection.
For the second fiber-optic probe, a fiber-only geometry had been chosen for evanescent wave spectroscopy. The transmitting and receiving fibers were extruded with a square cross-section of 750 μm × 750 μm and a numerical aperture of 0.5. The shaft length was 20 cm (12 mm diameter) and had means for attaching detachable short U-shaped silver halide fiber pieces for ATR measurements. The sensitivity of the ATR element depends on the length and the bending radius of the silver halide fiber piece, which is in contact with the sample medium. The maximum sensitivity is reached at the proximal end of the U-shaped fiber piece (here a bending radius of 4 mm; see Figure 1b). The receiving fiber was directly coupled to a liquid nitrogen-cooled semi-conductive MCT detector. Peek tubes are encasing the waveguiding fibers, while the square cross-section fibers are even avoiding any ATR absorption along the fiber waveguides. For assessing the sensitivity of the ATR measurements, also experiments with a 30 µm transmission cell, assembled with two CaF2 windows in a custom-made cuvette of 0.6 µL internal volume, were performed.
All spectra were recorded in the wavenumber range of 4000-500 cm−1 with a spectral resolution of 4 or 8 cm−1 and the apodization was a Blackman-Harris three-term function applied to the coadded interferograms. The Fourier-transform infrared (FTIR) spectrometer (Bruker, Ettlingen, Germany) was controlled by the OPUS Software.
For skin measurements, tape stripping by means of adhesive film (TESA film No. 4204, BDF Beiersdorf AG, Hamburg, Germany) was used to study the skin horny layer of test persons. Before tape stripping, the skin had been cleansed with soft tissues and various agents such as detergents or ethanol to remove loose particles and sebum. Anatomical details are given by two microtomed biopsies from the outer lip with a rather small stratum corneum layer and from oral mucosa, which has been repeatedly suggested for noninvasive glucose measurements, in particular when the ATR technique is employed (see Figure 2).
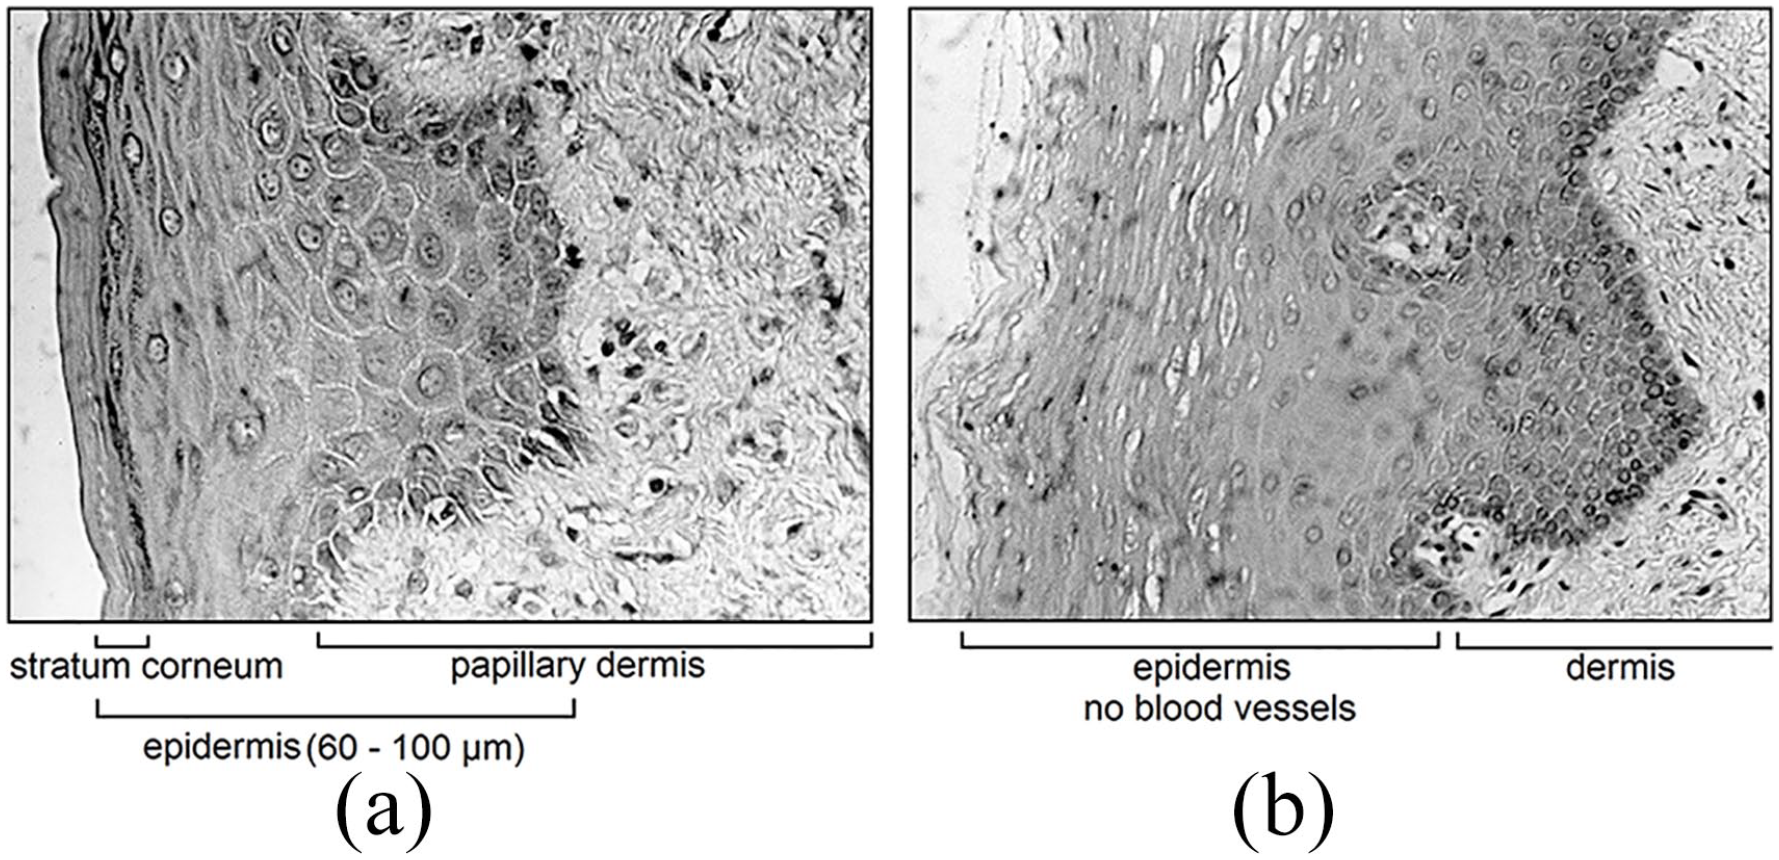
(a) Microscopic cross-sections of surface skin tissue from the outer lip; (b) epidermal oral mucosa from the inner lip with blood vascular information.
Results and Discussion
In the following, the physical background of IR spectroscopic measurements is given for using the ATR technique. For the analysis of aqueous biofluids, water compatible materials such as optically dense crystals of zinc selenide (ZnSe), germanium, diamond, and others are necessary for providing IR spectra similar to standard transmission measurements. The ATR technique was developed by Harrick 23 and Fahrenfort, 24 which had been successfully utilized for the early analysis of glucose in plasma and whole blood.25,26 Inner lip mucosa tissue has attracted many researchers for drug delivery and metabolite monitoring and in early papers from Shichiri and coworkers, the possibility of a noninvasive blood glucose measurement via oral mucosa had been investigated.27,28 This section deals with theoretical estimates, simulations, and further practical measurements concerning ATR penetration depth within the mid-IR spectral range, followed by listing spectral interferences from confounding factors with a final conclusion about the limitations of the ATR technique including some histological aspects of skin structure, in particular of inner lip tissue.
Theoretical Background
For elucidating the physical principles of ATR spectroscopy, the following case is illustrated. Snell’s law describes a physical interface phenomenon between two IR-transparent media of different refractive indices. For the calculation of the angle of refraction, the following equation can be applied:

Here, n1 describes the refractive index of the so-called internal reflection element (waveguide) and n2 that of the sample. For the observation of total reflection at the element/sample interface, the requirement n1 > n2 must be valid with the incident angle of the electromagnetic beam exceeding the critical angle, described as:
When facing absorption by the sample, described by the complex refractive index (

where
The depth, for which the intensity of the square evanescent field decays to a value of 0.25%, may be called “working depth,” defined by the threefold of the penetration depth dp. Based on measurements at different reflection angles,
30
or using an approach with multiple wavelengths,
31
a determination of depth-dependent gradients in complex layers can be realized. Finally, the relation between single and multiple reflections (

Usually, the sensitivity of ATR absorption measurements can be estimated by the so-called transmission equivalent thickness by recording sample spectra with a transmission cell of defined pathlength and the ATR element under investigation. This will be discussed later especially for the fiber-coupled diamond prism. In Figure 3, the calculated penetration depths for radiation at 1000 cm−1 into oral mucosa and the according Fresnel reflectances Rs and Rp for the diamond/mucosa interface are plotted against the different angles of reflection (optical constants of mucosa have been estimated by values similar to water; see later discussion on water and oral mucosa mid-IR spectra). The effective reflectance for unpolarized radiation is:

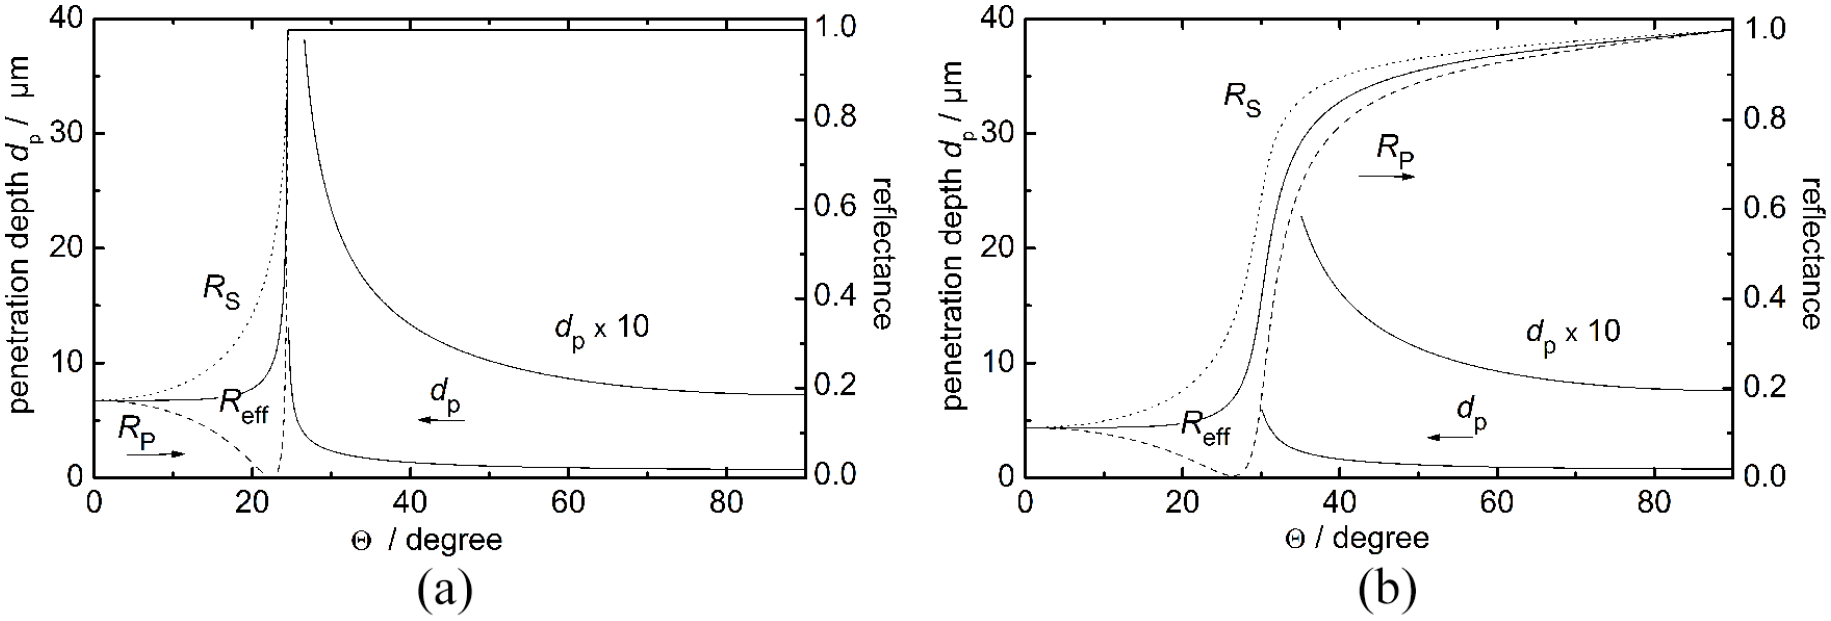
Calculated penetration depths dp of the evanescent wave and the reflectances Rs, Rp, and Reff for the diamond/air (a) and the diamond/water (mucosa) (b) interfaces at 1000 cm−1 plotted vs the different angles of reflection (nair = 1.0, ndiamond = 2.42, 32 ñtissue = 1.2085 + i 0.0541 at a wavenumber of 1000 cm−1). 33
Simulations
In the examples shown above, the angle-dependent reflectances as well as the penetration depth for two different interfaces (air/diamond and water/diamond, respectively) have been calculated. The average reflectance Reff consists of the perpendicular and parallel polarized radiation, indicated with Rs and Rp, respectively (see equation above). For calculations of the penetration depth, the MATLAB software (MathWorks Inc., Natick, USA) has been used. For the air/diamond interface (Figure 3a) a critical angle of 25° can be computed, while the penetration depth at an incident angle of 45° is estimated by approximately 1.15 µm. This angle of incidence is realized for the fiber-coupled diamond probe, used for our ATR measurements. Due to the water absorption, the calculated reflectances at the water (mucosa)/diamond interface are strictly monotonic increasing functions in contrast to the air/diamond interface (Figure 3a). Here, for an incident angle of 45°, a reflectance Reff of about 0.9 can be estimated, while the penetration depth (dp = 1.30 µm) is only marginally influenced compared with that of the air/diamond interface (dp = 1.15 µm).
The sensitivity of the ATR technique, when based on the employment of the fiber-coupled diamond prism with two reflections at the diamond/sample interface, has been estimated by comparing the spectra of an aqueous glucose solution also measured with a flow-through transmission cell of 30 µm pathlength (see Figure 4a). The absorbances of the major glucose absorption bands around 1080 cm−1 provide a transmission equivalent thickness of about 4 µm with two reflections, which also allows an estimate for the total depth penetration into oral mucosa. In Figure 4(b), spectral features of an unstimulated saliva sample are presented. As lowest spectra, the spectral signatures of liquid saliva together with a phosphate buffer spectrum (pH = 7.6) as a major compound are shown. Spectral subtraction highlights the bound carbohydrate forms (blue curve) as found in mucosal glycoproteins. Other proteins such as enzymes, immunoglobulins, antimicrobial factors, and some polypeptides and oligopeptides also exist in saliva, leading to interfering spectral absorption within the glucose-specific band interval between 1200 and 950 cm−1. More organic confounding features to those of glucose appear with dry-film preparations due to concentration enrichment during and after water evaporation.
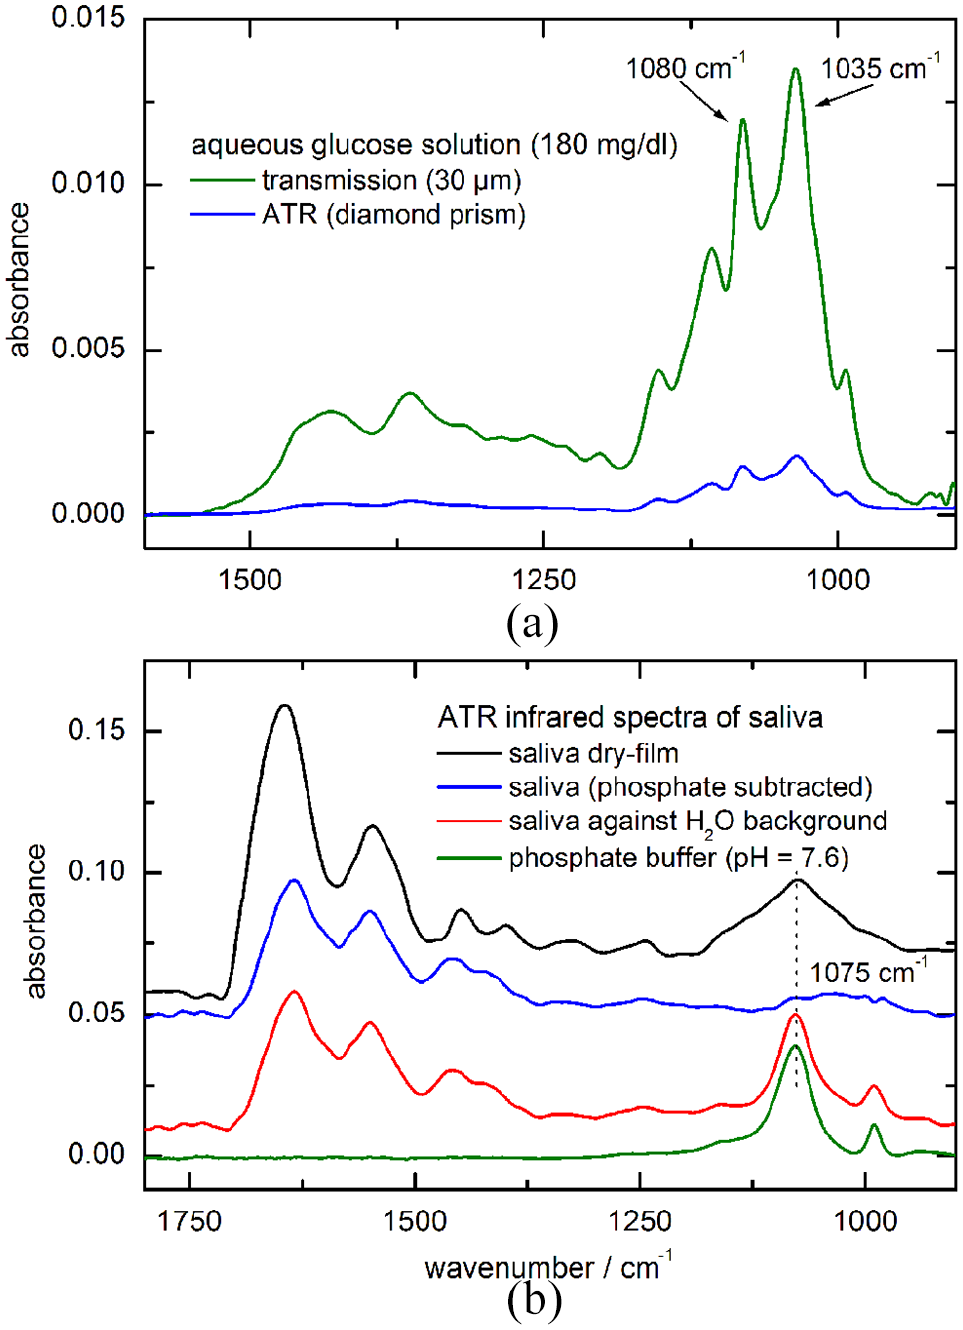
(a) Comparison of the sensitivities obtained with transmission- and ATR-spectroscopy, as demonstrated by aqueous glucose measurements; (b) ATR spectra of pure saliva and saliva measured against water for the accentuation of the sample phosphate showing up in the spectral signatures around 1075 cm−1. ATR, attenuated total reflection.
Confounding Factors for Glucose Determination
In principle, glucose concentrations in saliva are two orders of magnitude smaller than usually found in blood, even after carbohydrate intake (see for example studies by Borg and Birkhed). 34 A compendium for the composition of biofluids reports an average concentration of 0.81 ± 0.31 mg/dL of free glucose for parotid saliva, whereas whole saliva showed a by a factor 3 smaller mean concentration. 35
As the concentrations in saliva have been found very low, at least an increasing glucose concentration gradient within the epidermal mucosa layer (overall thickness around 100 μm), starting from the surface at negligible levels, is to be expected (for its anatomical structure, see Figure 2b). The epidermal mucosa is only supplied by diffusion and facilitated transport mechanisms from the papillary dermis vasculature below. As the measurement object is inner lip oral mucosa, confounding effects from a thin layer of saliva must also be assessed.
Besides the consideration of saliva-related effects with low concentrations of glucose, protein-bound carbohydrates were found in saliva at a mean concentration of 21.3 ± 5.8 mg/dL. 35 The spectral features of different glycosylated proteins have been investigated by Khajehpour et al., 36 which is interesting for studying the variability of glycation signatures. It is very crucial to use multivariate spectral techniques for glucose quantification (eg, classical least squares approaches), as single band analysis, recently demonstrated by Haas et al., 37 will lead to erroneous concentration results. These spectral misinterpretations might originate from overlapping vibrational bands in the carbohydrate characteristic spectral range between 1200 and 950 cm−1, where also the broad and prominent absorption band of phosphate is located around 1075 cm−1 (see also Figure 4a and b).
Regarding ATR measurement techniques for skin spectroscopy, instrumental progress has been utilized by us. In our early study, 22 an internal reflection element of ZnSe with an area of 10 × 50 mm was used, but turned out to be rather inconvenient for repeated lip measurements. In contrast to this, fiber-optic probes have now been preferred by us for skin surface measurements (see Figure 1b). For the recording of IR skin and saliva spectra, substantial large spectral signal-to-noise ratios could thus be realized. In Figure 5(a), ATR spectra of water and different skin tissues are illustrated, proving the water content of the inner lip mucosa much higher than that of the stratum corneum, measured here from the skin of a digit fingertip (see water signatures below 1000 cm−1, around 1650 cm−1, and above 2800 cm−1).
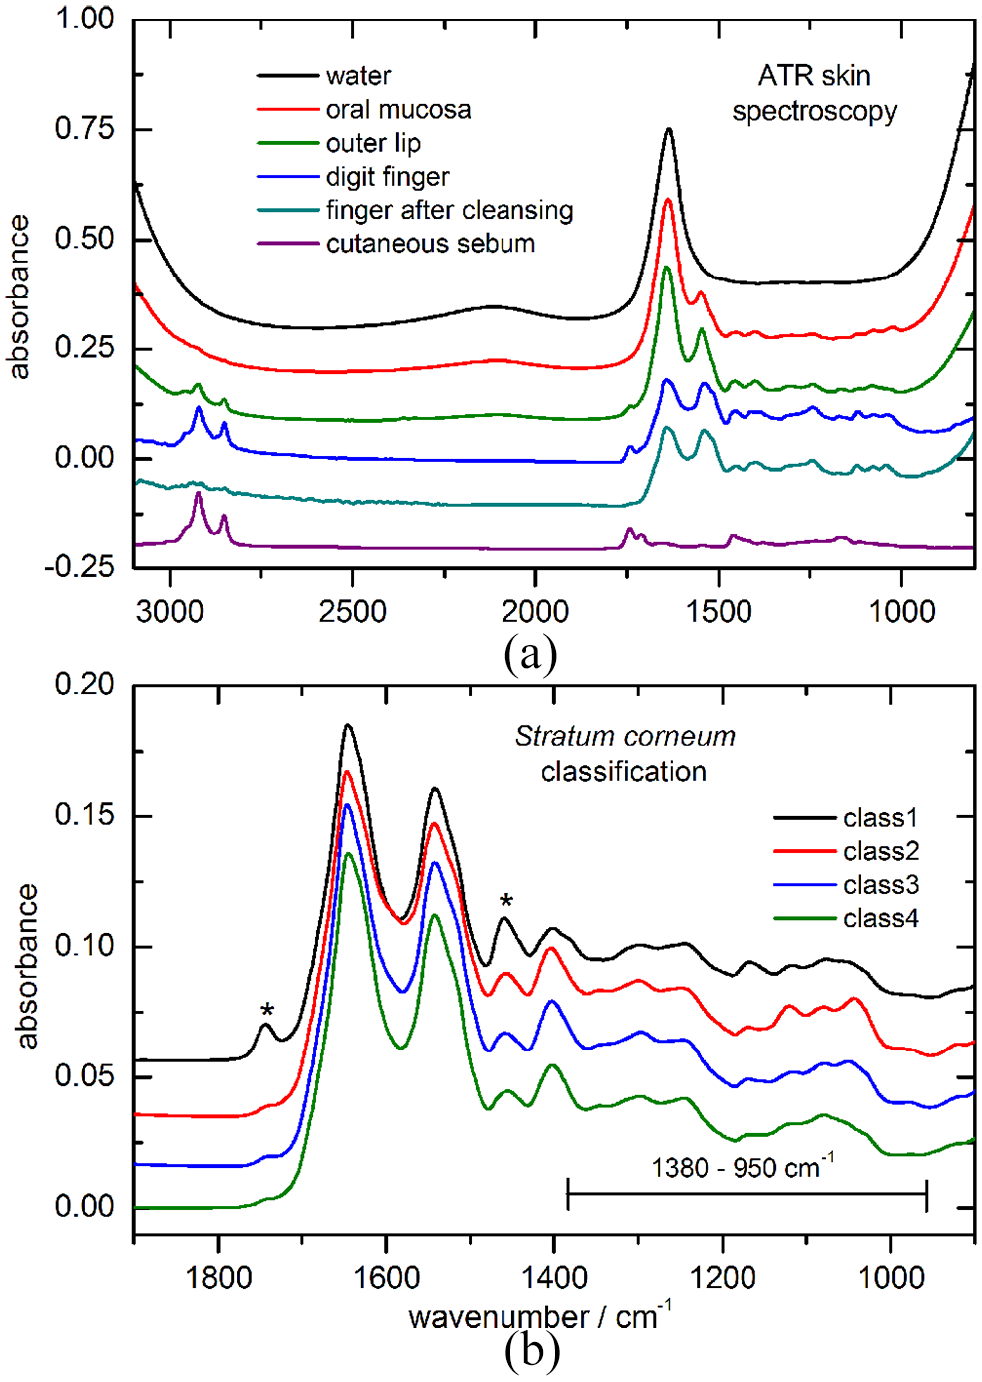
(a) IR-ATR spectra of different human skin tissues, also after ethanol cleansing, measured with a fiber-optic probe, as well as water for comparison, indicating varying H2O absorption signatures within each recorded spectrum; (b) average stratum corneum spectra, representing four different skin classes after a hierarchical cluster analysis. Main spectral characteristics from the surface keratin-containing skin layer can be identified from the highlighted band interval (* lipid impurities from skin surface). ATR, attenuated total reflection; IR, infrared.
For a classification of different skin types by measuring the composition of the outer skin layer, a hierarchical cluster analysis (HCA) of spectra from different skin surface sites was used. For obtaining robust results, 75 spectra were recorded from people with diabetes and healthy subjects after cleansing and tape stripping of the stratum corneum. The analysis was performed by applying WARD’s algorithm 38 (OPUS IDENT software, Ettlingen, Germany) after calculating the spectra’s second derivatives and subsequent vector normalization in the wavenumber range of 1380-950 cm−1, representative also for the keratin containing horny layer of the skin and leading to a possible classification. HCA is based on spectral similarity and more details on the calculated dendrogram were previously given. 39 Four main classes have been obtained with major spectral differences in the so-called carbohydrate bands interval above 1000 cm−1 (for the class average spectra, see Figure 5b). For the class 1 spectrum still some lipid contributions can be found with band contributions at 1745 and 1460 cm−1, but which do not affect the carbohydrate bands region. These spectral differences between skin features illustrate another possible confounding factor to be considered for the analysis of in vivo skin spectra.
In early experiments with several healthy subjects and people with diabetes, undergoing oral glucose tolerance tests for changing the subjects’s physiological blood glucose level, 22 spectral absorbances with an root mean square (rms) noise level of around 5 μAU (absorbance units) could be measured at the glucose characteristic vibrational bands above 1000 cm−1. For a physiological blood glucose concentration of 100 mg/dL, a maximum absorbance signal of 2 mAU was found (see also Figure 4a for the sensitivity achievable with our fiber-optic probes). Under the given experimental conditions, no evidence for a correlation between spectral lip features and changing blood glucose concentrations could be provided, even with calculated time delays for the time-dependent blood glucose profiles due to suspected glucose diffusion to the lip mucosa surface. Also a principal component analysis of the spectra, collected during the oral glucose tolerance tests, did not provide evidence that multivariate glucose features could be detected. 22
The variability of the outer skin layer has been demonstrated with different treatments of the skin and subsequent ATR-spectral measurements. In Figure 6(a) the effect of different manipulations, among these cleansing with detergent and ethanol, is shown, where also the occlusion of the stratum corneum by glove wearing and tape stripping has been investigated. More drastic effects can be seen after repeated tape stripping of forearm skin with larger water concentrations found at greater depth with continued removal of corneocytes layers. Again, changes in the glycosylation interval above 1000 cm−1 are evident (see Figure 6b).
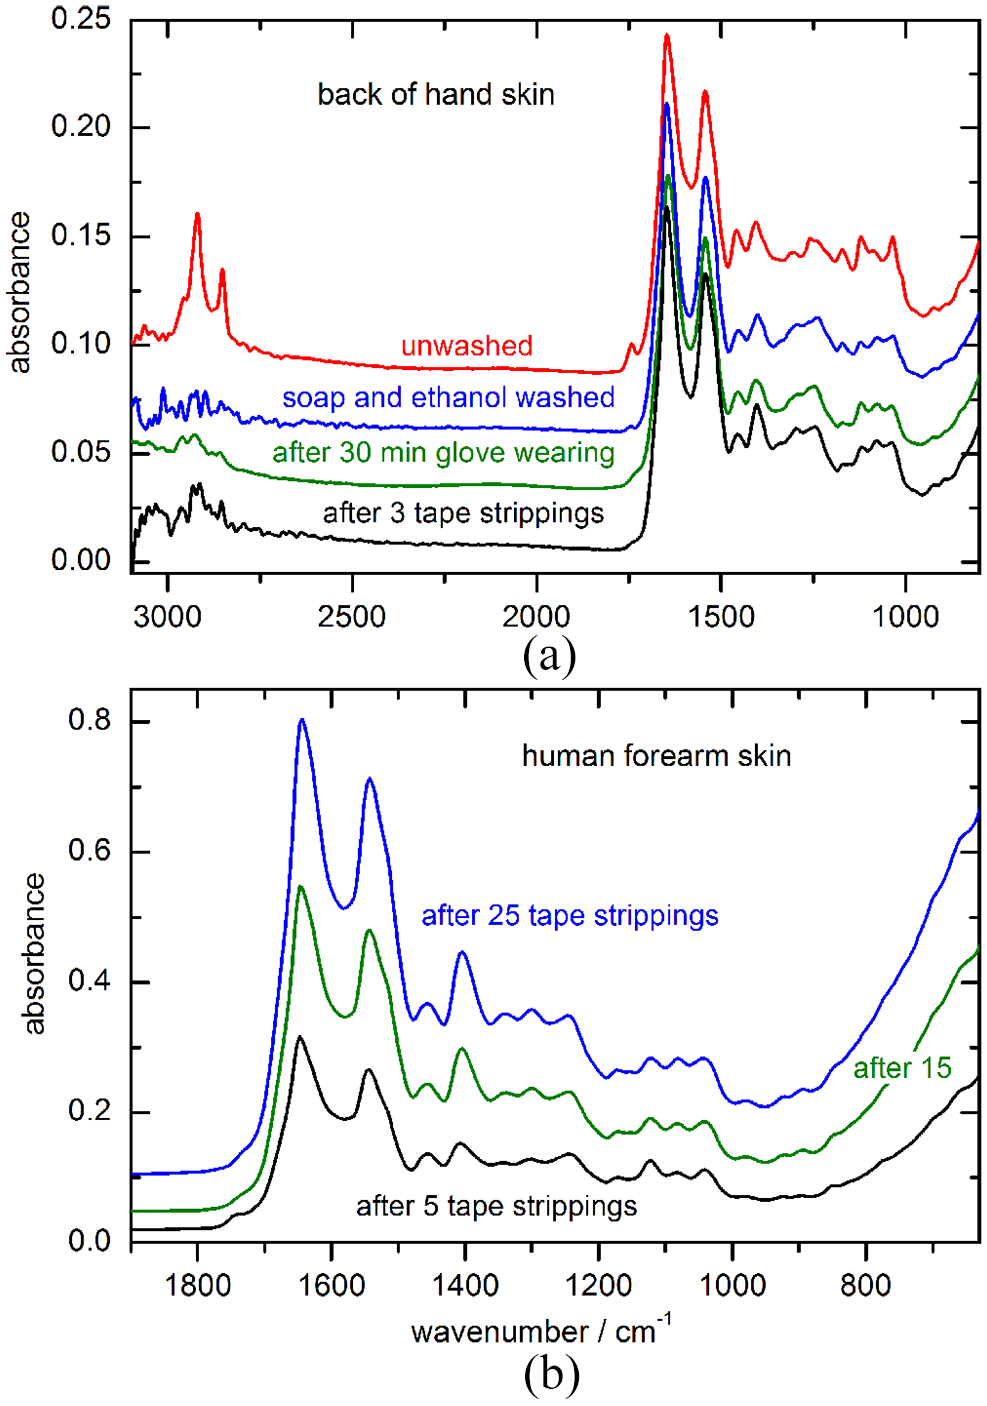
(a) Four fiber-probe spectra, recorded from the back of a human hand before and after different pretreatments of the skin site; (b) Forearm skin spectra after multiple tape strippings with an apparent increase of water absorption.
In this context also our previous project on diabetes screening must be mentioned, for which stratum corneum spectra had been recorded after skin cleansing and tape stripping under parallel determinations of blood glucose and glycated hemoglobin A1c (HbA1c) values. The test population contained healthy subjects and people with diabetes showing HbA1c values up to above 10%. This had been carried out under the hypothesis that under an elevated blood glucose level over longer times also an increased keratin glycation should be visible. However, a regression of the skin spectra vs the HbA1c values must be considered as not being successful with a correlation of R = 0.303. 39
Conclusion
The glucose assays by mid-IR spectroscopy of serum or plasma samples were very successful, but due to strong water absorptions, usually ATR measurements with transmission equivalent sample layers of 10 µm were favored. Noninvasive measurements would suffer from low photon penetration depth into skin tissue within this region around 1000 cm−1 (10 µm wavelength), 10 but with the arrival of quantum cascade lasers as intensive radiation source, new opportunities for in vivo measurements exist. However, even with the significantly increased laser power, compared with thermal radiation sources usually implemented within conventional FTIR spectrometers, measurements using the ATR techniques cannot be successful due to penetration depth limitations. As several confounding factors exist for in vivo oral mucosa measurements and epidermal experiments with stratum corneum, a careful multivariate spectral analysis is required, exploiting the most significant spectral features of glucose. From our studies it is evident that normal skin with its uppermost stratum corneum layer, as an intrinsic perfect skin barrier, is not suited for any noninvasive ATR measurements of inner epidermal tissue compounds such as interstitial or even blood glucose.
Footnotes
Declaration of Conflicting Interests
The author(s) declared no potential conflicts of interest with respect to the research, authorship, and/or publication of this article.
Funding
The author(s) disclosed receipt of the following financial support for the research, authorship, and/or publication of this article: Parts of this work have financially been supported by the Bundesministerium für Bildung und Forschung (BMBF) with project funds (FKZ 01EZ0203).