
Abstract
Background:
For insulins in commercial formulations, degradation can be observed within the certified shelf life when not stored at recommended conditions. Elevated temperatures and exposure to shear forces can cause changes in the secondary structure of the hormone, leading to a decrease in pharmaceutical potency. International pharmacopoeia recommendations for insulin quality monitoring assays mainly rely on liquid chromatography methods. These methods are unable to distinguish between active and inactive forms, both of which may exist in pharmaceutical insulins exposed to stress conditions.
Method:
Infrared attenuated total reflection spectroscopy has been used for the analysis of insulin dry film preparations using affordable instrumentation. This method can be applied to either formulated insulin specimens or pure insulins obtained by ultrafiltration. Such samples have been stored under different temperatures (0°C, 20°C, and 37°C), and degradation processes have been monitored up to a period of a few months.
Results:
By analyzing specific shifts of absorption bands in the infrared spectra, which are sensitive to the protein secondary structure, even small structural changes in the hormone become evident. Another option is amide I band deconvolution into individual bands, which can be attributed to secondary structure subunits that are part of the insulin tertiary structure.
Conclusion:
A novel and innovative method based on infrared attenuated total reflection spectroscopy of insulin dry films is a promising analytical tool for quantifying the degree of insulin degradation, as it provides information on indicating a decrease in biological potency. The established methods for insulin potency assays require animal testing or clamp experiments on people with diabetes.
Keywords
Introduction
In biopharmaceutical products for therapeutic usage, proteins represent the most important substance class, for which the need of quality and safety monitoring of commercial products should be required after entering the market and before use by the consumer or patient. If the insulin in pharmaceutical formulations is exposed to elevated temperatures (ie, from breaks in the storage cold chain) or shaking during transport, structural changes in the proteins (called misfoldings) can be observed, leading to a deterioration of the product. First effects can be protein misfolding with changes in the protein secondary structure, followed by the appearance of oligomers, further protein aggregation, and protofibrils to fibril formation, ultimately leading to a reduction in the potency of the active pharmaceutical ingredient.1,2 In order to avoid this process, different formulations of biopharmaceuticals have been developed, which contain a multitude of excipients for stabilization and acting as bactericide for conservation. For insulin formulations in particular, di- and hexamer structures provide additional stabilization. An informative overview on industrially synthesized insulins and their formulations can be found in Ref. 3
Reliable analytical methods are required for the composition analysis of commercial insulin formulations and the potency assessment of human and analog insulins. Depending on the amino acid apposition, human insulin and its analogs have a molecular mass between 5800 and 6060 Da. The hormones consist of alpha helical; random coil; and a few turn, bend, and beta sheet structures4,5 (see Figure 1).
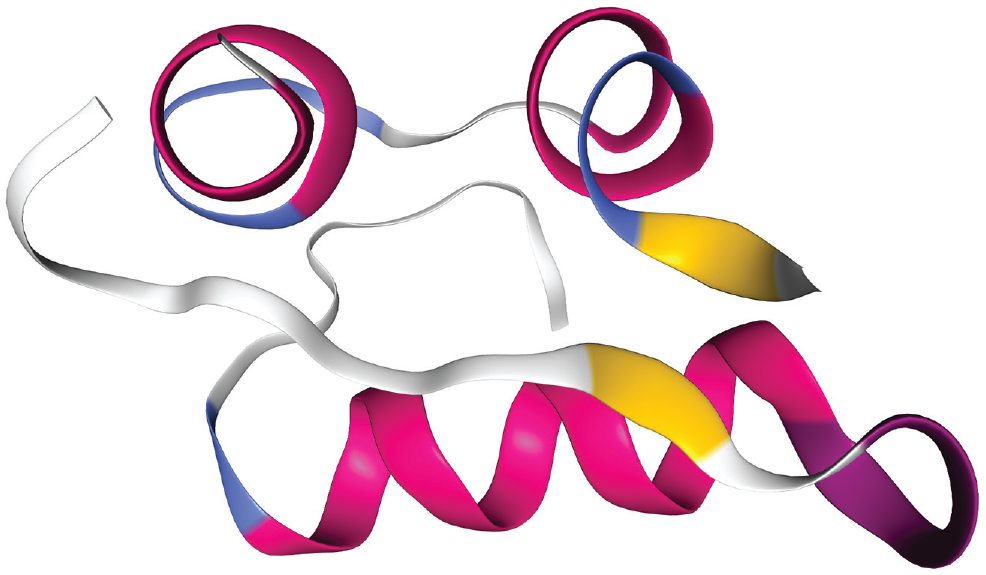
3D model showing the structure of the human insulin (3I40) with its peptide A and B chains. The secondary structure is composed of 47% alpha helices and 4% beta sheets (chain A), as well as of 46% alpha helices and 3% beta sheets (chain B).
In the event of temperature- or stress-based misfolding, the secondary structure can change and beta sheet structures will be formed without affecting the molecular mass of the insulin monomers. 3 After such structural rearrangements, high performance liquid chromatography (HPLC) methods are still able to detect both types of active and inactive insulins, but fail to distinguish between them. Thus, HPLC methods are not suited for determining the biologically active insulin fraction from the chromatograms, despite the fact that such methods have been established by different pharmacopeias as analytical reference methods. 6
Especially after long-term storage under different environmental conditions, the molecular stability determination of insulins in injection solutions from pharmacies is a special challenge, as illustrated by recent publications.7-9 Most analytical methods, that is, HPLC with ultraviolet detection or coupled with mass spectrometry,10,11 nuclear magnetic resonance (NMR) spectroscopy,12-14 or photometric assays (Bradford), 15 can be used to determine total insulin content. However, these methods cannot be applied for secondary structure analysis, which is most essential for assessing the insulin’s pharmacological activity.
Different assays have recently been presented, focusing on different aspects within the transformation from monomers to oligomers and the subsequent fibrillation processes. An article explaining the process of the dissociation of insulin hexamers into monomers under the presence of different excipients, using 1 H NMR spectroscopy by application of the special technique of “diffusion profiling,” has been published by Falk et al. 16 Other NMR techniques, using a benchtop NMR analyzer, have been presented by Yu et al, and are based on the transverse relaxation rate of water protons to serve as a sensitive indicator for the detection and quantification of visible and subvisible protein aggregates.13,14 The advantage of this method is that it is nondestructive, since no cartridge opening is required for inspection. Another study on the aggregation of insulin analogs has been reported by Zhou et al, who used size exclusion chromatography in combination with concomitant dynamic light scattering and Raman spectroscopy. Here, vibrational spectroscopy could document that the protein aggregation was induced by the misfolding of a large fraction of native alpha helix into beta sheet structures. 17
Infrared (IR) spectroscopy has been successfully utilized for protein secondary structure analysis in the case of misfolding and fibril forming (see eg, Ref.18-20). Therefore, fast IR spectroscopic measurements offer a reliable approach to monitor even small changes in the secondary structure of insulins within commercial formulations. Recently, a similar approach for the quantification of misfolded structures in biopharmaceuticals was presented. This method is based on transmission IR spectroscopy using Fourier Transform (FT) spectrometers and tunable quantum cascade lasers (QCL). Reference measurements were carried out using circular dichroism spectroscopy. 21 In particular, the spectral interval covering the protein amide I band was investigated for protein secondary structure changes (see also below). Solution protein spectra had also been analyzed within the same wavenumber interval by Lopez-Lorente et al, applying attenuated total reflection (ATR) techniques in combination with FTIR and tunable QCL spectroscopy, followed by a detailed amide I band analysis. 22
It is certain that the insulin’s potency depends on the stability of the secondary structure of the monomers, meaning even minor misfolding leads to a corresponding functional deactivation. 23 Another significant advantage of the suggested IR spectroscopic assay using dry film preparations of microliter formulation samples is its possible application as a point-of-care method, due to being reagent free, fast, and requiring a low budget for instrument acquisition.
After shedding light on the background of the spectroscopic assay by evaluating the spectra of the active and worst-case fibrillated hormones, various insulins in pharmaceutical formulations and purified, nonstabilized specimens were monitored over several weeks under “aging” conditions. Thus, also early misfolding processes can be followed. Finally, the suggested assay has been applied to a formulated insulin specimen as pharmaceutical model substance, stored at elevated temperature for a longer time period.
Methods
From our larger collection of insulin pharmaceuticals that were purchased from German pharmacies, results for two exemplary formulated insulin specimens, as well as for the United States Pharmacopoeia (USP) human insulin standard (Sigma Aldrich, St. Louis, Missouri, USA) for comparison, will be reported. These insulins, which include insulin detemir (Levemir, Novo Nordisk, Bagsværd, Denmark) and insulin lispro (Humalog, Eli Lilly, Indianapolis, Indiana, USA), were stored under different temperature conditions (0°C, 20°C, and 37°C, respectively, as realized by climatic exposure test cabinets and laboratory room temperature). In addition to the purchased insulin samples, ultrafiltrates of the original formulations were prepared using 3 kDa cutoff Vivaspin 500 centrifugal concentrators (Sartorius, Göttingen, Germany), based on vertical membrane technology for an insulin recovery of up to 90% (see also Figure 2).
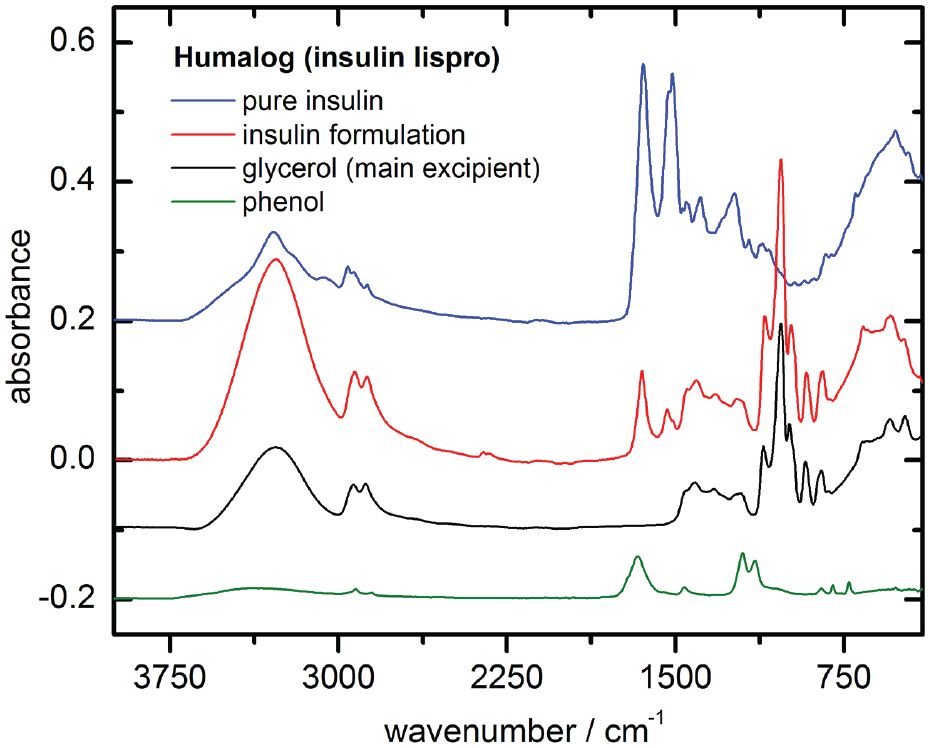
Fourier transform infrared attenuated total reflection (FT-IR ATR) spectra from insulin lispro, prepared as dry-films (1 µl sample volumes): pure insulin from ultrafiltration and insulin formulation samples with excipient compounds such as glycerol and phenol (the latter dry-film had been prepared from 2 % aqueous solution).
Samples of both formulated insulins and their ultrafiltrates, when stored under different temperature conditions, were kept in 500 µL sterile sealed plastic tubes, which were shortly opened for weekly sample withdrawal for testing. In order to avoid contamination, sample handling and spectroscopic measurements were carried out under a laminar flow cabinet. The same treatment was applied to the USP insulin prepared as an aqueous phosphate buffer solution. For a systematic study of the insulin’s secondary structure over a period of nine weeks, dry film spectra were recorded using a Bruker ALPHA spectrometer (Bruker Optics, Ettlingen, Germany) equipped with an ATR accessory. Regarding reproducibility and characterization of the IR spectra, an elaborated protocol for all measurements using ATR-IR-spectroscopy was established, describing sample handling, dry film preparation, and spectral analysis as standard operating procedure. Insulin samples of 1 µL volume were applied to the ATR accessory diamond and then air blow-dried using a membrane pump fixed close to the sample.
Secondary structure analysis of selected dry film spectra of insulin specimens was accomplished using the OPUS software (Bruker Optics, Ettlingen, Germany). As a first step, the absorbance spectra were preprocessed by minimum-maximum normalization between 1780 and 1580 cm−1, limiting the amide I band maximum to a value of two absorbance units. In order to localize the protein secondary structure component bands, second derivative spectra were calculated with Golay-Savitzky procedures (cubic polynomial with nine supporting points) and subsequent curve fitting within the amide I region. Characteristic band shifts could be demonstrated, by forced fibril formation within an insulin detemir sample (Levemir, Novo Nordisk, Bagsværd, Denmark). The sample was stored at 37°C for 48 hours after adjusting the pH level to 2.0 using 0.1 molar hydrochloric acid solution. A scanning electron microscopic (SEM) image (see Figure 3) of the sample showed the fibril structures within the insulin formulation after incubation at low pH from a 1:10 diluted sample dried on a gold-sputtered glass slide.
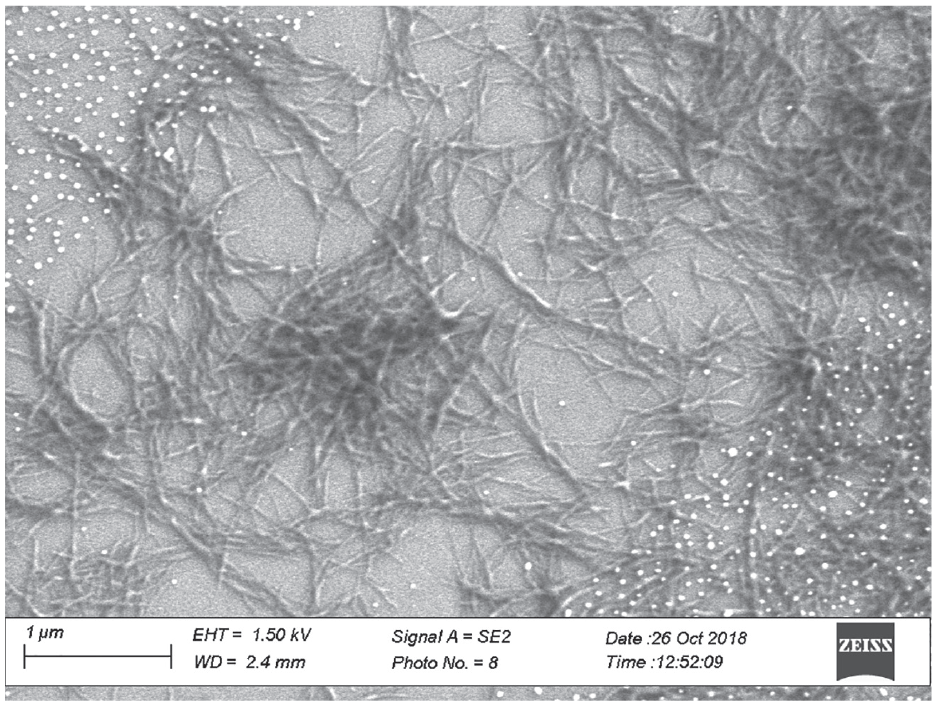
Scanning electron microscopic image of an insulin fibril network measured with a ZEISS Scanning Electron Micro-scope (Sigma 300 VP, Oberkochen, Germany). The white dots are gold nanoparticles from the sputtering process.
For a study of the reproducibility of the aforementioned dry films of selected insulin specimens and their IR spectra, five independent ATR measurements of dry film samples from two different insulin vials (eg, insulin detemir and insulin lispro) were studied. An average absorbance normalized spectrum was calculated for each spectral data set, as well as the corresponding standard deviation spectrum. For the two measured insulin samples, the amide I band positions and uncertainties were determined at wavenumbers of 1651.3 ± 0.3 and 1654.0 ± 0.3 cm−1, respectively.
Results
Ultimately, even minor changes in the secondary structure could be detected in all of the insulin samples studied (original formulations or pure insulins without excipients, obtained from ultracentrifugation), independent from preset storage temperatures or pretreatment and in contrast to samples stored in the refrigerator at 4°C. In addition to the deconvolution results of the secondary structure sensitive amide I bands, shifts of the band position were also observed due to increased beta sheet and turn fractions with band centers mostly around 1630 and 1665 cm−1 (see Figure 4a and b). The following subsections expand on fundamental aspects of the suggested method.
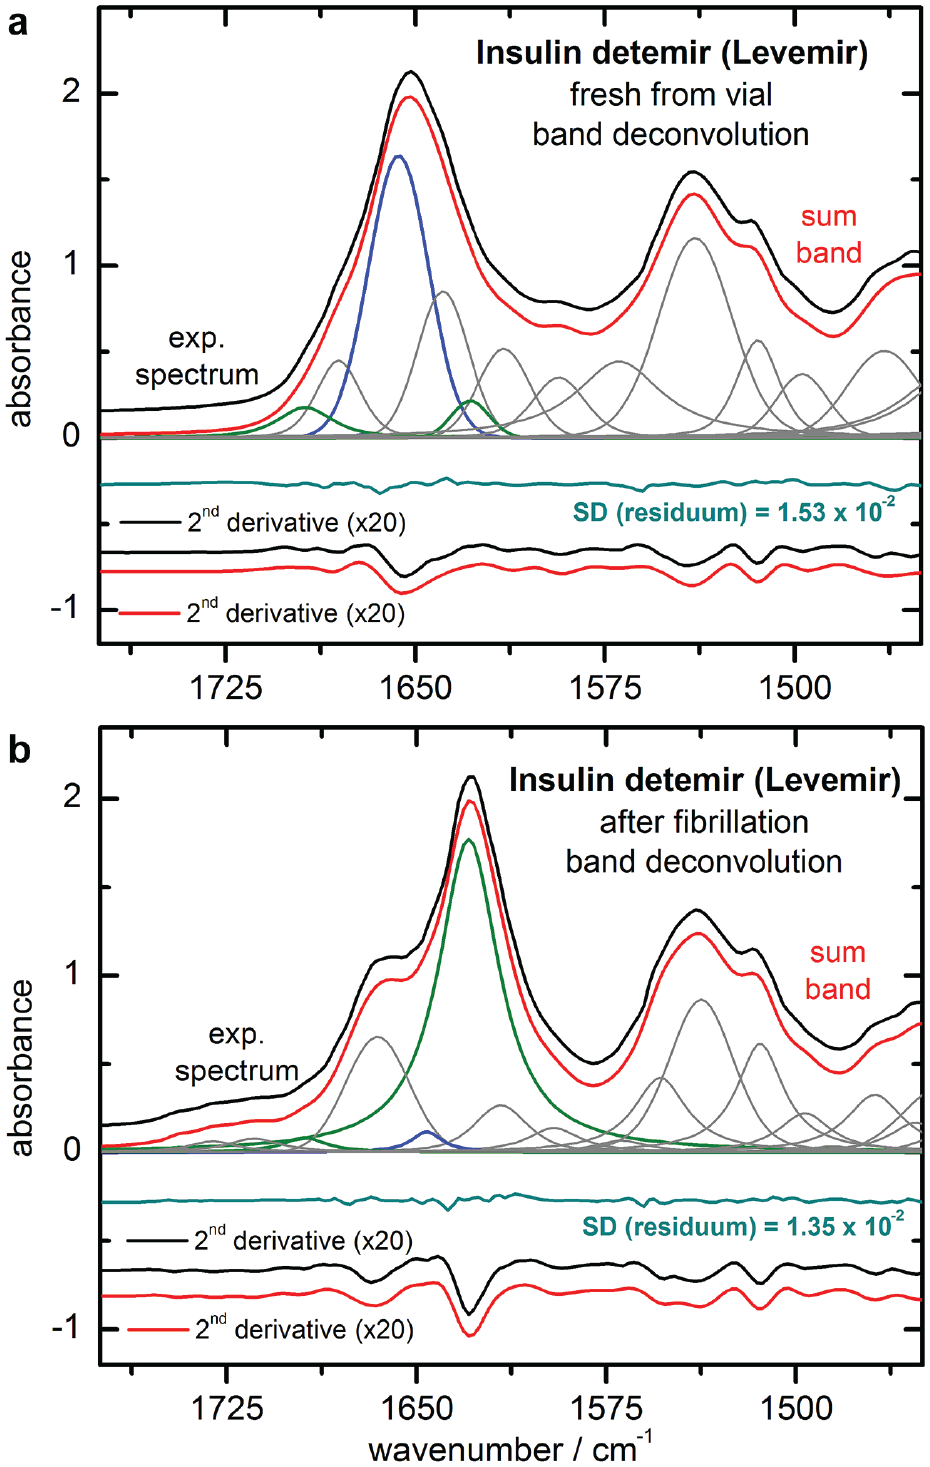
Experimental and fitted sum band spectra, calculated from least squares band deconvolution of the freshly taken (a) and forced fibrillated (b) samples of insulin detemir formulations, are shown as upper traces. Also shown are the fitted band components and the difference spectra, obtained after curve fitting (shifted from zero for clarity). For individual band localization, second derivative spectra were successfully used (lowest traces).
Impact of Secondary Structure on Specific IR Absorption Bands
For a better understanding of the spectroscopic method, a band analysis for estimating different insulin conformations as obtained at different extreme conditions (ie, from the original insulin detemir formulation and from aggregates prepared as fibrils) is presented. The black curves in Figure 4(a) show the amide I and II band interval (experimental ATR spectrum) and the related second derivative spectra of the insulin. The experimental spectrum of the original insulin detemir formulation was recorded directly after opening the purchased vial, which had been stored under recommended temperature conditions. In Figure 4(b), the spectra after forced insulin fibril formation within the pH decreased sample are shown (details above).
By interpreting the dry film insulin detemir reference sample spectrum (Figure 4a), a main absorption band around 1650 cm−1 can be found, resulting from the alpha-helical secondary structure. This is also obvious from the local minimum in the related second derivative spectrum. The black curve of the dry film spectrum of the insulin fibrils (B) shows a significant shift of the most intensive band to a much lower wavenumber (around 1630 cm−1), and a distinct shoulder around 1665 cm−1. This can more clearly be detected from the minima of the second derivative spectrum. These bands can be assigned to the parallel beta sheet and turn substructures of the insulins, which exist within the insulin fibrils.24-26 The consistency of the sample was jelly like, due to the network structure of the insulin fibrils with lengths of about 0.1-1 µm and diameters of < 50 nm (see also SEM image in Figure 3).
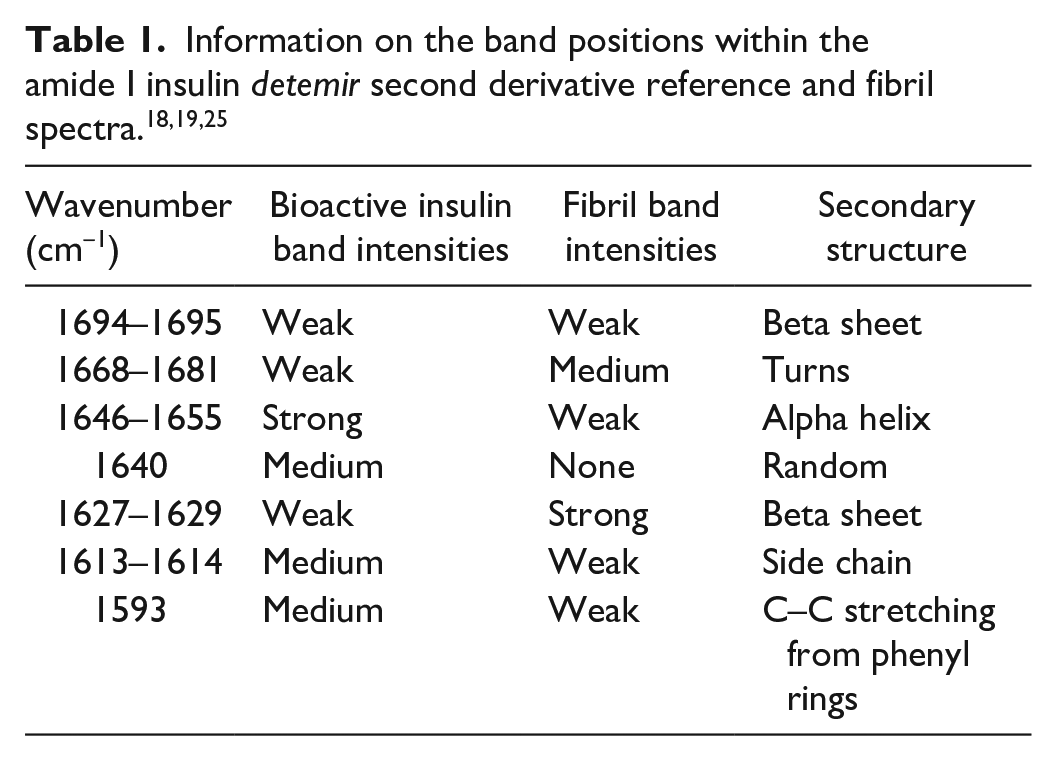
The amide I individual band positions were obtained after spectral resolution enhancement by using second derivative spectra (see also wavenumber listings in Table 1). Band deconvolution was performed by placing Gauss- and Lorentz-shaped bands at the designated wavenumber positions, where the widths and heights of the bands were adjusted by comparison of the experimental and sum band spectra, and of their second derivative spectra, until congruency was achieved (see Figures 4a and b).
Obvious changes within the amide I bands can best be detected by comparing the band components of alpha helical and beta sheet secondary structures, which represent the most common forms in either the active or the misfolded insulin peptides. The ordinate-shifted curves underneath each deconvoluted spectrum show the residues as derived from the difference between the experimental and the calculated sum band spectra.
Long-Term Stability Testing
Within the long-term stability monitoring of five different insulin ultrafiltrates and original formulations that were freshly taken from the purchased vials, the most prominent measurement series were analyzed with different spectroscopic tools to show substructural insulin changes over time.
Pure Insulin Samples from Ultrafiltration
Experimental dry film ATR spectra of a Levemir (insulin detemir) ultrafiltrate sample, stored at 37°C in a climate cabinet and monitored over nine weeks, are shown in Figure 5. In part A, the spectral range from 1725 to 1350 cm−1 represents the insulin peptides’ characteristic vibrational bands within the amide I-III regions. Significant shifts in the amide I bands are apparent as a result of the time-dependent transformation of the insulin’s secondary structure from mostly alpha helix to beta sheet conformations. In Figure 5(b), the second derivative spectra, as calculated from the above shown experimental spectra, provide more detailed information about the previously detected structural changes. This underlines the decrease of alpha helical and increase of turn and beta sheet amounts of the total protein, as detectable around 1650 and 1630 cm−1, respectively. Another interesting observation was made with regard to the amide III band region, which exhibited similar structural changes to the amide I region, as seen in the second derivative spectra over time. In Figure 6(a), the corresponding maximum band positions of the amide I vibration are plotted over time, illustrating an obvious shift from 1643 to 1631 cm−1. A similar shift was found for the amide A band, assigned to the N–H stretching vibration, which was around 3290 cm−1 at the start of our artificial aging experiment, and shifted to 3274 cm−1 after nine weeks.
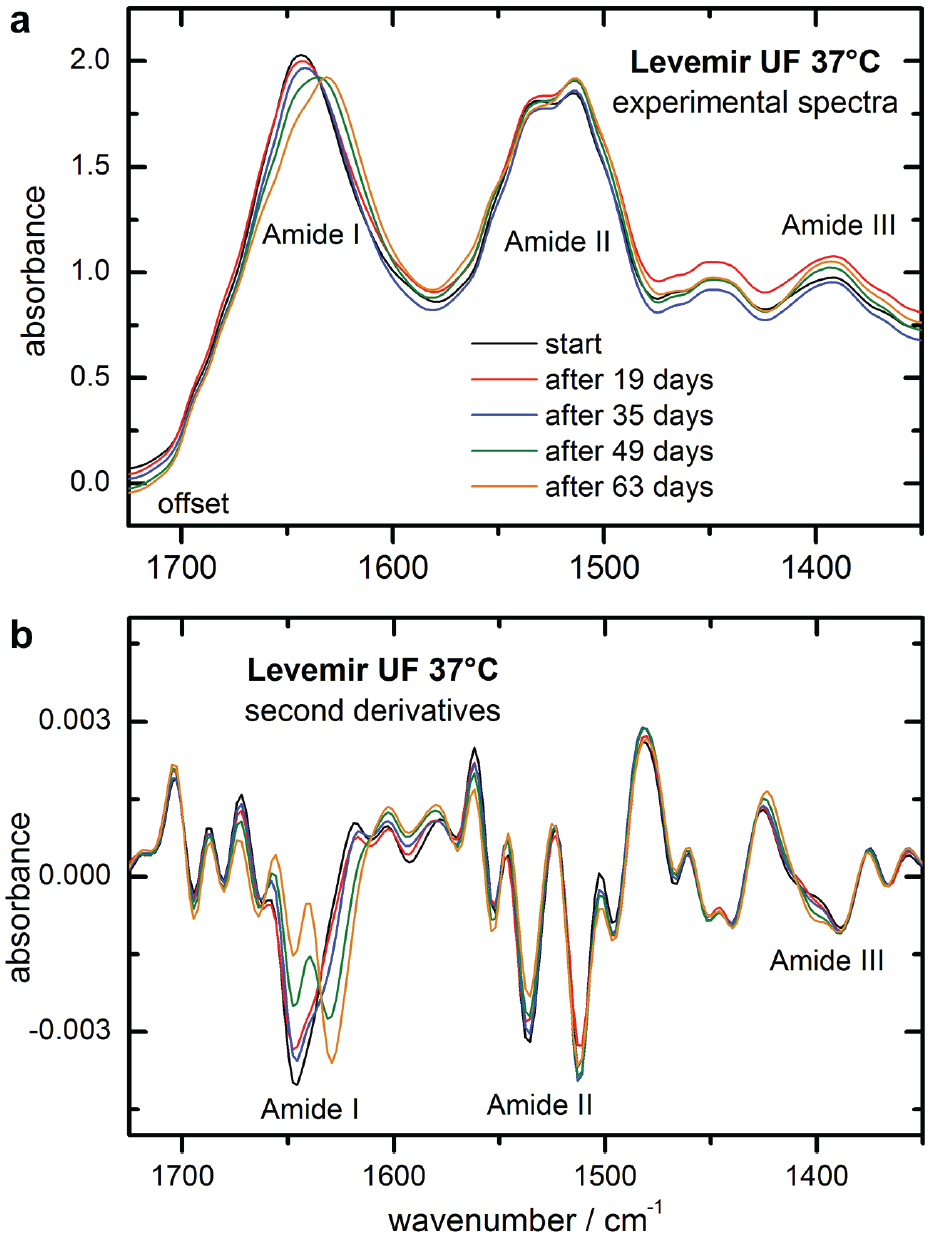
Experimental infrared attenuated total reflection spectra of insulin detemir samples from an ultrafiltrated intact formulation, as stored at 37 °C over a time period of nine weeks (spectral resolution of 8 cm-1, min-max-normalized to the amide I band), and presented with a small offset each (a) and corresponding second derivative spectra (b).
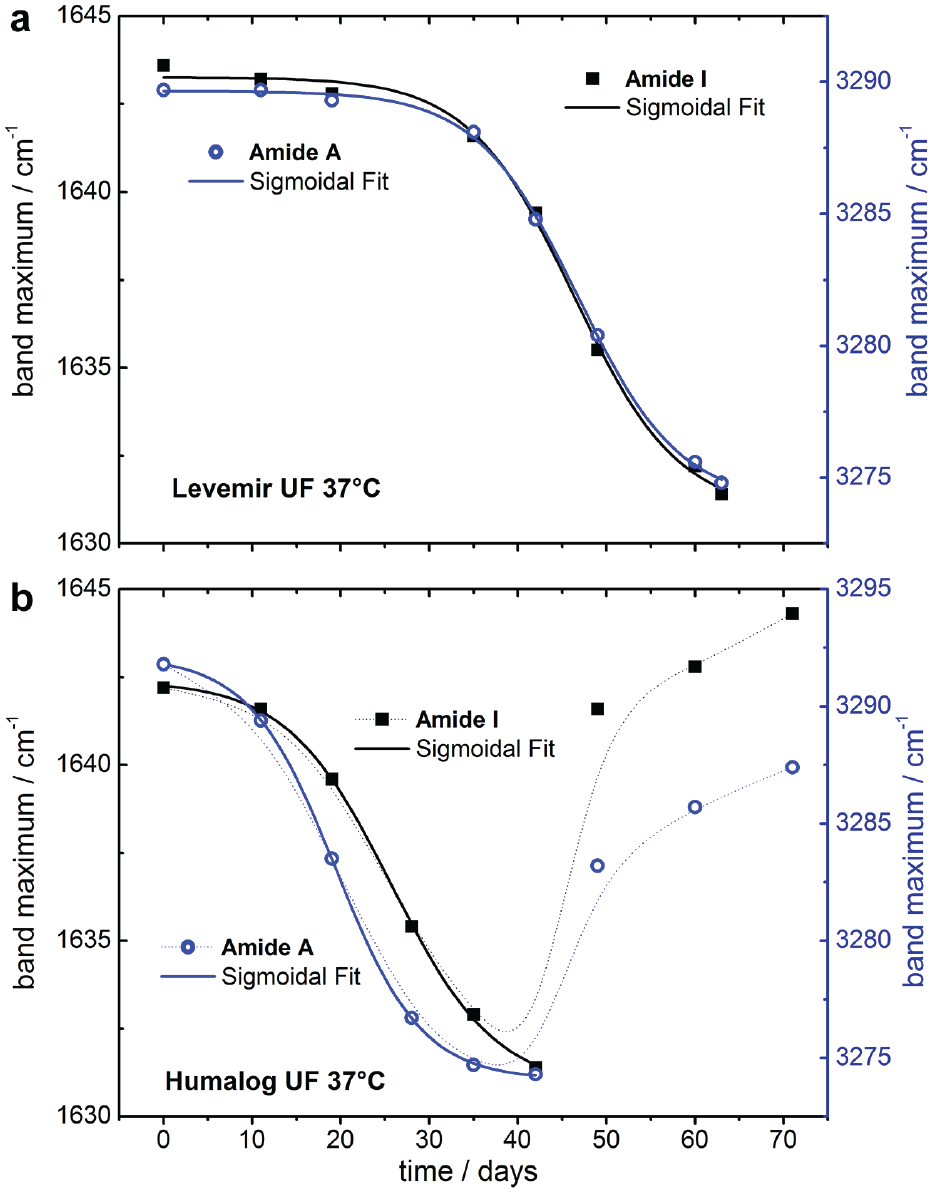
Plot of the amide I (left scale) and A (right scale) maximum band positions of the long term measurements of a pure insulin detemir sample as obtained from ultrafiltration of an intact formulation when stored at 37°C - both curves are from a least-squares fit with a sigmoidal Boltzmann function (a); plot of the amide I and A maximum band positions obtained during the long term monitoring of an ultrafiltrated insulin lispro sample stored at 37°C (b).
All data points of the band shifts against the band position of the spectrum at the start of our experiments were fitted with a sigmoidal function (Boltzmann) using the Origin software (Microcal Software Inc., Northampton, MA, USA).
The aforementioned procedure of the determination of amide I or amide A band position changes was also applied to a pure insulin lispro sample, as prepared by ultrafiltration of the original intact formulation from Eli Lilly (Humalog, Indianapolis, Indiana, USA) stored at 37°C for several weeks. In contrast to the insulin detemir sample, the alpha to beta secondary structure transformation (observed with the shift of the maximum band positions) took six weeks before another structural change in the insulin peptide could be observed. Further investigation is needed (see Figure 6b).
Original Insulin Formulation Specimens
Concurrent to the isolated insulin samples from ultrafiltration, original formulations were stored under identical controlled climatic conditions. Taking the reproducibility measurements of insulin dry films into consideration, the method of maximum band position determination offers a sensitive analytical tool to detect even small changes in the protein’s secondary structure. An example of substructural changes in formulated insulins can be seen in Figure 7, where two samples of either insulin detemir (a) or insulin lispro (b) were stored at 22°C and 0°C, respectively. Maximum amide I band positions are shown in the subplots, and the dotted lines highlight the spectral changes over a time period of nine weeks. Even more obvious are the characteristic second derivative spectra, which for both samples show a decrease of the alpha helical band at around 1655 cm−1 and a simultaneous increase of beta sheet formations around 1632 cm−1.
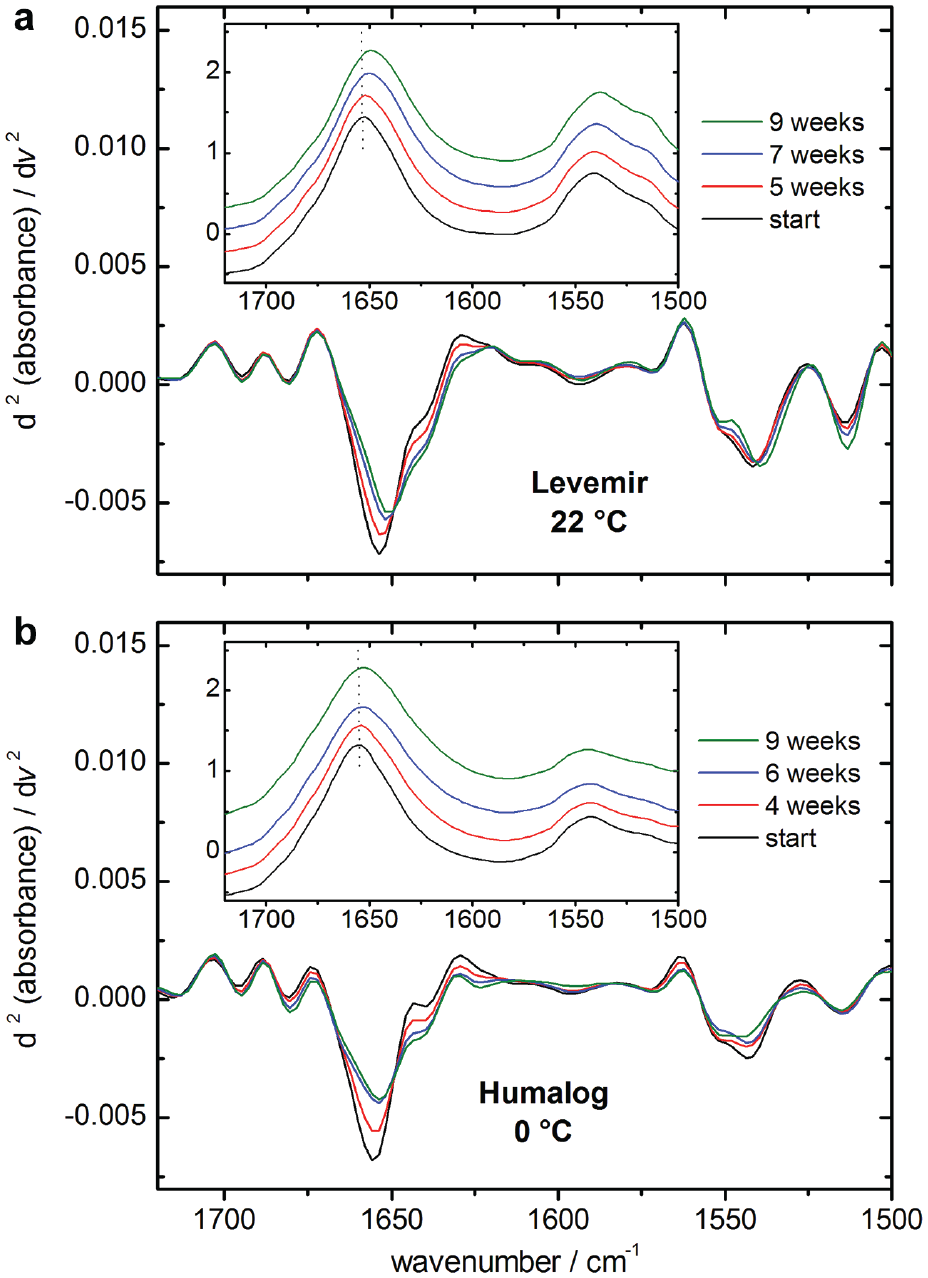
Maximum amide I band positions and corresponding second derivative spectra of exemplary insulin samples (insulin detemir [a] and insulin lispro [b]), stored at room temperature and at 0° C, respectively. Changes within the intensity normalized amide I bands are clearly detectable by comparing either the maximum band positions in the absorbance or the second derivative spectra against the reference (experiment start).
Maximum amide I band positions of the spectra—obtained from the insulin lispro (Humalog) sample, stored at 0°C, as well as from another insulin lispro sample, kept at 37°C—were determined by the OPUS software and plotted over time (see Figure 8). For both samples, changes in the maximum band position could be detected, leading to the assumption that secondary structure changes can occur under different temperatures, even for stabilized insulins. However, compared to changes in the spectra of pure insulins, obtained by ultrafiltration, only very small shifts were detected (3.5–4 cm−1), suggesting stabilizers such as phenol, meta-cresol, and glycerol can significantly protect the proteins from accelerated misfolding, thus ensuring long-term stability.
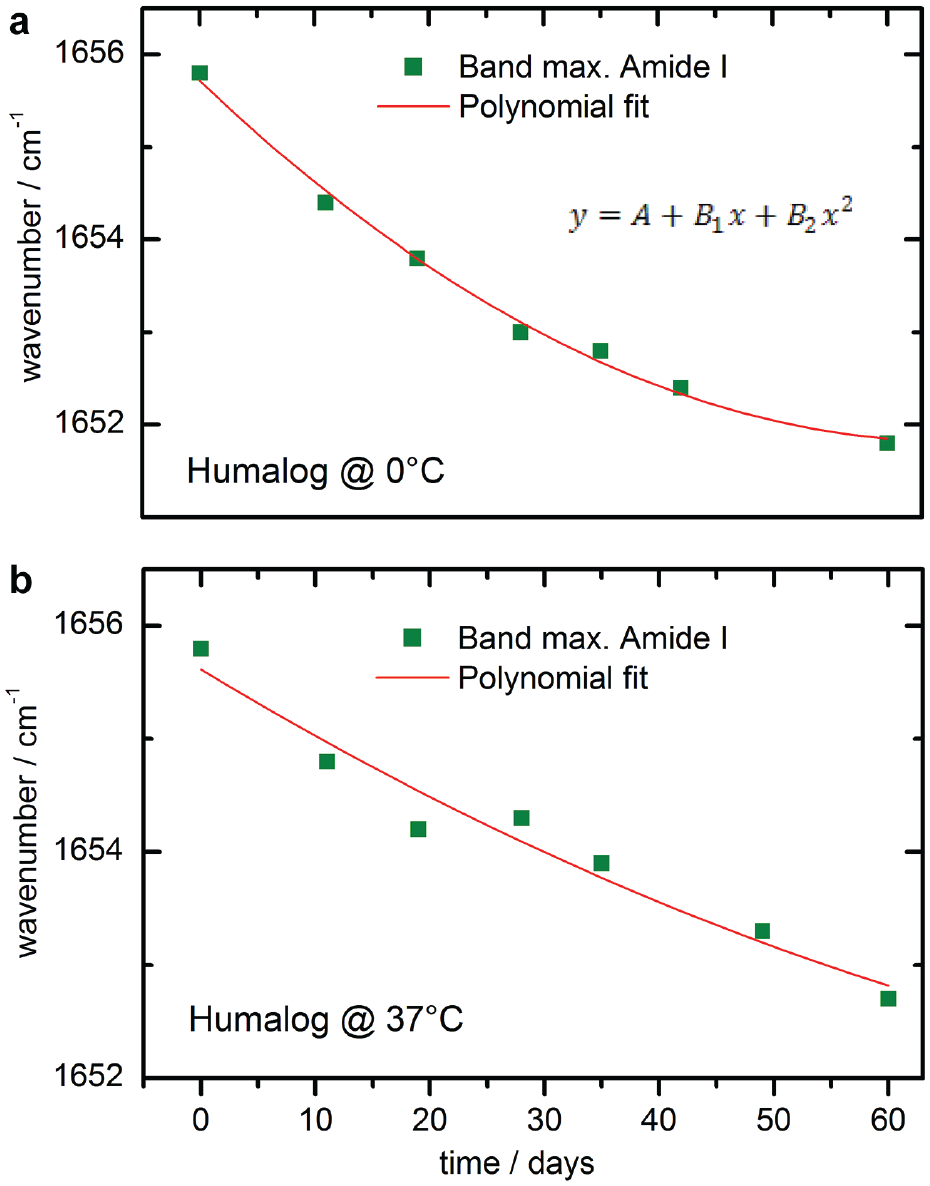
Maximum amide I band positions of two different insulin lispro (Humalog) samples, stored at 0 °C (a) and at 37 °C (b), plotted against the storage time and fitted with a polynomial function.
Stability Comparison of Formulated Insulins and Nonstabilized Pure Proteins from Ultrafiltration
For rating the secondary structure changes in insulin formulations against those observed in pure solutions at neutral pH, an insulin lispro sample from a measurement series at 37°C was chosen to further evaluate the hormone’s structure misfolding under stabilized conditions (see Figure 9). For the stability assessment, dry film spectra of insulin lispro (Humalog) ultrafiltrates (Figure 9a)—illustrating the previously described (Figure 6b) maximum band shifts from around 1644 cm−1 (start spectrum) to 1632 cm−1 (10 weeks)—can be used as a reference for the degree of misfolding. After a storage time of approximately four months, the formulated insulin lispro sample was ultrafiltrated as described earlier. The spectrum of the insulin sample, which had been stored as a formulation and subsequently purified by ultrafiltration, is shown as second from below. It indicates a small amide I band shift and a slight increase in the shoulder around 1627 cm−1, both attributable to the beta sheet secondary structures. To point out the power of second derivative spectral analysis, the results from the resolution enhanced absorbance spectra are shown in Figure 9(b). Characteristic band positions for secondary structure analysis were identified around 1681 and 1627 cm−1 for turns and parallel beta sheets, around 1650 cm−1 for alpha-helices, and around 1637 cm−1 for random coil sections in the protein. Overtime, a decrease of alpha-helical units with a simultaneous increase of beta sheet and a complete loss of random coil structures are apparent, demonstrating the detection of even the smallest ongoing changes in the insulin molecule. The formulation sample after ultrafiltration treatment shows a degree of misfolding and characteristic features comparable to a nonstabilized insulin sample stored in a test cabinet for two to three weeks at 37°C.
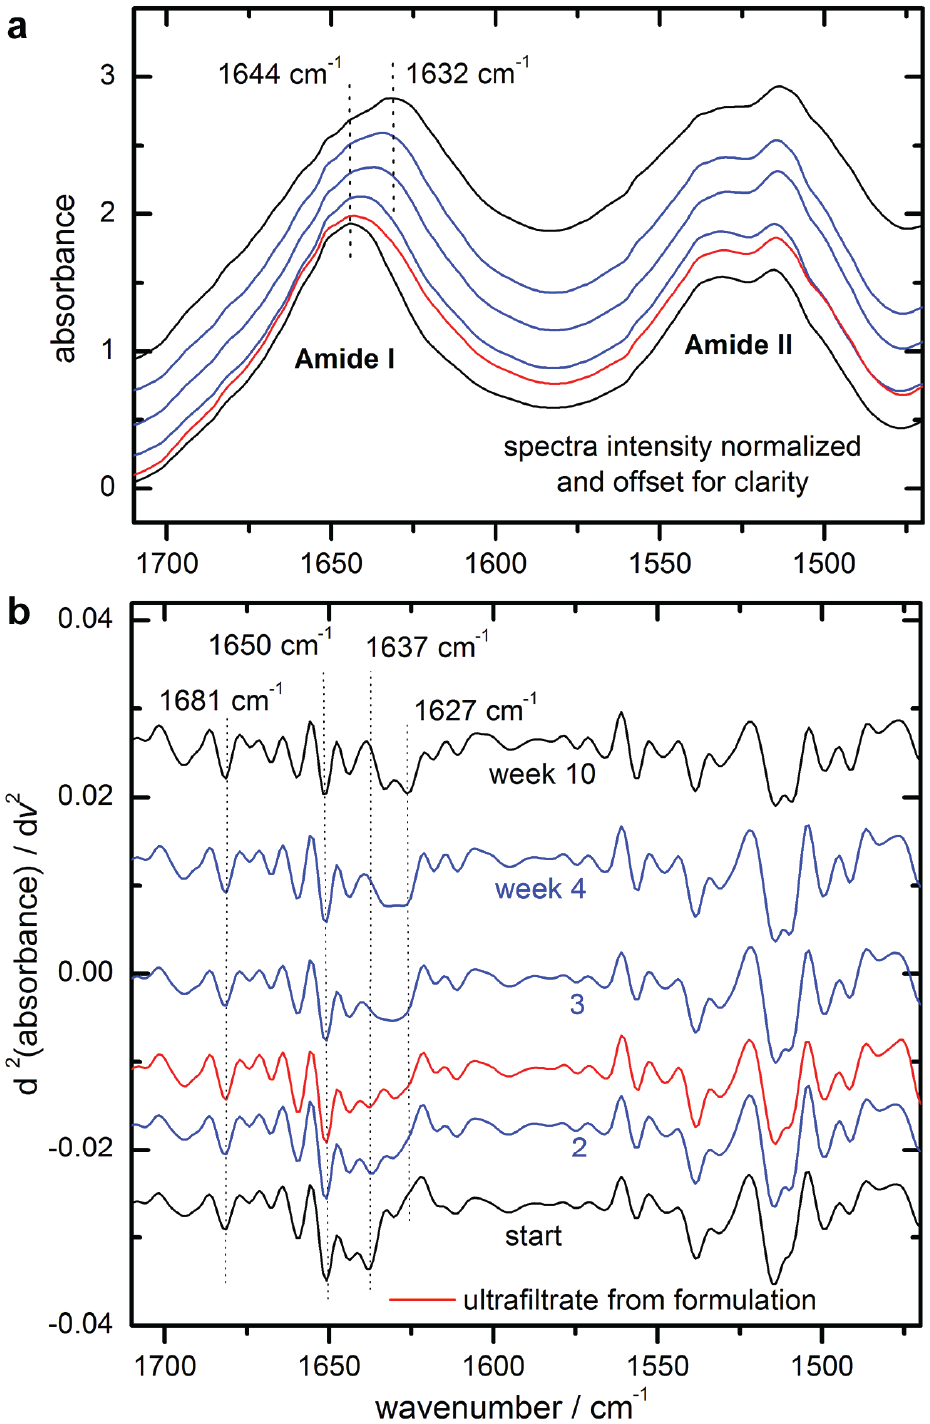
Normalized dry-film attenuated total reflection spectra of ultrafiltrated insulin lispro samples, stored at 37 °C over a time period of ten weeks (week assignments, see b), as well as the spectrum of an ultrafiltrated sample of an insulin lispro formulation after approximately four months (second from below; a); corresponding second derivative spectra with characteristic secondary structure band positions (ultrafiltrated sample third trace from below; b).
Discussion
Dry film ATR IR spectroscopy is introduced for providing insight into the insulin’s bioactivity as controlled by its substructure conformation. Secondary structure changes have been derived from band shape changes, peak shifts of amide I bands, and standardized curve fitting. Individual spectral characteristics are influenced by the sequence of amino acid side chains of the different insulin analogs, the storage temperature, and the presence of stabilizing excipients. Purification of the insulins by ultrafiltration can provide a straightforward band analysis with band integral assessment for individual substructure units compared with the original formulations. A validation of the secondary structure composition was provided by function comparison of the second derivatives of the experimental absorbance spectra and fitted component sum spectra as suggested by Barth et al. 24
Protein misfolding is a first process for which also denaturation has been used for describing this key process. It is clear that the biological potency depends on the structure of the protein 27 and degradation is seen even for misfolded monomers as the first step, after which aggregation and fibrillation occur. The awareness for shelf lifetime reduction, as induced by insulin stability impairment from inappropriate storage conditions of insulin formulations after product release from the manufacturer until usage by people with diabetes, has been brought into focus in a recent critical review from Heinemann et al. 28 The new USP general chapter 1049.1 is recommending requirements for stability studies, especially having an appropriate study design for biopharmaceutical products. 29
Conclusion
A novel assay for the assessment of insulin quality in commercial formulations has been developed by the characterization of changes in the insulin’s secondary structures. This development bears the potential of opening a new dimension in quality control of biopharmaceuticals, similar to recently suggested spectroscopic approaches, 21 which are in contrast to the established USP reference methods by HPLC. 11 ATR IR spectra of this hormone have illustrated minor to major degrees of misfolding under storage conditions at nonrecommended temperatures, supporting the assumption that this process is accompanied with a decrease in biological activity. A loss of insulin potency had been earlier detected by other researchers, as exemplified by animal testing. 23 Those “aging” experiments had also been carried out for insulin formulations stored at 37°C. Our suggested method certainly bears the potential of developing a fast and efficient assay for reliable insulin potency determination. However, at this time we cannot provide a functional dependency of potency decrease on the structural changes, for example, as described by a decrease of the α-helix fractions, as seen in the amide I IR spectra. So far, animal tests (USP rabbit blood sugar testing 30 ) or human subject blood glucose clamp experiments have been suggested for such purpose. A promising alternative approach was recently presented by Delbeck et al, based on exploiting the insulin dependency of a human monocytic cell line under special culture monitoring conditions. 31 Results from such an assay should be further correlated with the “insulin misfolding degree” as determined by dry film IR spectroscopy.
Footnotes
Declaration of Conflicting Interests
The author(s) declared no potential conflicts of interest with respect to the research, authorship, and/or publication of this article.
Funding
The author(s) received no financial support for the research, authorship, and/or publication of this article.