
Abstract
Objective:
The aim of these analyses was to characterize the effect of exercise and meals on glucose concentrations in healthy individuals without diabetes.
Methods:
Healthy individuals without diabetes (age ≥6 years) with nonobese body mass index were enrolled at 12 centers within the T1D Exchange Clinic Network. Participants wore a blinded Dexcom G6 for up to ten days. Throughout this sensor wear, participants completed a daily log indicating times and type of any exercise and start times of meals and snacks.
Results:
A total of 153 participants (age 7-80 years) were included in the analyses. Exercise induced a mean change of −15 ± 18 mg/dL from baseline to nadir sensor glucose level. Mean nadir glucose concentration during nights following exercise days was 82 ± 11 mg/dL compared with 85 ± 11 mg/dL during nights following nonexercise days (P = .05). Mean change from baseline to nadir sensor glucose level during aerobic exercise was −15 ± 18 and −9 ± 12 mg/dL for resistance exercise (P = .25). Overnight nadir glucose during nights following aerobic and resistance exercise was 83 ± 12 and 76 ± 14 mg/dL, respectively (P = .25). Overall mean peak postprandial glucose per participant increased from 93 ± 10 mg/dL premeal to 130 ± 13 mg/dL with an average time to peak glucose per participant of 97 ± 31 minutes. Consumption of alcohol on the day prior did not impact overnight mean or nadir glucose.
Conclusion:
The present analysis provides important data characterizing the effect of exercise and meals on glucose in healthy individuals without diabetes. These data provide a repository to which future therapies, whether pharmacologic or technologic, can be compared.
Introduction
Continuous glucose monitoring (CGM) is increasingly being used both for daily management of patients with type 1 diabetes (T1D) and in clinical research as a primary outcome measure.1,2 Understanding CGM metrics and glucose excursions in healthy persons without diabetes is essential for the interpretation of glucose measurements in persons with diabetes; it is also needed to serve as a benchmark for future research endeavors. Data from healthy individuals without diabetes could help identify thresholds that signify impaired glycemic status in those at risk for diabetes and set the standard for CGM metrics that should be sought in the development of future pharmacologic agents and technologic improvements.3-9 However, there are limited data on CGM-measured glucose concentrations in individuals without diabetes. Most studies of CGM profiles in healthy individuals without diabetes have had small sample sizes or used early generation CGM systems, which were less accurate than the current devices, and rarely explored important factors, such as meals and physical activity, that could impact glycemia.8,10-13 The aim of these analyses was to characterize the effect of exercise and meals on glucose concentrations in healthy individuals without diabetes.
Methods
The study was conducted at 12 diabetes centers within the T1D Exchange Clinic Network, after approval by institutional review boards. Study participants provided written informed consent prior to study participation. Participants were healthy children and adults without diabetes, primarily recruited from family, friends, and neighbors of patients seen in the diabetes clinics. Study methods were described previously, and only pertinent aspects are detailed here. 14 Only participants with no islet autoantibodies, a central lab HbA1c level <5.7%, and at least 72 total hours of CGM data (with at least 24 hours overnight) were included in the analyses.
A Dexcom G6 CGM (Dexcom, Inc., San Diego, CA, United States) in blinded mode (participant unable to see the glucose values) was worn for up to ten days. Throughout this sensor wear, participants completed a daily log indicating times and type of any exercise, start times of meals, snacks and alcohol intake, as well as sleep and wake times.
All glucose outcomes are reported as either means with standard deviations (SD) or medians with interquartile ranges (IQR), depending on variable distribution. For analyses assessing overnight glycemia, daytime was defined as 5:00
All analyses assessing the effect of exercise on glucose levels excluded exercise instances where a meal or snack was consumed within 30 minutes prior to exercise. A CGM sensor-defined hypoglycemia event was defined as at least 15 consecutive minutes with a sensor glucose value <54 mg/dL. The event ended when at least 15 consecutive minutes with a sensor glucose value ≥70 mg/dL occurred, at which point the participant became eligible for another hypoglycemia event. For analyses assessing the effect of antecedent participant-reported exercise during the day on overnight glucose, exercise and nonexercise days were defined as a day with or without exercise from 5:00
Differences in overnight glucose metrics following exercise vs nonexercise days were determined using linear mixed models adjusting for age as a fixed effect and participant as a random effect. In viewing the exercise data by exercise type, there appeared to be differences between aerobic and resistance exercise, so post hoc analyses were performed. Differences in peak, nadir, and change from baseline to nadir glucose during aerobic vs resistance exercise were assessed through linear mixed models adjusting for age and baseline glucose prior to exercise as fixed effects and participant as a random effect. Differences in overnight mean and nadir glucose following aerobic vs resistance exercise were determined through linear mixed models adjusting for age as a fixed effect and participant as a random effect.
Multiple comparisons were adjusted for using the adaptive Benjamini-Hochberg false discovery rate correction method. 15 All P-values are two-tailed. Analyses were performed using SAS 9.4 (SAS Institute).
Results
Of the 153 participants, 66% were female and 84% non-Hispanic white; mean age was 31 ± 21 years, and 33% had a first-degree biological family member with T1D. Mean CGM wear was 192 hours (8 days) and participants completed a median of 10 days of written logs. Additional characteristics are shown in Supplemental Table 2.
Effect of Exercise on CGM Metrics
Seventy-two percent of study participants recorded at least one episode of exercise that met the minimum criteria for inclusion in analysis, accounting for 451 discrete exercise sessions among all study participants. Median reported exercise duration was 45 minutes (IQR: 30-60 minutes). Figure 1(a) shows the distribution of glucose during exercise. Table 1 shows the effect of exercise on CGM profiles, which was similar across age groups. Prior to exercise, mean glucose was 99 ± 12 mg/dL and exercise induced a mean change of −15 ± 18 mg/dL from baseline to nadir sensor glucose level. Despite 38% (173/451) of exercise sessions resulting in a drop in sensor glucose by more than 15 mg/dL, a sensor-defined hypoglycemic event occurred during only 0.4% (2/451) of exercise sessions (two different participants). Mean glucose concentration during nights following exercise days was 97 ± 10 mg/dL compared with 100 ± 10 mg/dL during nights following nonexercise days (P = .05) and mean nadir glucose during nights following exercise days was 82 ± 11 mg/dL compared with 85 ± 11 mg/dL following nonexercise days (P = .05). Results were similar whether exercise was performed during the morning/early afternoon or late afternoon/evening, and whether the participant was overweight or not (data not shown). Glycemic response to exercise was also similar between males and females (data not shown).
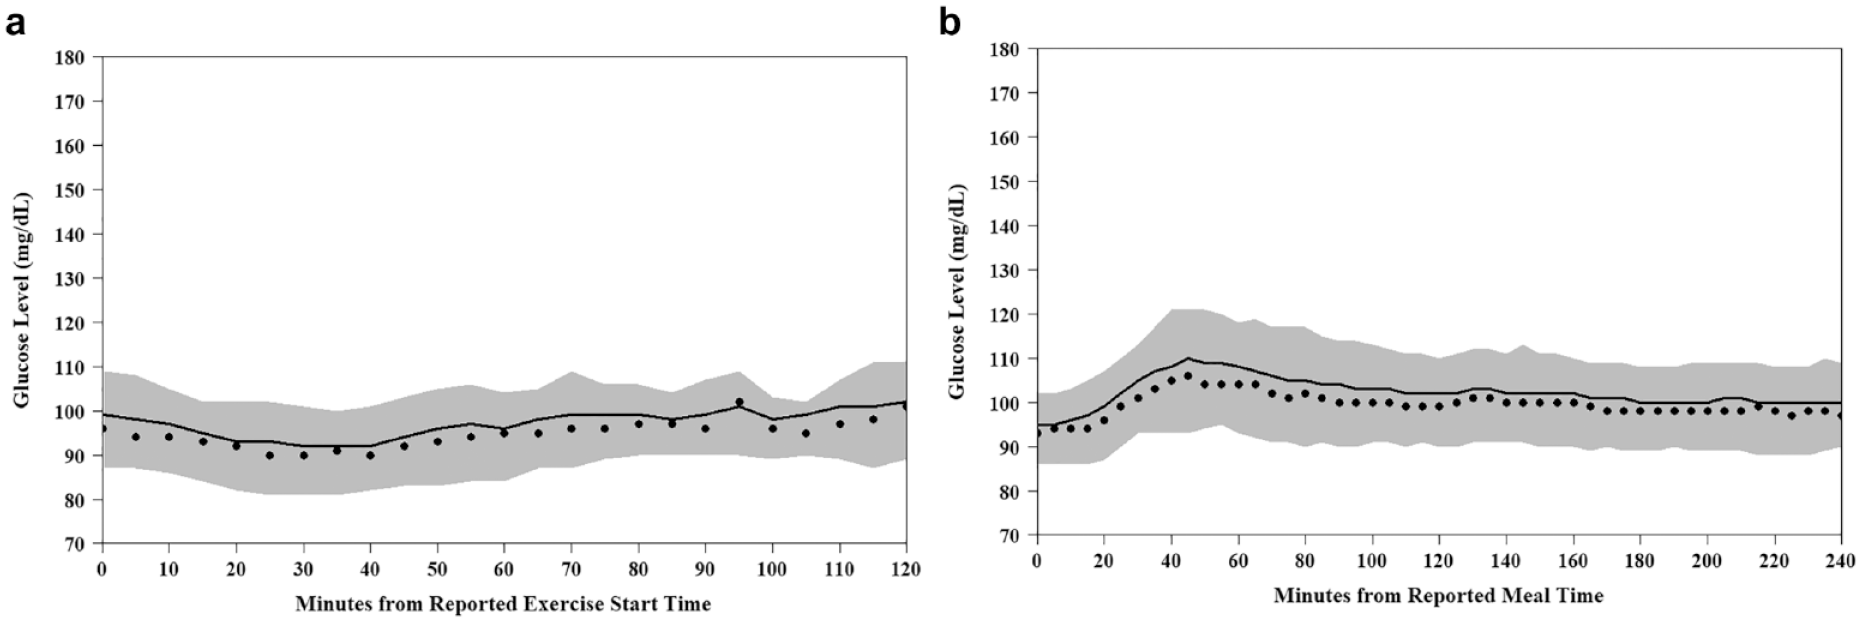
(a) Tracing of exercise glucose (exercise instances where a snack was consumed 30 minutes prior to the start of exercise were excluded [N = 451 exercise sessions]). (b) Tracing of postprandial glucose (analysis was limited to only days in which all three main meals—breakfast, lunch, and dinner—were logged, each of the three meals were separated by at least four hours between the current and the next meal [or alcoholic drink], and a minimum of one hour of postprandial continuous glucose monitoring data existed [N = 306 meals]). Black dots represent median glucose level; solid black line represents mean glucose level; and gray band represents the interquartile range of glucose levels.
Effect of Exercise on Glucose.
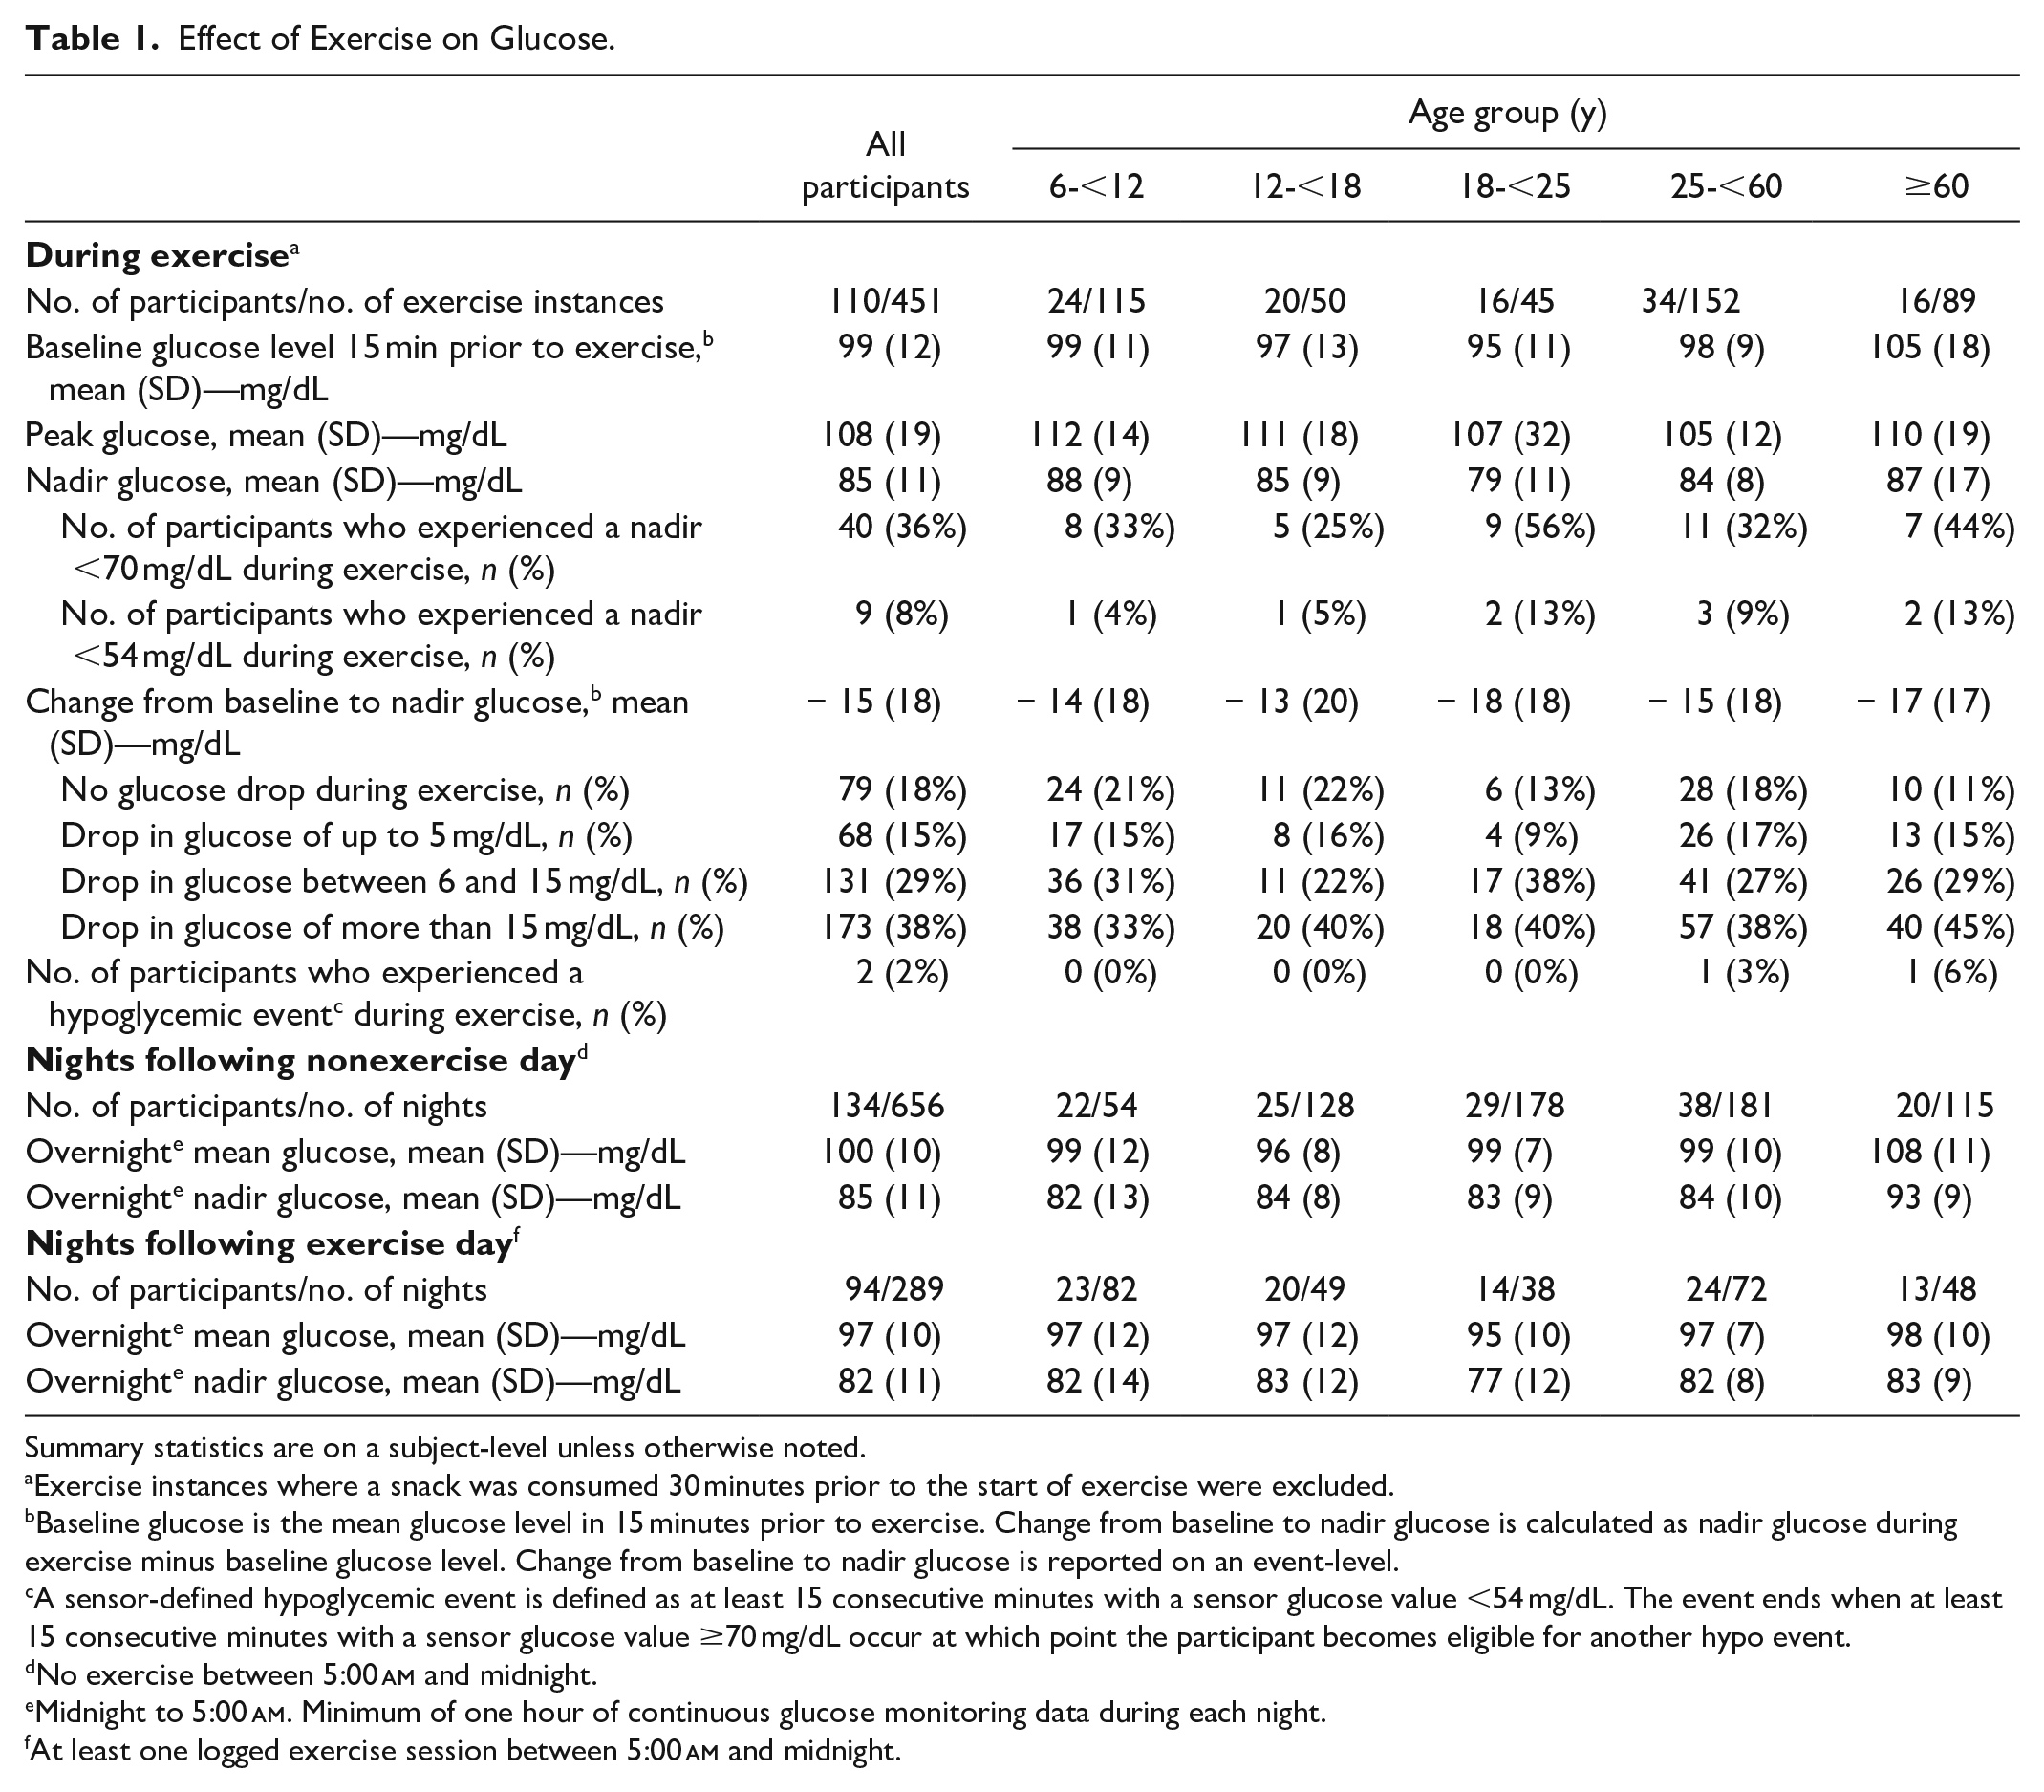
Summary statistics are on a subject-level unless otherwise noted.
Exercise instances where a snack was consumed 30 minutes prior to the start of exercise were excluded.
Baseline glucose is the mean glucose level in 15 minutes prior to exercise. Change from baseline to nadir glucose is calculated as nadir glucose during exercise minus baseline glucose level. Change from baseline to nadir glucose is reported on an event-level.
A sensor-defined hypoglycemic event is defined as at least 15 consecutive minutes with a sensor glucose value <54 mg/dL. The event ends when at least 15 consecutive minutes with a sensor glucose value ≥70 mg/dL occur at which point the participant becomes eligible for another hypo event.
No exercise between 5:00
Midnight to 5:00
At least one logged exercise session between 5:00
Participants were asked to categorize exercise as either aerobic, resistance, or both, allowing for assessment of glycemic responses by exercise type (Table 2). Mean peak glucose was 108 ± 20 mg/dL during aerobic exercise vs 102 ± 16 mg/dL during resistance exercise (P = .77) and nadir glucose was 84 ± 11 vs 86 ± 11 mg/dL, respectively (P = .25). Mean change from baseline to nadir was −15 ± 18 mg/dL during aerobic exercise compared with −9 ± 12 mg/dL during resistance exercise (P = .25). No sensor-defined hypoglycemic events occurred during resistance exercise or combined resistance and aerobic exercise; only two hypoglycemic events occurred during aerobic exercise. Overnight mean glucose following aerobic exercise averaged 97 ± 10 mg/dL, while overnight mean glucose following resistance exercise averaged 94 ± 9 mg/dL (P = .25). Overnight nadir glucose during nights following aerobic exercise was 83 ± 12 vs 76 ± 14 mg/dL following resistance exercise (P = .25).
Effect of Exercise on Glucose by Exercise Type.
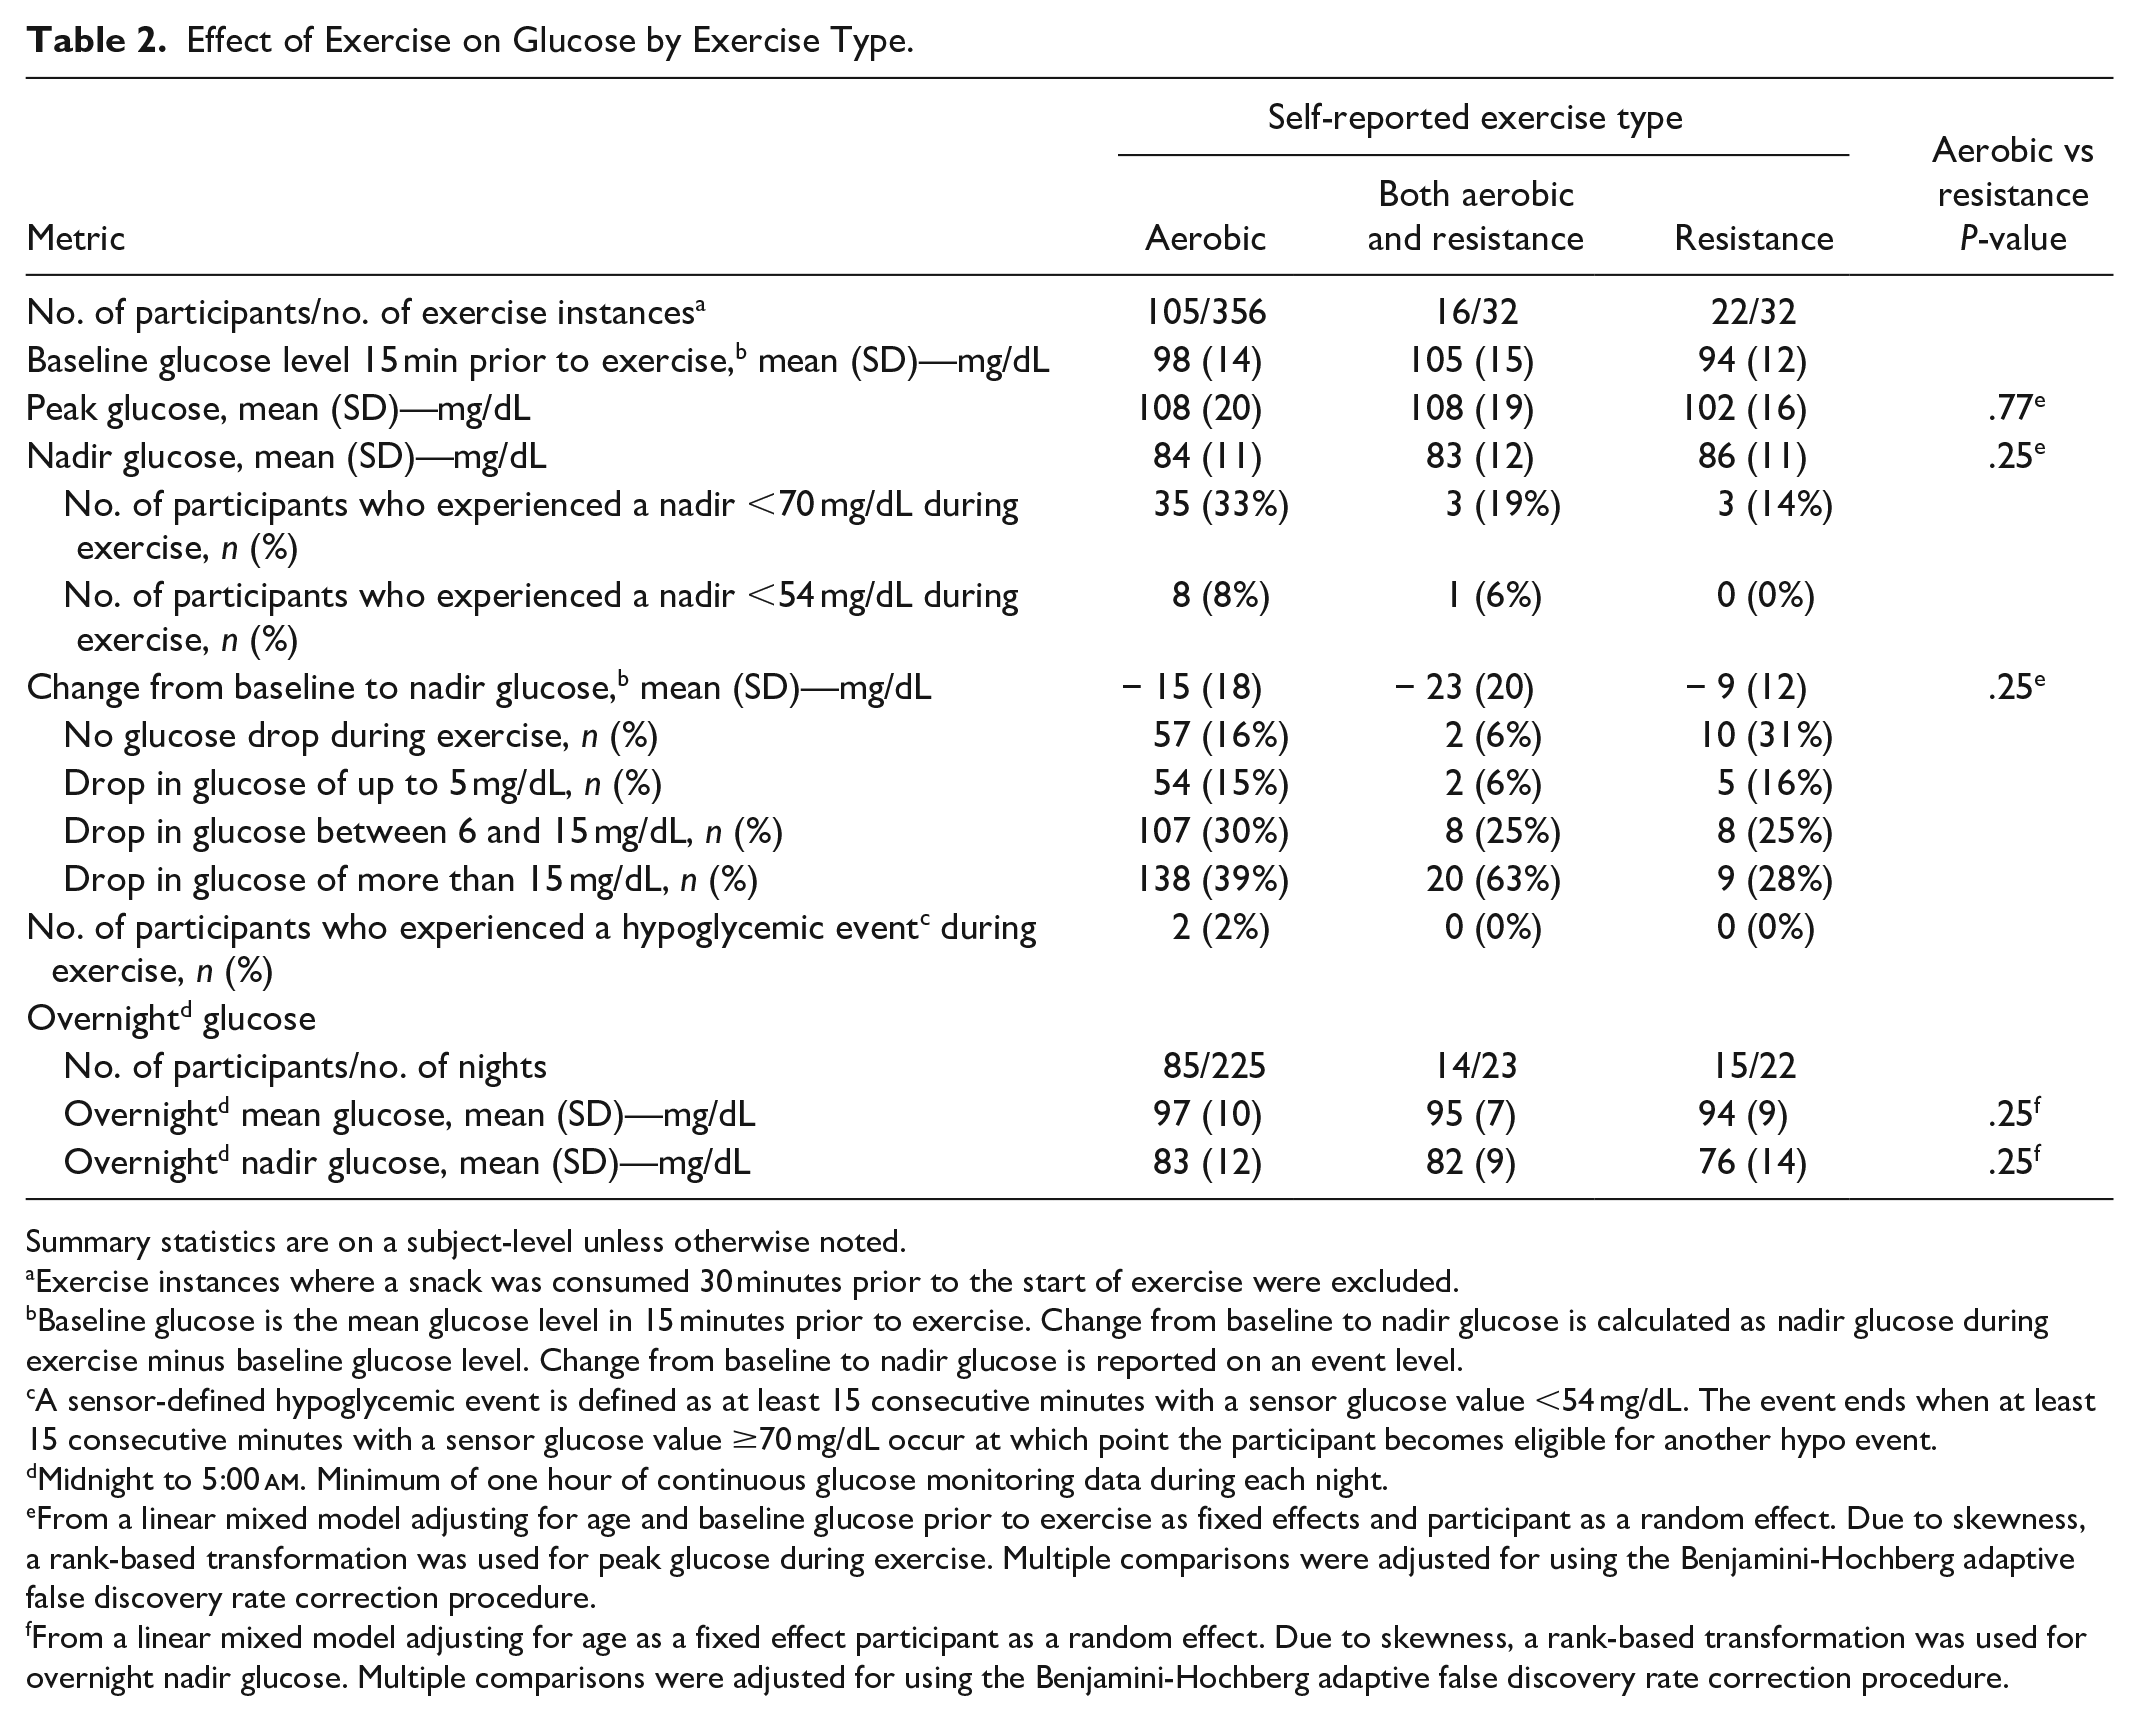
Summary statistics are on a subject-level unless otherwise noted.
Exercise instances where a snack was consumed 30 minutes prior to the start of exercise were excluded.
Baseline glucose is the mean glucose level in 15 minutes prior to exercise. Change from baseline to nadir glucose is calculated as nadir glucose during exercise minus baseline glucose level. Change from baseline to nadir glucose is reported on an event level.
A sensor-defined hypoglycemic event is defined as at least 15 consecutive minutes with a sensor glucose value <54 mg/dL. The event ends when at least 15 consecutive minutes with a sensor glucose value ≥70 mg/dL occur at which point the participant becomes eligible for another hypo event.
Midnight to 5:00
From a linear mixed model adjusting for age and baseline glucose prior to exercise as fixed effects and participant as a random effect. Due to skewness, a rank-based transformation was used for peak glucose during exercise. Multiple comparisons were adjusted for using the Benjamini-Hochberg adaptive false discovery rate correction procedure.
From a linear mixed model adjusting for age as a fixed effect participant as a random effect. Due to skewness, a rank-based transformation was used for overnight nadir glucose. Multiple comparisons were adjusted for using the Benjamini-Hochberg adaptive false discovery rate correction procedure.
Postprandial Glycemic Excursions
Fifty-six participants had data that allowed exploration of the effect of meals on glucose profiles (Table 3). Overall mean peak postprandial glucose per participant increased from 93 ± 10 mg/dL premeal to 130 ± 13 mg/dL with an average time to peak glucose per participant of 97 ± 31 minutes. A median of 67% (IQR: 67%-83%) of meals had a postprandial peak below 140 mg/dL and a median of 83% (IQR: 67%-100%) of meals had a postprandial peak below 150 mg/dL. Mean postprandial peak CGM glucose after breakfast was 124 ± 20 mg/dL, while mean postprandial peak CGM glucose after lunch and dinner were 134 ± 22 and 133 ± 22 mg/dL, respectively. Figure 1(b) shows the distribution of glucose during the first two hours after a reported meal time. There was wide variation in time to peak across different age groups (Table 3). Consumption of alcohol on the day prior did not impact overnight mean or nadir glucose (Supplemental Table 3).
Effect of Meals on Glucose.
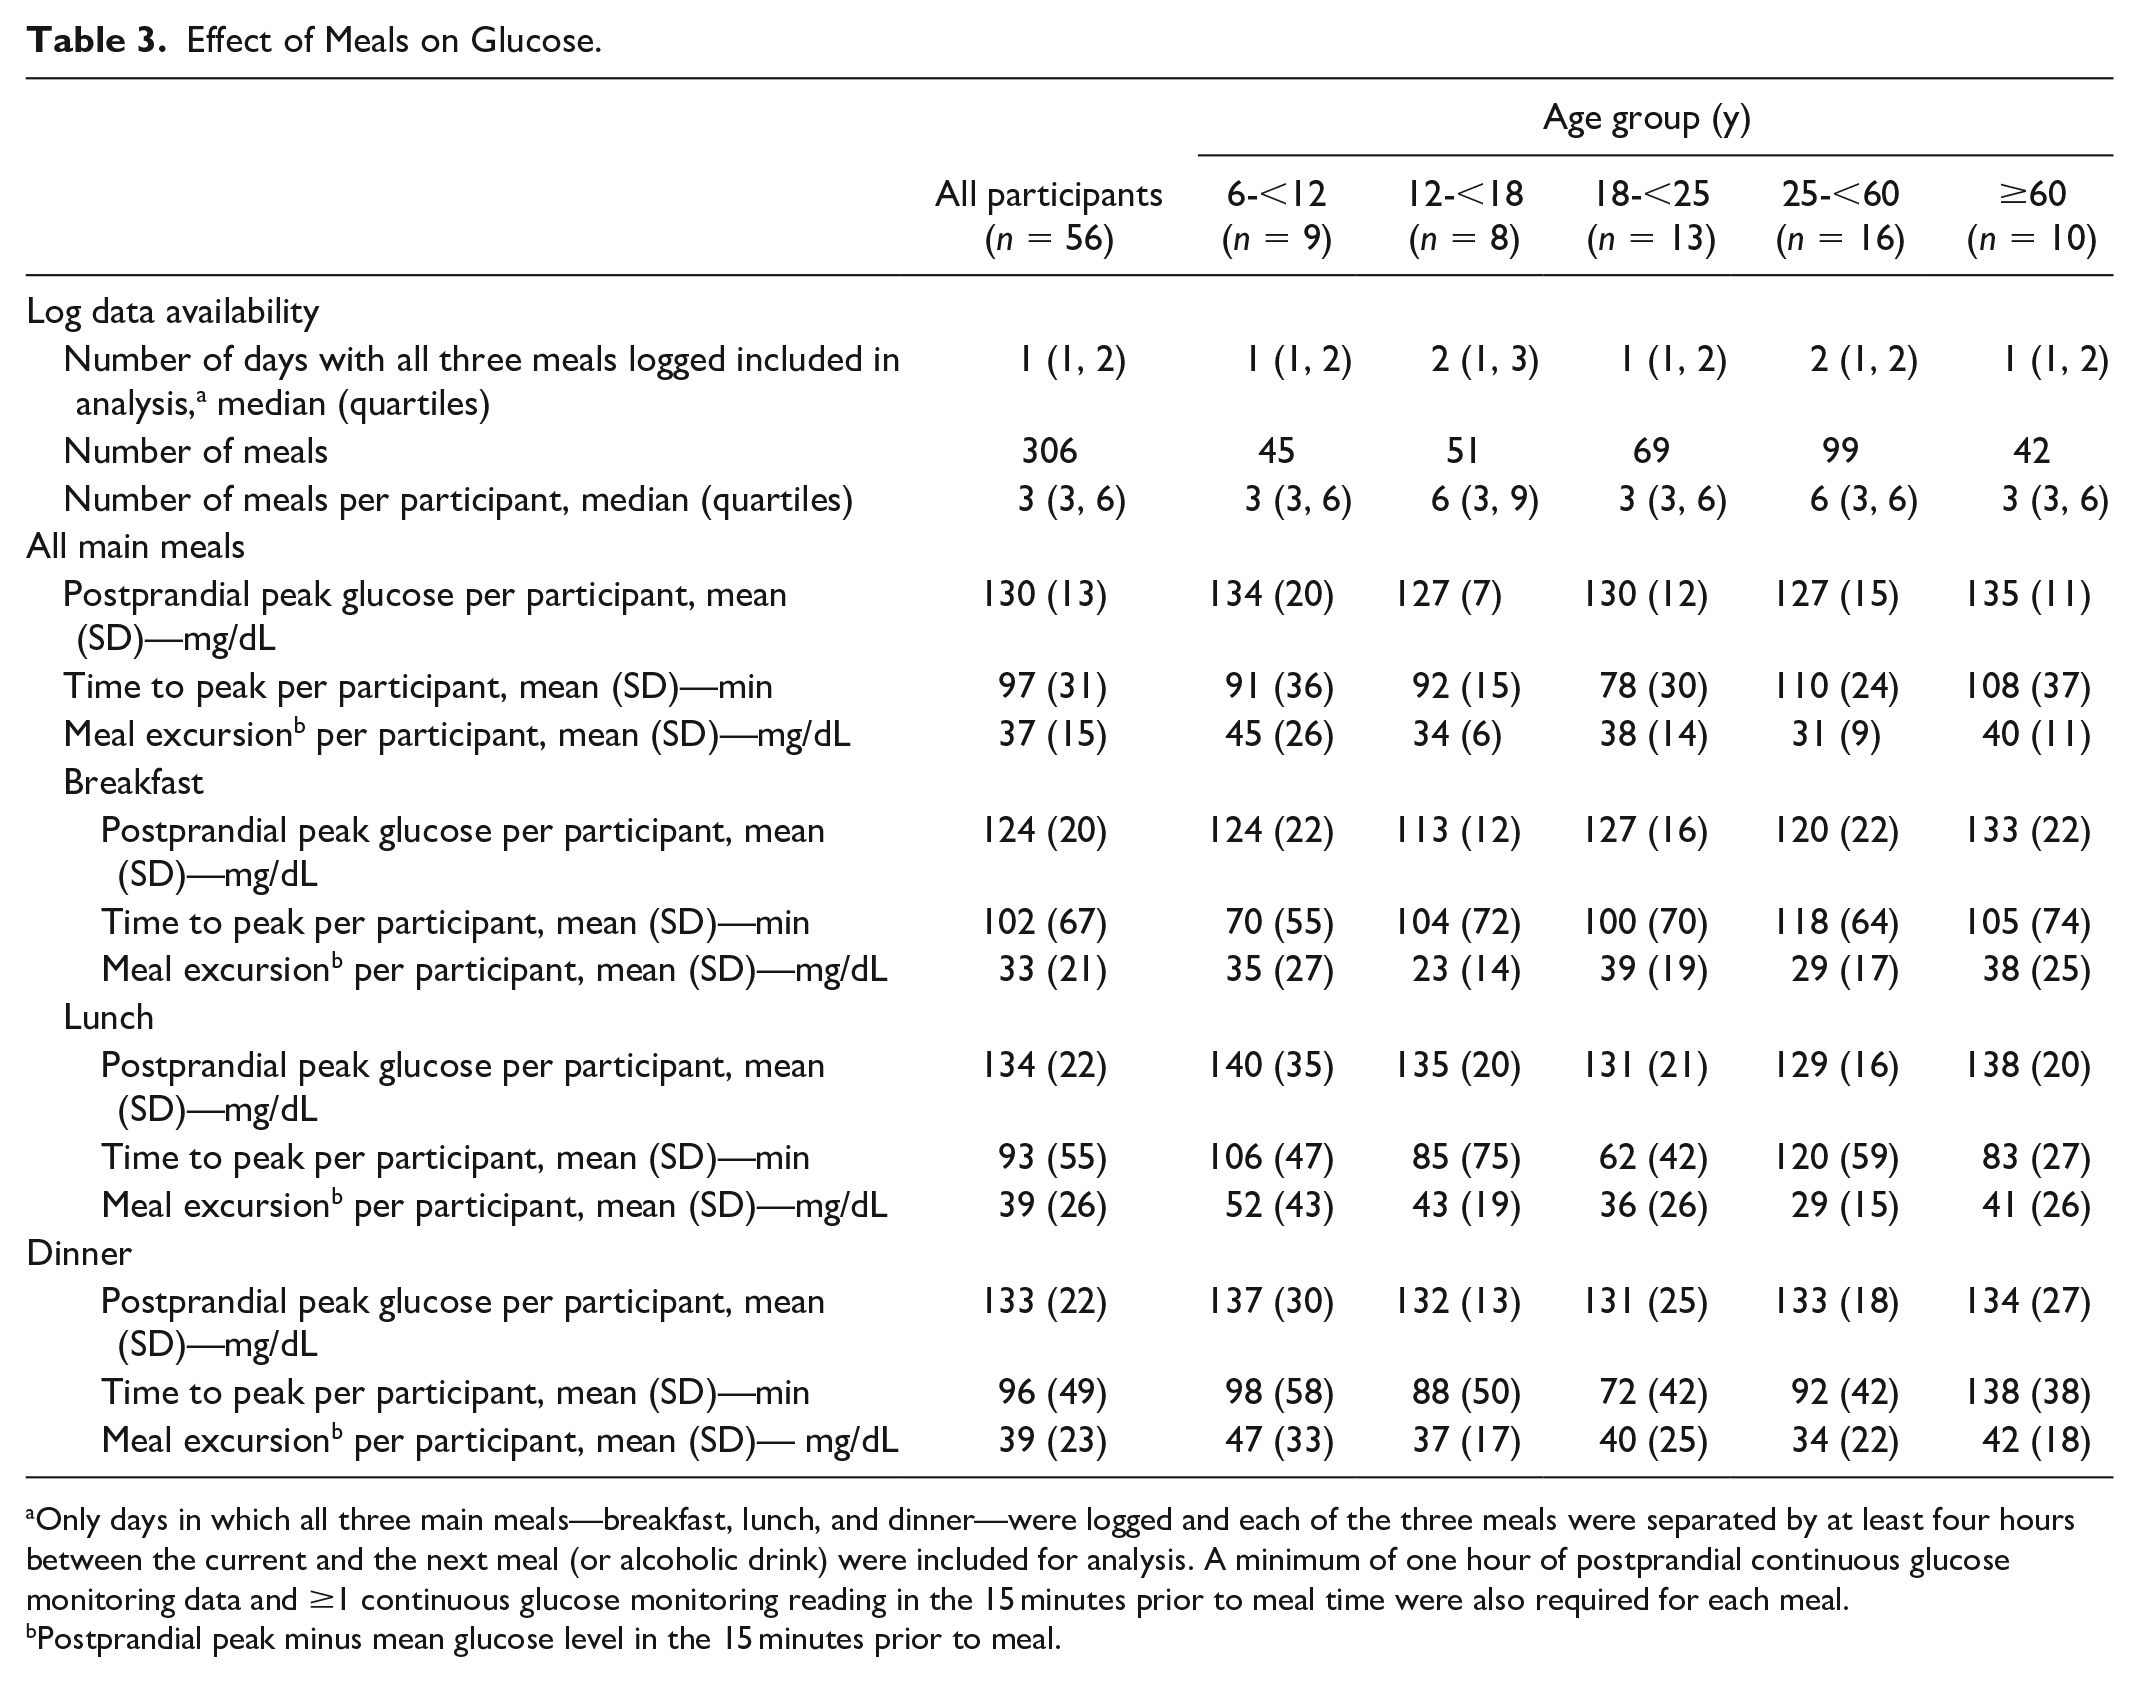
Only days in which all three main meals—breakfast, lunch, and dinner—were logged and each of the three meals were separated by at least four hours between the current and the next meal (or alcoholic drink) were included for analysis. A minimum of one hour of postprandial continuous glucose monitoring data and ≥1 continuous glucose monitoring reading in the 15 minutes prior to meal time were also required for each meal.
Postprandial peak minus mean glucose level in the 15 minutes prior to meal.
Early Morning Glycemia
A dawn effect was not observed in this cohort as mean glucose levels did not rise at either 3:00
Discussion
While prior studies have assessed sensor glucose levels and variability in healthy individuals without diabetes,8,10-13 the present analysis sought to further define two of the main variables known to impact glycemia—exercise and meals. The small change from baseline to nadir glucose (−15 mg/dL) during exercise supports the exquisite interaction between the intact beta and alpha cells among healthy individuals, which allows glucose levels to remain relatively steady despite changes in activity level. Similarly, nocturnal glycemia did not appear to be clinically different after exercise and nonexercise days (mean overnight nadir 82 vs 85 mg/dL, respectively).
The differential glucose lowering effect of aerobic vs resistance exercise in people with T1D is well studied—aerobic exercise tends to reduce glucose levels, while resistance exercise tends to increase glucose during exercise. 16 In this cohort of healthy individuals, glycemic metrics did not appear to be clinically different comparing exercise types.
Only 37% of the cohort had a log with at least one day that included greater than or equal to three meals recorded and sufficient CGM data around each meal, limiting the data available for the analysis of postprandial glycemic excursions. Due to the fact that at least four hours between meals was required for inclusion in the analyses, it is possible that participants who frequently snack or eat four or more small meals a day were not represented. What is striking is the relatively small excursion in sensor glucose following meals, highlighting the balance that occurs in normal physiology in regard to insulin secretion following meals in response to rising glucose levels. Surprisingly, mean postprandial CGM glucose was highest after lunch and dinner compared with breakfast in our study which is contradictory to a study by Freckmann and colleagues who reported highest postprandial CGM glucose peaks after breakfast. 11 However, in that study, it should be noted that all meals were fixed in calories and composition, whereas the present analysis is a real world, outpatient, unsupervised study. Differences in meal timing, as well as the possibility of unreported mid-day snacks, may also have led to this difference. While there was some variability in postprandial glucose levels by age group, the clinical significance of this finding remains unknown.
Risk of overnight hypoglycemia following alcohol ingestion has been well documented in those with T1D. 17 As anticipated, in this population of healthy individuals without diabetes, no difference in overnight glucose based on alcohol intake was identified. However, it is possible that participants may have underreported alcohol intake or decreased alcohol intake for this short duration study, minimizing our ability to find differences between these conditions.
Strengths of our study include a large sample size, multiple centers conducting the study, use of the latest generation CGM technology and up to 10 days of CGM wear time. However, the study is not without limitations. Data regarding meals and exercise were from diary entries made by participants; therefore, it is possible that not all meals, snacks, alcohol intake, or exercise were accurately recorded. The confounding effect of unreported meals or snacks consumed before or during exercise or the continued effect of meals consumed more than 30 minutes prior to exercise on glucose levels cannot be ruled out. Furthermore, these diaries did not capture information on quantity of carbohydrate or fat content of meals.
Recognizing that two of the largest challenges to glycemic control faced by individuals with T1D are the impact of physical activity and meals, the present analysis provides important data characterizing the effect of exercise and meals on glucose in healthy individuals without diabetes. These data provide a repository to which future therapies, whether pharmacologic or technologic, can be compared.
Supplemental Material
Online_Supplemental_Material – Supplemental material for Effect of Exercise and Meals on Continuous Glucose Monitor Data in Healthy Individuals Without Diabetes
Supplemental material, Online_Supplemental_Material for Effect of Exercise and Meals on Continuous Glucose Monitor Data in Healthy Individuals Without Diabetes by Stephanie N. DuBose, Zoey Li, Jennifer L. Sherr, Roy W. Beck, William V. Tamborlane and Viral N. Shah in Journal of Diabetes Science and Technology
Footnotes
Author Contributions
SND researched data and wrote/edited the manuscript. ZL performed statistical analyses and wrote/edited the manuscript. JLS, RWB, WVT, and VNS researched data, contributed to discussion, and reviewed/edited the manuscript.
Declaration of Conflicting Interests
The author(s) declared the following potential conflicts of interest with respect to the research, authorship, and/or publication of this article: SND, ZL, JLS, RWB, and WVT have no disclosures to report. VNS has received research grants and sits on the Advisory Board for Dexcom and Sanofi US.
Funding
The author(s) disclosed receipt of the following financial support for the research, authorship, and/or publication of this article: This work was supported by the Leona M. and Harry B. Helmsley Charitable Trust.
Supplemental Material
Supplemental material for this article is available online.
References
Supplementary Material
Please find the following supplemental material available below.
For Open Access articles published under a Creative Commons License, all supplemental material carries the same license as the article it is associated with.
For non-Open Access articles published, all supplemental material carries a non-exclusive license, and permission requests for re-use of supplemental material or any part of supplemental material shall be sent directly to the copyright owner as specified in the copyright notice associated with the article.