
Abstract
Background:
We describe the impact of influenza on medical outcomes and daily activities among people with and without type 2 diabetes mellitus (T2DM).
Methods:
Retrospective cohort analysis of a US health plan offering a digital wellness platform connecting wearable devices capable of tracking steps, sleep, and heart rate. For the 2016 to 2017 influenza season, we compared adults with T2DM to age and gender matched controls. Medical claims were used to define cohorts and identify influenza events and outcomes. Digital tracking data were aggregated at time slices of minute-, day-, week-, and year-level. A pre-post study design compared the peri-influenza period (two weeks before and four weeks after influenza diagnosis) to the six-week preceding period (baseline).
Results:
A total of 54 656 T2DM and 113 016 non-DM controls were used for the study. People with T2DM had more influenza claims, vaccinations, and influenza antivirals per 100 people (1.96% vs 1.37%, 34.3% vs 24.3%, and 27.1 vs 22 respectively, P < .001). A total of 1086 persons with T2DM and 1567 controls had an influenza claim (47.4% male, median age 54, 6.4% vs 7.8% trackers, respectively). Glycemic events, pneumonia, and ischemic heart disease increased over baseline during the peri-influenza period for T2DM (1.74-, 7.4-, and 1.6-fold increase respectively, P < .01). In a device wearing subcohort, we observed 10 000 fewer steps surrounding the influenza event, with the lowest (5500 steps) two days postinfluenza. Average heart rate increased significantly (+5.5 beats per minute) one day prior to influenza.
Conclusion:
Influenza increases rates of pneumonia, heart disease, and abnormal glucose levels among people with T2DM, and negatively impacts daily activities compared to controls.
Keywords
Introduction
Each year, influenza results in a substantial health-economic burden worldwide.1,2 For example, in the United States in 2018, influenza affected just under 30 million people and led to almost 400 000 hospitalizations and 35 500 deaths with estimated costs of more than $11.2 billion.3,4 Although infection with the influenza virus typically causes a self-limited illness with high fever, myalgias, and malaise, for vulnerable populations including individuals living with diabetes, influenza can progress to more serious consequences, such as pneumonia, myocardial infarction, stroke, and an increased risk of premature death.5-9
The most effective way to prevent the disease is vaccination. 10 Pre-exposure or postexposure prophylaxis withantivirals is possible but depends on several factors, eg, individual factors, type of exposure, and risk associated with the exposure. For prevention, especially those at increased risk from influenza complications, vaccination is recommended on an annual basis.11-13
However, in terms of improving interventions for high-risk population such as people with diabetes, there are limitations to the current understanding of the impact of influenza especially at an early stage. Studies that measure influenza disease burden based on laboratory confirmation may understate outcomes because of the infrequent testing, 14 while the use of claims-based data or death records alone can skew the findings toward people with more severe influenza-related outcomes and later in the course of the infection. Less is known about the impact of early influenza infection on day to day activities and for people who do not develop the more serious complications associated with it. 15
Patient Generated Health Data (PGHD) derived from consumer digital mobile technologies, including wearable sensors, could potentially fill the information gap of how early influenza infection affects daily behaviors. 16 Thus far, most research on PGHD has been limited to small sample populations or has used simulated, nonreal-world scenarios to test device accuracy and reliability.17-19
The aim of this study was to use PGHD linked with conventional real-world medical claims information to describe the effects on sleep, activity, and other behaviors of influenza infection for people with type 2 diabetes mellitus (T2DM). For this, we used a limited dataset from a large US health company that provides members with a digital wellness app connecting a variety of consumer mobile devices.
Setting
We used a limited dataset that included medical claims and wearable device data from a nationwide health company providing commercial insurance in the United States with participant data between September 2014 and June 2017. This health company provides a digital wellness smartphone application (Apple iOS and Google Android) that connects a variety of consumer wearable fitness devices. The devices passively collect behavioral activity data as steps taken, sleep quality, and heart rate. This analysis covers June 1, 2016 to June 1, 2017. Aggregate summaries of medical claims and behavioral activity data for individuals with a diagnosis of T2DM were compared to age and gender matched controls without diabetes.
The case-control pre-post analyses focus on participants with a documented diagnosis of influenza (determined by International Classification of Disease [ICD]-9/10 diagnosis codes) during the above period. We defined the peri-influenza period as two weeks before and four weeks after an incident influenza diagnosis and compared this period with six-week baseline control period that occurred immediately before. We added supplemented medical claims and behavioral activity data for people with T2DM and for nondiabetic controls.
Participants
Participants were adults (age ≥18 years), with commercial insurance coverage. Inclusion in the retrospective cohort and case-control pre-post analysis required coverage for the entire analysis period to reduce the possibility of missing information or medical events occurring outside of the coverage. A separate pre-post analysis without the coverage requirement examined only activity data for two weeks before and after an incident influenza diagnosis.
Individuals with T2DM had at least one diagnosis code from ICD-9 or -10 documented. For T2DM, we used ICD-9 code 250 and ICD-10 code E11. Non-T2DM controls were selected to be gender and age matched (stratified by age groups of 18-25, 25-40, 40-50, 50-65, and ≥ 65 years).
The research uses an existing limited dataset from a large health company authorized for research use and does not involve any interaction with human subjects. The data were kept on a secure location on servers under Evidation Health’s control and were accessible only by selected individuals at Evidation Health. The research has been reviewed and exempted by the Institutional Review Board at Solutions IRB (http://www.solutionsirb.com).
Variables
Table 1 shows the variable types and data sources considered in the analyses. In total, 778 variables were included, covering demographics, disease conditions, medication use, and behavioral activities from consumer wearables. We linked US Census data to individual zip codes to obtain neighborhood characteristics for race, ethnicity, and socio-economic status markers for each participant.
Medical Claims and Activity Derived Variables in the Analysis.
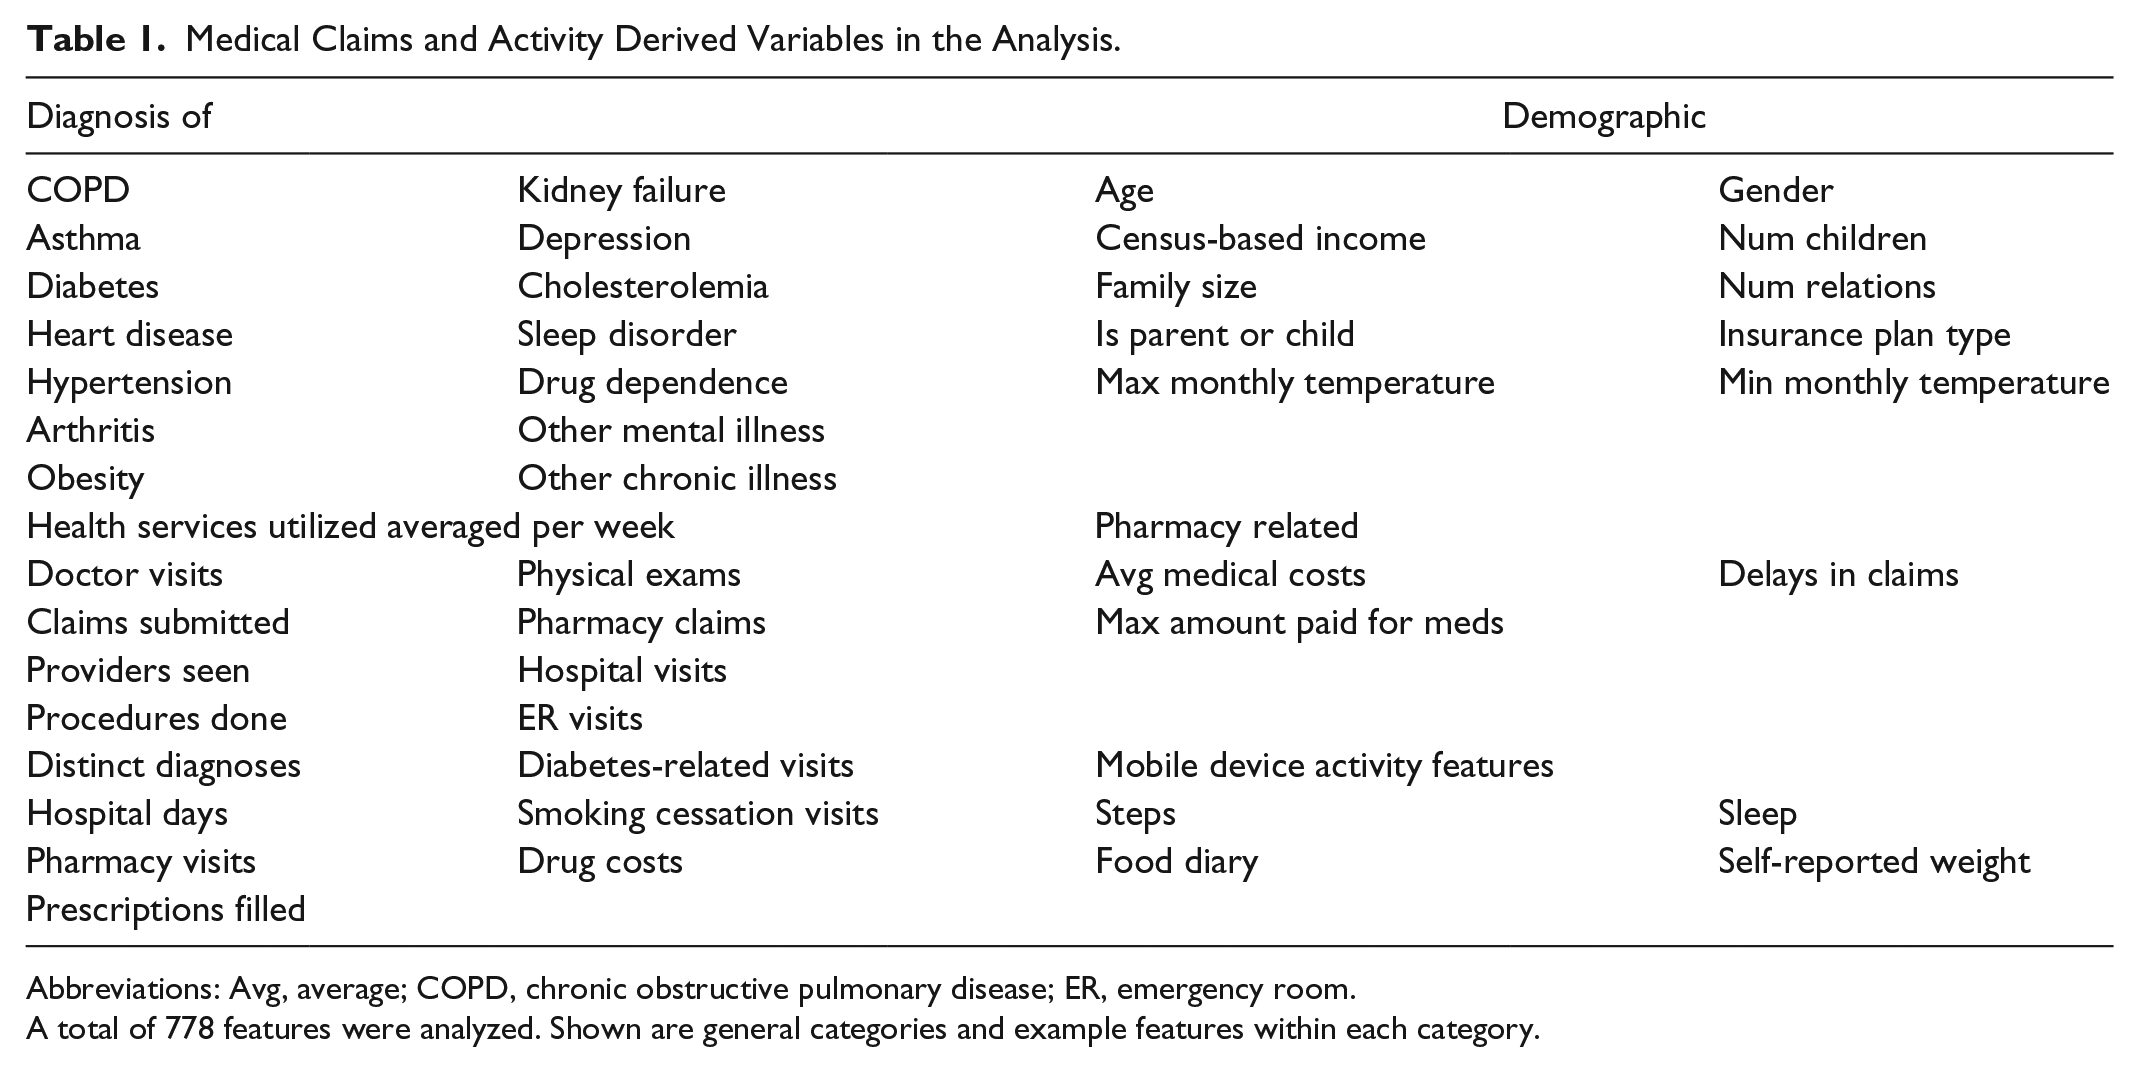
Abbreviations: Avg, average; COPD, chronic obstructive pulmonary disease; ER, emergency room.
A total of 778 features were analyzed. Shown are general categories and example features within each category.
Medical claims data generated from visits to clinicians, health care facilities, and pharmacies included ICD diagnosis codes, Current Procedural Terminology (CPT) codes, and pharmacy drug data. Visits types (office, emergency room, and hospital), prescription medications for diabetes (oral medications and injectables), and associated chronic conditions (coronary artery disease, respiratory diseases like asthma and chronic obstructive lung disease) were aggregated over the analysis period.
Medical outcomes included pneumonia, acute coronary syndromes, sepsis syndromes, venous thrombo-embolic disease, acute kidney injury, and encephalopathy. Procedures such as mechanical ventilation, angioplasty, or stent placement were identified with CPT codes. Treatment for influenza or pneumonia was noted by the use of specific antiviral agents (oseltamivir, zanamivir, amantadine, or rimantadine) or antibacterial agents (penicillins, cephalosporins, fluoroquinolones, and macrolides) respectively. Diabetes-specific outcomes included events related to hyperglycemia (abnormal glucose levels, ketoacidosis, and hyperosmolar nonketotic coma) as well as hypoglycemia.
Behavioral activity data for steps, sleep, and heart rate were aggregated at different time scales of minutes, hourly, day, week, or year level. For each time scale, the mean, min, or max of different distribution descriptors was used as variables of analysis. Diarized food tracking or caloric data were aggregated over the year.
Statistical Methods
Standard statistical approaches were used to identify and remove outliers or incorrect labels. Missing data on predictors were imputed with mean values when appropriate.
To identify outcomes associated with influenza infection, per-individual pre/postchanges, reported as gain scores, were calculated within peri-influenza periods related to health care utilization, excess morbidity, and diabetes-related and behavioral activity endpoints. 20 In the case of behavioral data, the repeated measurement nature of the dataset allows computing within-subject changes as compared to baseline.
Between-group comparisons were performed with appropriate statistical tests (Mann-Whitney U, t-test, or test of proportions). P-values were selected based on false discovery rates less than 10% to minimize the type I error rate from multiple comparisons. For the pre/postframework, we report rate ratios (with corresponding 95% confidence intervals) of the peri-influenza period to baseline for people with T2DM and controls independently. We compare gain scores between people with T2DM and controls as described above. We did not control for vaccination status because of problems around censoring of vaccination data from medical claims.
Time series visualization of step and sleep activity was performed on a subcohort of people with activity rich data centered around a documented influenza infection. Missing values for the activities were imputed and then the moving average computed with smoothing over a 14-day window centered around the influenza event.
Results
More than 2.3 million adults from the health company were in the limited dataset from September 2014 to June 1, 2017. Filtering on ICD diagnosis codes for diabetes mellitus and age ≥18 identified 186 134 potential participants of which 54 656 had T2DM and coverage during the analysis period. We age and gender matched 113 016 non-T2DM controls (Figure 1).
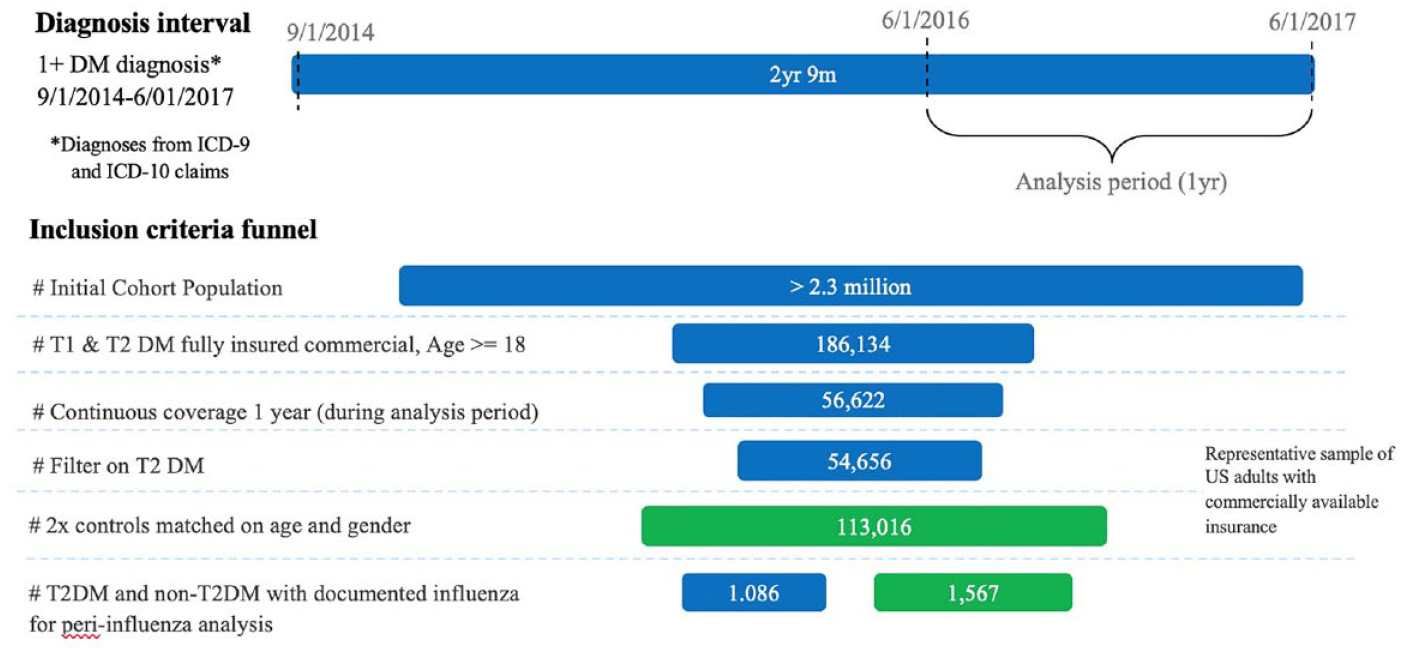
Overview of the cohort selection strategy for people with type 2 diabetes mellitus along with matched age and gender nondiabetic controls.
People with T2DM had a higher influenza disease burden and utilized more health services (ER and hospital visits) compared to controls (Table 2). From US Census data, individuals with T2DM also came from neighborhoods with lower median household incomes and fewer high school graduates. As expected, lipids disorders and hypertension were more prevalent in this group compared to controls.
Descriptive Characteristics of the Full Cohort and Tracker Cohort of People With Type 2 Diabetes Mellitus and Those Who Do Not Have Diabetes.
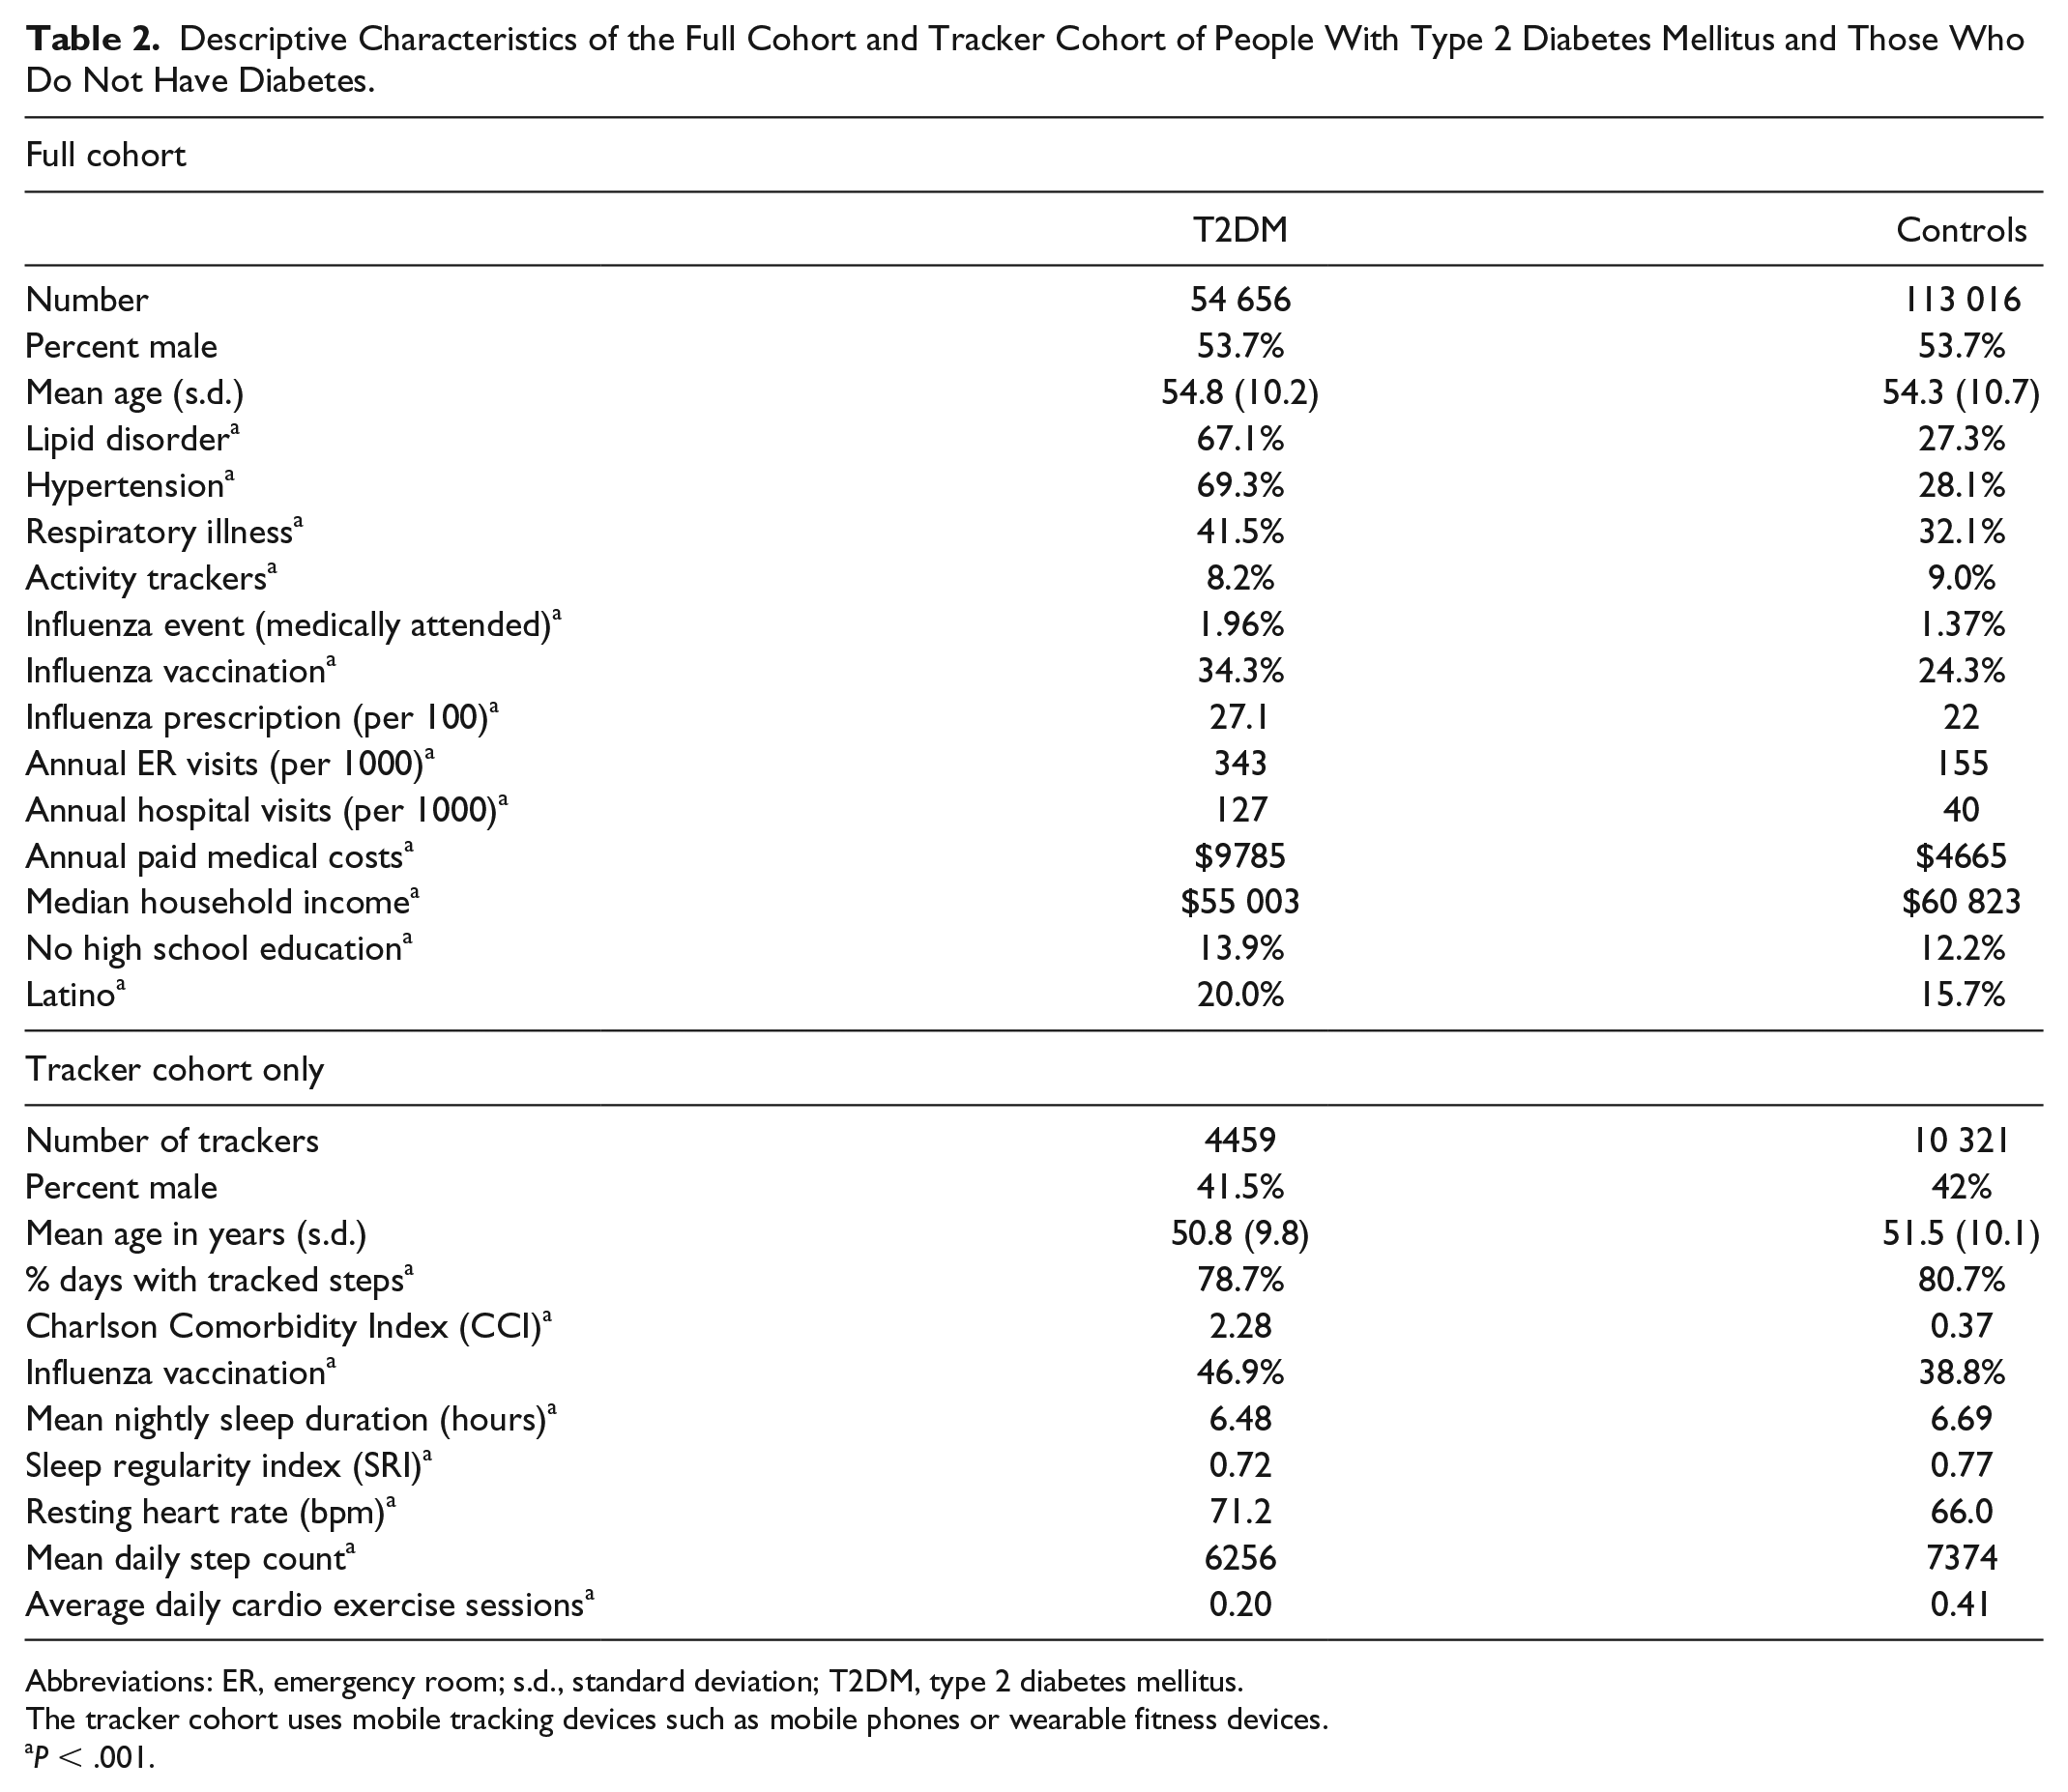
Abbreviations: ER, emergency room; s.d., standard deviation; T2DM, type 2 diabetes mellitus.
The tracker cohort uses mobile tracking devices such as mobile phones or wearable fitness devices.
P < .001.
Influenza vaccination was observed for 34.3% of the cohort with T2DM and 24.3% of controls (P < .001), while influenza infection was found in 1.96% of the population with T2DM compared with 1.37% in controls (P < .001). People with T2DM were also prescribed more antiviral medications for influenza when compared to controls (27.1 vs 22 prescriptions per 1000 persons respectively, P < .001).
Trackers—users of consumer wearable devices or mobile phone applications comprised 8.2% of people living with T2DM and 9.0% of the controls without diabetes in the study cohort (Table 2). Trackers with T2DM had less regular sleep as measured by the sleep regularity index 21 and fewer sleep hours on average (6.48-6.69 hours, P < .001) compared to age and gender matched controls. They also engaged in less physical activity than trackers without diabetes, with fewer steps and exercise sessions on a daily basis, along with higher resting heart rate and body weight.
Impact of Influenza on People With Diabetes and Control Population Data Claims
We identified 1086/54 656 with T2DM and 1567/113 016 without T2DM with medically attended influenza events for the pre/postanalysis (Table 3). A total of 46.1% of people with T2DM and influenza received influenza vaccination, as opposed to 37.9% of controls. Among the T2DM population, abnormal glucose events were observed more frequently in the peri-influenza period than in the baseline period with an increase of 74% (2.15%-3.74%, P < .05). Pneumonia rates also rose 7.4-fold, ischemic heart disease by 1.6-fold, and sepsis by 5.7-fold comparing the peri-influenza period with baseline. Over the same time period, health utilization increased in terms of emergency room visits by 3.7-fold, hospital visits by 4.8-fold, prescribed antibiotics by 3.2-fold, and influenza antiviral medications by 361-fold. Influenza also impacted controls, who saw increased rates of pneumonia and ischemic heart disease by 13- and 1.2-fold respectively, along with increases in antibiotic and antiviral medication use, ER visits, and hospital visits.
Comparison of Medical Outcomes Between the Peri-influenza and Baseline Period for People With and Without Type 2 Diabetes.
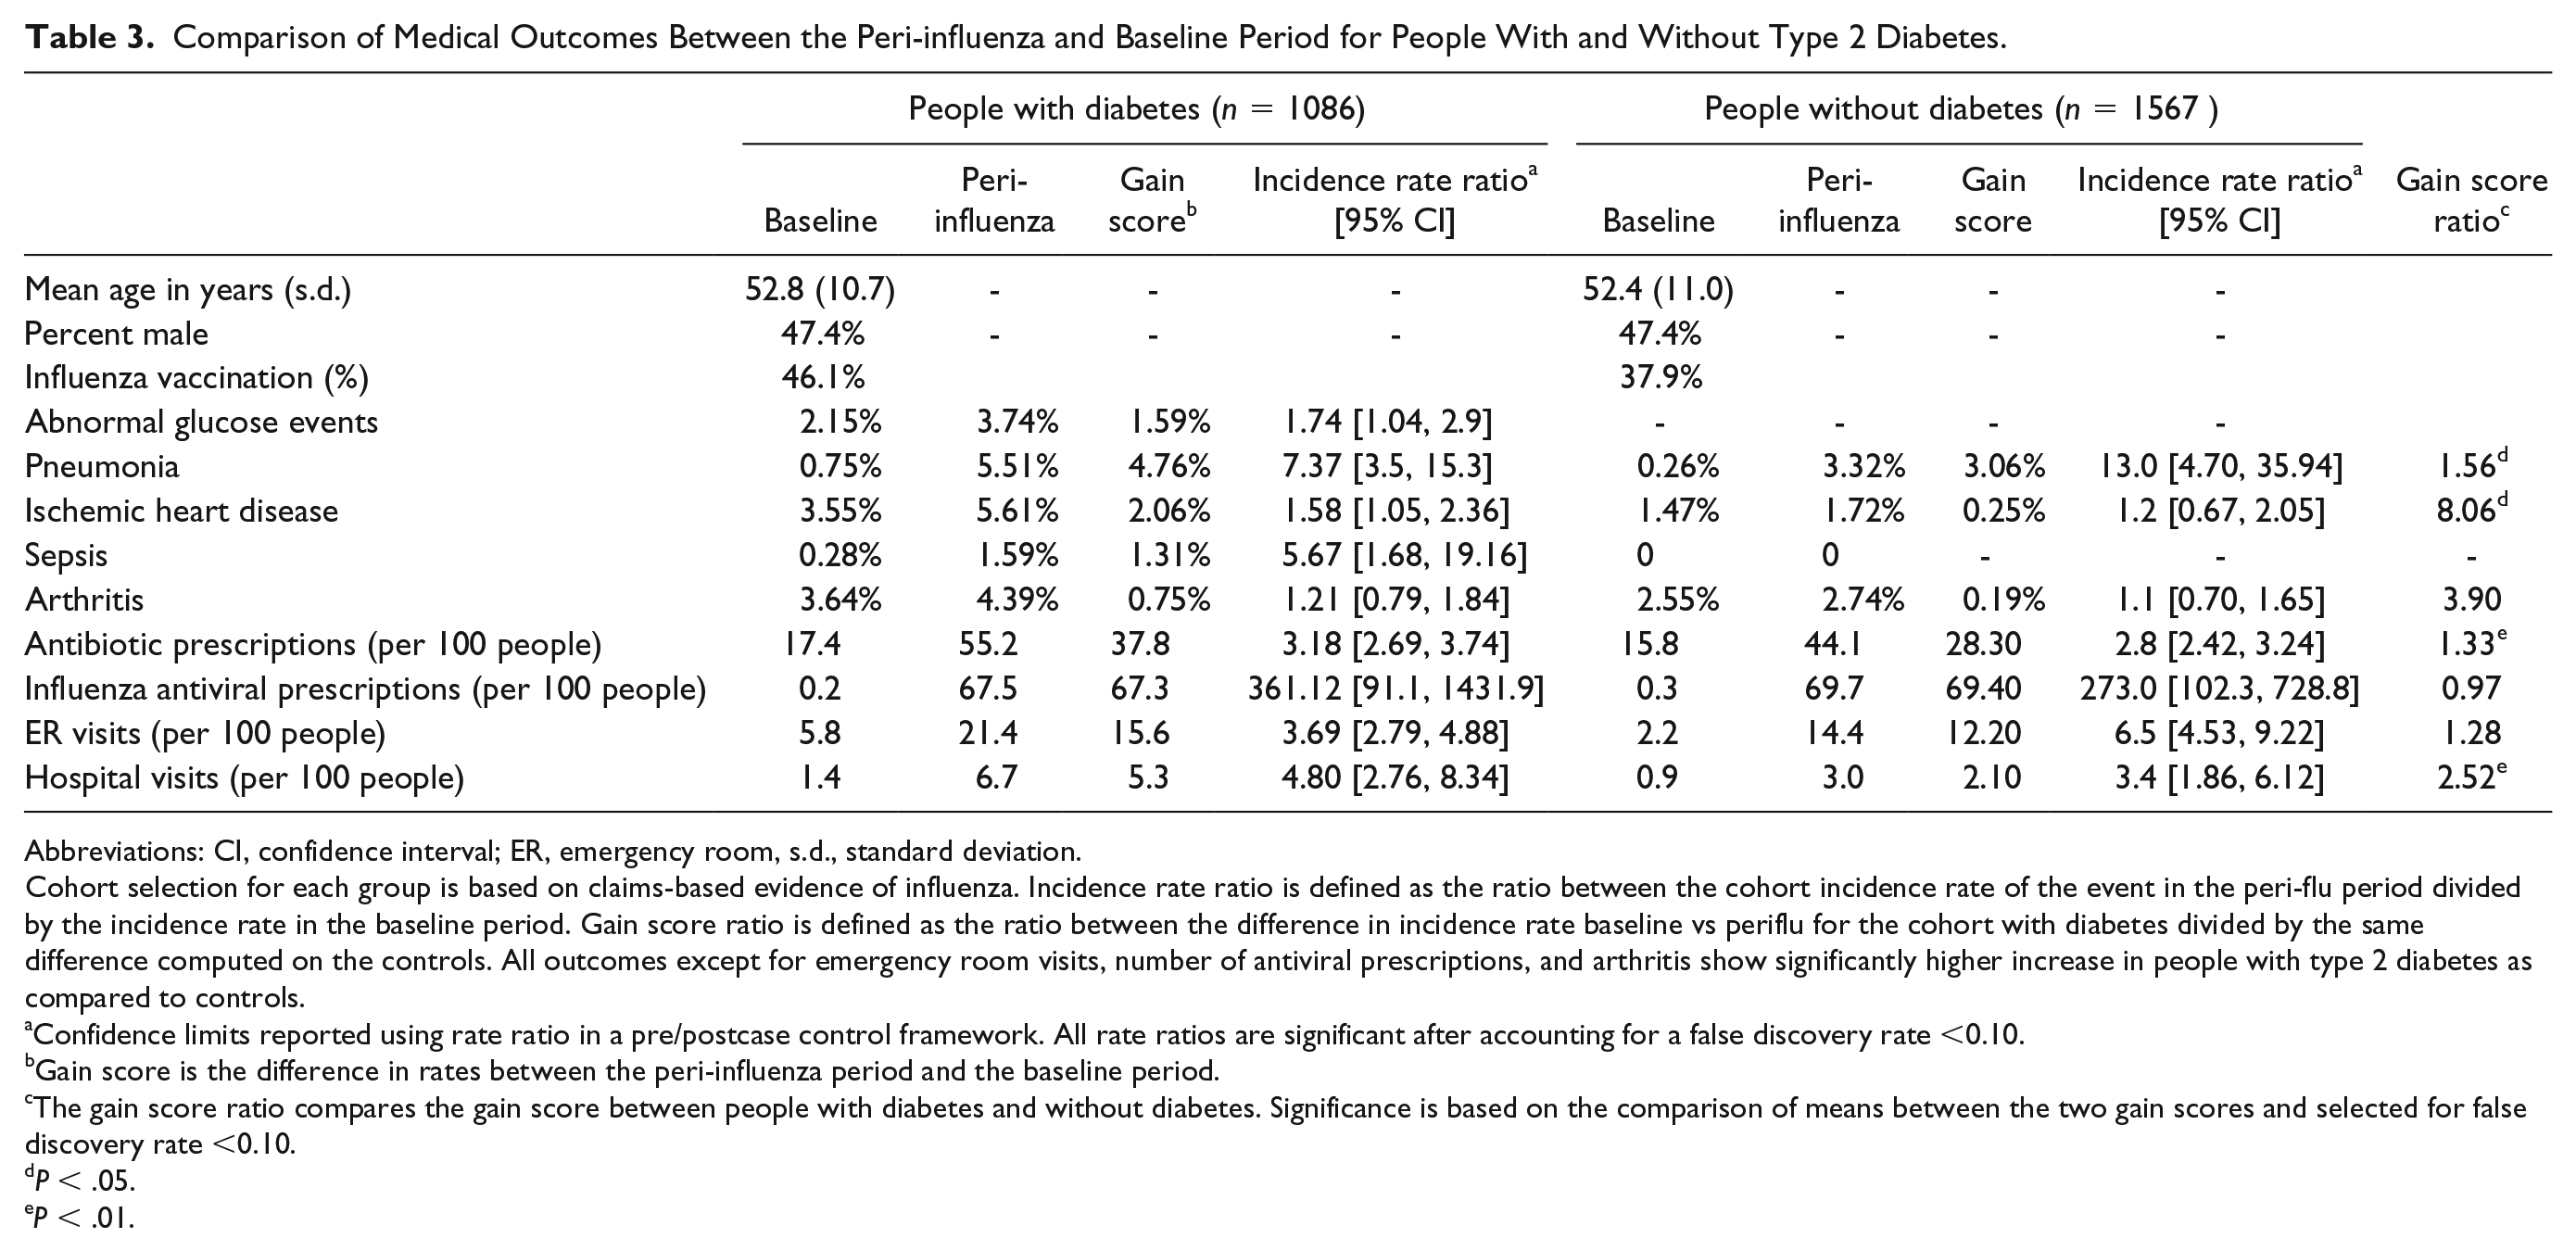
Abbreviations: CI, confidence interval; ER, emergency room, s.d., standard deviation.
Cohort selection for each group is based on claims-based evidence of influenza. Incidence rate ratio is defined as the ratio between the cohort incidence rate of the event in the peri-flu period divided by the incidence rate in the baseline period. Gain score ratio is defined as the ratio between the difference in incidence rate baseline vs periflu for the cohort with diabetes divided by the same difference computed on the controls. All outcomes except for emergency room visits, number of antiviral prescriptions, and arthritis show significantly higher increase in people with type 2 diabetes as compared to controls.
Confidence limits reported using rate ratio in a pre/postcase control framework. All rate ratios are significant after accounting for a false discovery rate <0.10.
Gain score is the difference in rates between the peri-influenza period and the baseline period.
The gain score ratio compares the gain score between people with diabetes and without diabetes. Significance is based on the comparison of means between the two gain scores and selected for false discovery rate <0.10.
P < .05.
P < .01.
A comparison of the pre/post gains showed a 4.8% gain in pneumonia in the T2DM group compared with 3.1% for controls (P < .05) and a 2.1% gain for ischemic heart disease among those with T2D, almost eight times that is seen in controls (P < .05). Gain scores in antibiotic use and hospital visits were also greater for people with T2DM vs controls (37.8 prescriptions/100 people vs 28.3, P < .01 and 5.3 visits/100 people vs 2.1, P < .01, respectively).
Impact of Influenza on Behavioral Activities of People With Diabetes and Control Populations
To assess the effect of influenza infection on day-to-day step and sleep behaviors, we removed the requirement for continuous one-year coverage during the 2016 to 2017 influenza season to identify a cohort with medically attended influenza with activity-rich tracking data. The other requirements of age 18 and being a member of the health plan still held. We selected individuals with a high density of logged steps or sleep, with at least 5 days of reported activity in 14 days before and after the influenza diagnosis date (Figure 2(a)). This provided 67 persons with T2DM and 243 nonmatched controls. In Figure 2(b), people with T2DM logged 10 000 fewer steps in four days pre-influenza and seven days postinfluenza period compared to their baseline, with a lowest of 5500 daily steps (28.4% reduction from baseline) occurring approximately two days after the influenza diagnosis event. A similar pattern was noted for controls in the same time period. Figure 2(c) shows the day-to-day changes in sleep patterns for people with and without T2DM in 14 days pre- and postinfluenza. People with T2DM also saw a shift of up to 30 minutes in sleep start time in the days before diagnosis with influenza, as well as an increase in restless nights and naps taken. These changes persisted for several days postinfluenza diagnosis. We also examined step and sleep activity as well as heart rate data from the wearable fitness device in the 14-day period before and after an influenza vaccination. As shown in Figure 2(d), influenza vaccination in this subcohort did not have a significant impact on behaviors or heart rate, supporting the overall safety of influenza vaccination.
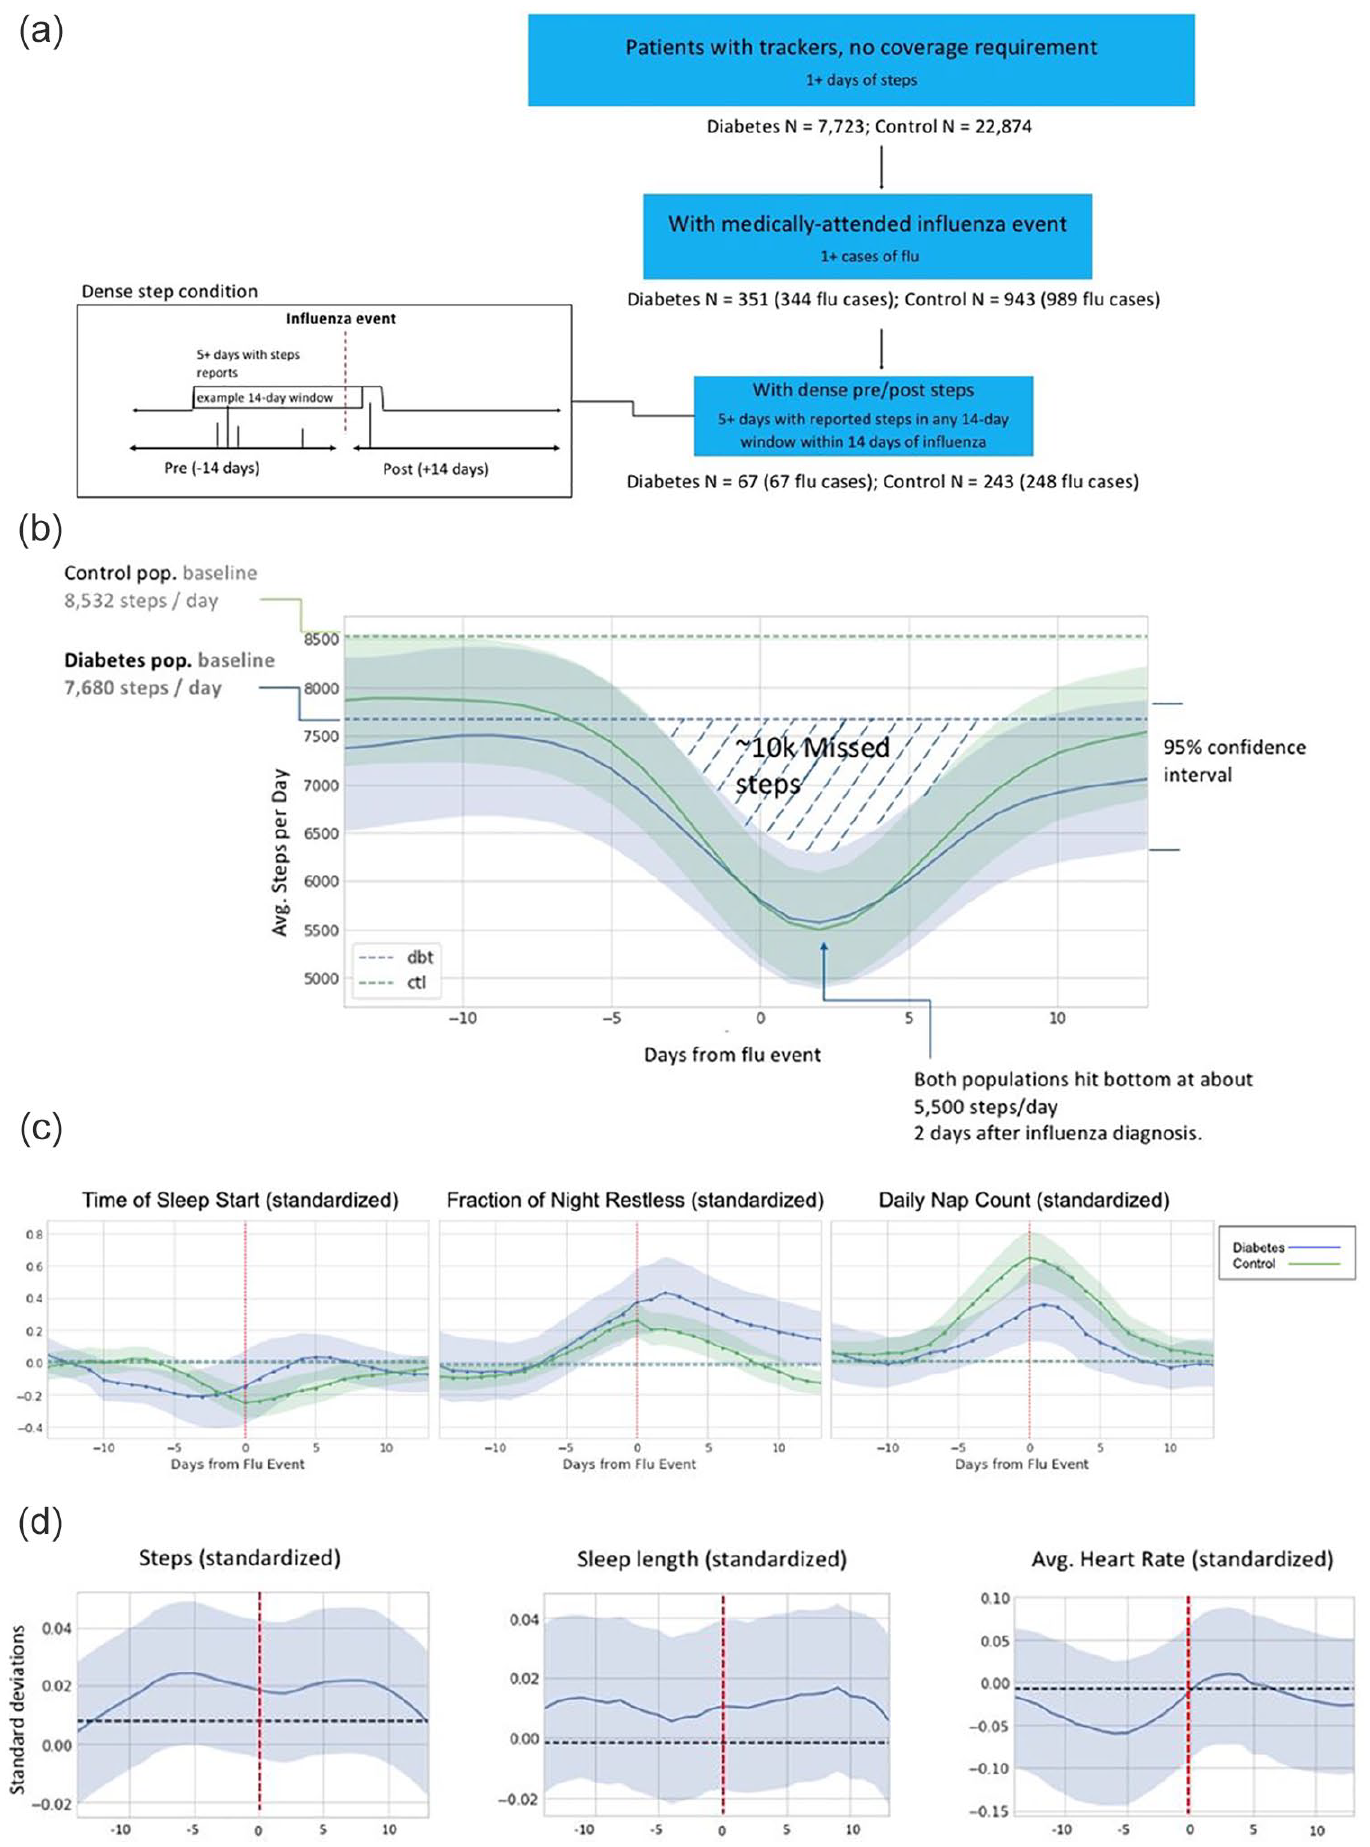
Time series visualization of trackers with rich activity data around an influenza event. (a) Selection strategy of patients with dense step tracking data from wearable activity devices in the surrounding 14 days of documented influenza infection. (b) Impact of influenza infection on steps taken in 14 days before and after influenza diagnosis. Step activity is aggregated per day for people with diabetes (n = 67) and controls (n = 243) in two weeks before and after influenza diagnosis. (c) Impact of influenza infection on sleep patterns in 14 days before and after influenza diagnosis. (d) Impact of influenza vaccination on daily steps taken, sleep duration, and average daily heart rate in 14 days before and after vaccination. Aggregated time series are smoothed to reduce noise. Effect size may be underestimated. Timing of effects may be considered accurate within a five-day tolerance.
Discussion
Health care systems are increasingly looking to add digital health technologies to support type 2 diabetes care. 22 Here, we used PGHD derived from consumer digital mobile technologies, including wearable sensors to determine how influenza impacts adults living with type 2 diabetes and matched controls in addition to conventional real-world claims data from a large US health company.
Among those with documented influenza infection, we observed markedly increased rates of pneumonia, ischemic heart disease, and sepsis in the peri-influenza compared to baseline periods especially for individuals with type 2 diabetes. Taken together with the larger number of emergency room visits and hospitalizations, these results suggest that for people with type 2 diabetes influenza increases the risk for more severe medical outcomes and health care utilization compared to the background population. Our findings are consistent with prior research that influenza adds to the morbidity burden among people with diabetes23-25 and support recent studies on the effect of influenza infection on the risk of developing ischemic heart disease.5,26-28
Among those wearing simple tracking devices, we did not observe significant changes in daily average step or sleep activity when comparing the six-week period surrounding the influenza infection (peri-influenza period) to baseline (nonperi-influenza period). This likely reflects the small number of individuals with documented influenza infection in this group, and the long observation period over which activity is averaged (six weeks), which may be washing out the short-term activity change around the event. However, in individuals with a high density of PGHD, a clear signal was observed in terms of changes in steps, sleep, and heart rate over two weeks before and after an influenza diagnosis. Of note, the activity disturbances in this cohort preceded influenza diagnosis by up to five days with detectable changes from baseline activity.
To our knowledge, this is the first study to characterize the immediate impact of influenza on medical outcomes and activity levels for adults with type 2 diabetes compared to matched controls. Using individual PGHD to complement conventional population level claims data is valuable for a number of reasons. First, PGHD with medical claims allow a more nuanced description of the impact of influenza on people with diabetes. For example, a potential area of exploration is whether step and sleep disturbances lead to behavioral reasons for poor diabetes control during active infection. The finding that vaccination itself leads to no observable adverse activity effects provides additional incentives for influenza vaccination in the population with diabetes; this reinforces recommendations for annual vaccination by the WHO, US Advisory Committee on Immunization Practices (ACIP), the ADA, and other public health bodies and vaccine policymakers globally.2,9,10
Second, the clear signals we observed in the days leading up to an influenza diagnosis point to the potential of PGHD for personalized and population level disease surveillance. Further research is warranted to understand whether changes in daily activity can predict influenza onset for targeted early intervention with antiviral medications. Likewise, population level changes in activity may signal impending influenza outbreaks to public health officials or care providers, providing valuable lead time to garner resources and minimize the spread of disease. Policy makers can also use this information to gain greater insight into the economic costs of influenza. Digital information such as online searches have been shown to precede influenza outbreaks,29,30 but PGHD has the added advantage of passive monitoring at much higher time granularities, reducing the need for large sample sizes to detect signal.
Third, PGHD within the appropriate medical context may be applicable to a number of other diseases. The PGHD in this study uses a novel data stream in the form of consumer wearable devices, which are gaining traction among health insurers seeking to improve population health with wellness approaches. 31 Many acute illnesses or exacerbations of chronic disease manifest symptomatically with disturbances in activity before being diagnosed. Digital data obtained from unobtrusive passive monitoring with consumer wearable devices could fulfill an important need for early detection of a number of public health conditions.
Our study has limitations. The analysis focused on adults with commercial insurance and does not fully represent older people with diabetes within the United States or at risk underserved populations. However, the large cohort size still provides valuable population level insights into the effects of influenza on people with diabetes. Medical claims and pharmacy data may not capture all episodes of influenza infection or vaccination. Still, the identification of influenza event with claims data minimizes the chances of false labeling. Finally, even with the population scope of our study, the number of people with usable PGHD was small, and we needed to expand the influenza analysis period to find sufficient numbers of people on which to evaluate the digital information. Furthermore, people with PGHD likely reflect different behavioral patterns from the general population. Yet, consumer mobile health technology is still in its early stages. As more novel data streams become available and mobile technology becomes more commonplace, the ability to detect relevant digital health signals in a population will only improve.
In conclusion, we introduce a novel framework linking PGHD from consumer wearable devices with conventional medical claims data to gain population insights into influenza and its impact on people with type 2 diabetes. Compared to prior approaches for disease surveillance which skew toward those with more severe outcomes, this framework allows for a more nuanced analysis of a more representative population of diabetes. We believe this approach has potential for broader applications in disease surveillance beyond influenza and other infectious illnesses. These data also strengthen the need for annual influenza vaccination for people with diabetes in accordance with international and national guidelines.
Footnotes
Declaration of Conflicting Interests
The author(s) declared the following potential conflicts of interest with respect to the research, authorship, and/or publication of this article: Sandrine Samson, Jan Liska, Henry Mills, Rosalind Hollingsworth, Michael Greenberg, and Anne C. Beal are full-time employees of Sanofi Pasteur. Wei-Nchih Lee, Tom Quisel, and Luca Foschini were full time employees of Evidation Health at the time of manuscript writing. Kevin Konty is a consultant with Evidation Health.
Funding
The author(s) disclosed receipt of the following financial support for the research, authorship, and/or publication of this article: This study was funded by Sanofi Pasteur.