
Abstract
Background:
Accurately predicting the risk of diabetic foot ulceration (DFU) could dramatically reduce the enormous burden of chronic wound management and amputation. Yet, the current prognostic models are unable to precisely predict DFU events. Typically, efforts have focused on individual factors like temperature, pressure, or shear rather than the overall foot microclimate.
Methods:
A systematic review was conducted by searching PubMed reports with no restrictions on start date covering the literature published until February 20, 2019 using relevant keywords, including temperature, pressure, shear, and relative humidity. We review the use of these variables as predictors of DFU, highlighting gaps in our current understanding and suggesting which specific features should be combined to develop a real-time microclimate prognostic model.
Results:
The current prognostic models rely either solely on contralateral temperature, pressure, or shear measurement; these parameters, however, rarely reach 50% specificity in relation to DFU. There is also considerable variation in methodological investigation, anatomical sensor configuration, and resting time prior to temperature measurements (5-20 minutes). Few studies have considered relative humidity and mean skin resistance.
Conclusion:
Very limited evidence supports the use of single clinical parameters in predicting the risk of DFU. We suggest that the microclimate as a whole should be considered to predict DFU more effectively and suggest nine specific features which appear to be implicated for further investigation. Technology supports real-time in-shoe data collection and wireless transmission, providing a potentially rich source of data to better predict the risk of DFU.
Introduction
Foot ulceration is a global problem associated with huge healthcare costs. In England, diabetic foot ulceration (DFU) costs the National Health Service £972 million to £1.13 billion per year. 1 The vast majority of DFUs occur as a result of underlying neuropathy, peripheral vascular disease, or a combination of these diseases. 2 The most important complication of foot ulceration is its predisposition to infection, which is in itself recognized as a significant cause of morbidity and mortality. 3 Ulcers occur annually in 2.5% to 10.7% of people with diabetes and, for those with healed DFU, the rate of recurrence within five years is 66% and risk for amputation is 12%. 4 DFU has been shown to precede amputation in up to 85% of cases, 5 so early prediction of ulceration risk is of paramount importance to reduce weight-bearing physical activity levels. Effective off-loading and physical activity advice has been shown to decrease the development and recurrence of DFU. 6 Currently in the United Kingdom, for 20% of people with a DFU, it takes between 14 days and 2 months to be assessed by a specialist footcare team, but for 9% it can be more than two months. 7 Delays in seeking expert assessment are associated with more severe ulcers, poorer healing rates, and more hospital admissions. 8
Microclimate describes the environmental conditions of the foot including temperature, pressure, shear stress, and humidity, including properties of the skin and underlying soft tissues (see Figure 1). For each of these components, it may be possible to ultimately derive thresholds which in combination give rise to an increased risk of DFU. While the concept is relatively new, it is recognized that microclimate contributes to pressure ulcers9,10 but little research has been done in relation to DFU.
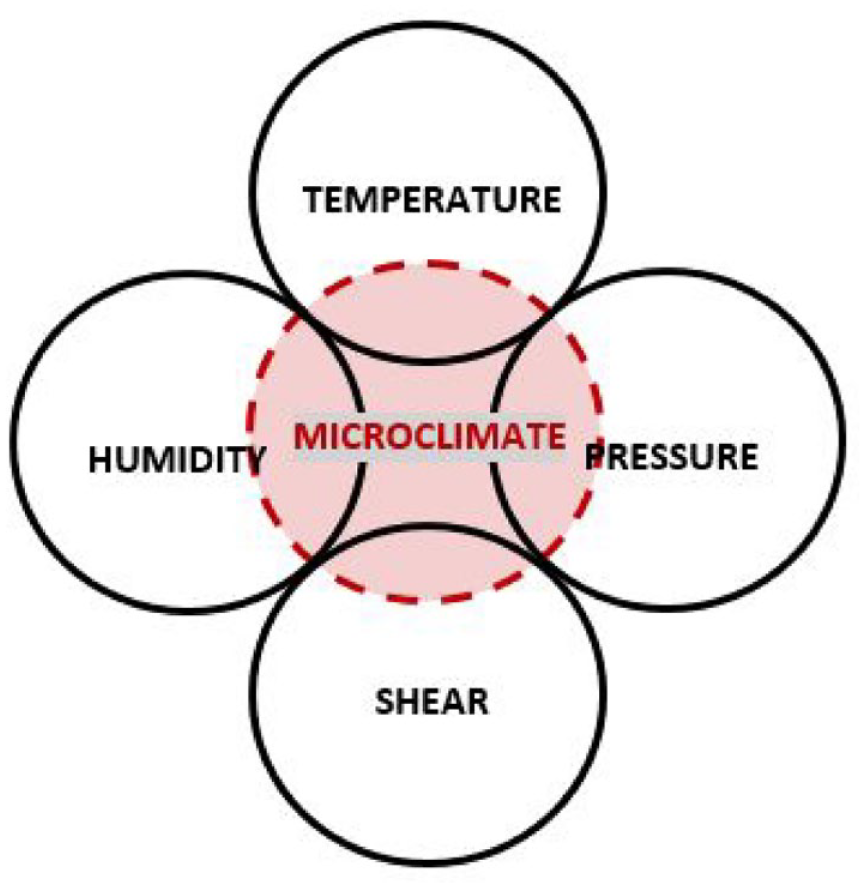
The microclimate.
In this systematic review, we will systematically assess the evidence about risk predictors of DFU in relation to a prespecified definition of microclimate including temperature, pressure, shear forces, and humidity, and will discuss a possible microclimate-based approach to the prediction of DFU and re-ulceration. We will conclude by suggesting a summary of key measures within a multi-factorial prognostic model that might be used to attempt to predict ulcer events.
Methods
Data Sources, Searches, and Study Selection
The background literature search for this systematic review on PubMed was conducted with no restrictions on start date covering articles until February 20, 2019. This included searches for “pressure diabetes foot ulcer,” “pressure in-shoe diabetes,” “temperature diabetes foot ulcer,” “shear diabetes foot ulcer,” “shear in-shoe diabetes,” “humidity diabetes foot ulcer,” and “moisture diabetes foot ulcer.” In total, 1942 articles were identified in the initial literature review then screened by title and abstract, leaving 78 articles which formed the basis of this narrative review (see Figure 2). In the following sections, we discuss each microclimate variable implicated in foot ulceration.
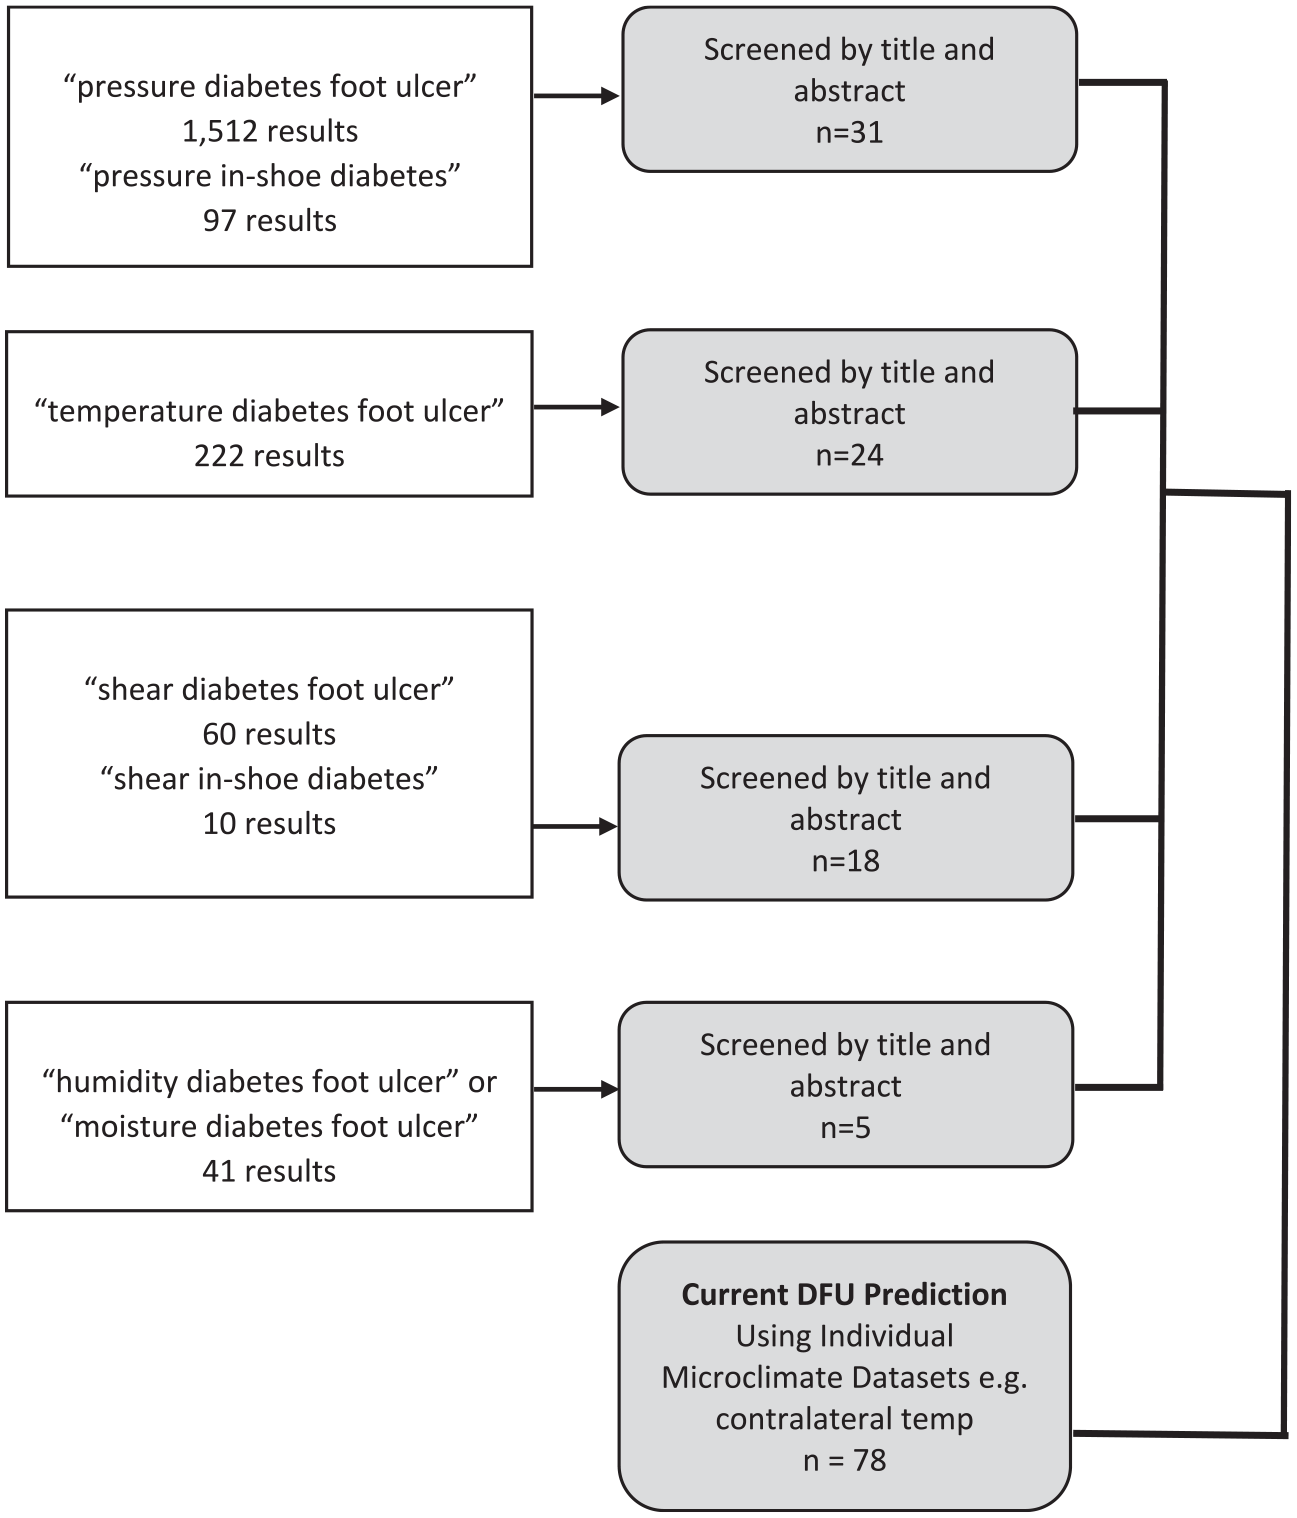
Microclimate review methodology.
Microclimate Prediction
Contralateral Temperature
Attempts to develop early warning systems for foot ulceration have focused primarily on contralateral temperature in those with diabetes and neuropathy, 11 or a history of foot ulceration,12,13 looking for the evidence of inflammation that precedes ulceration and infection. 14 Armstrong et al found that a week prior to ulceration those who developed a foot ulcer (8.4%) had a temperature difference that was 4.8 times greater at the site of ulceration than those who did not ulcerate (3.50 ± 1.0 vs 0.74 ± 0.05; P = .001). 15 Their study was based on 225 individuals with diabetes who were at high risk of ulceration using an infrared skin thermometer to measure temperatures twice daily on six locations on each foot. Study participants reduced physical activity until normalization and contacted the study coordinator if temperature differences between contralateral locations exceeded 4°F (>2.2°C). Similarly, Lavery et al found that people with diabetes, neuropathy, and a history of foot ulceration employing standard therapy or structured foot examinations were 4.37 and 4.71 times more likely to develop ulcers than those monitoring contralateral temperature and reducing physical activity when this threshold was reached. 16 However, van Netten et al 17 found contralateral temperature differences (hereafter “hotspots”) above the 2.2°C threshold (n = 54) which indicated the detection of diabetic foot complications with only 89% sensitivity and 40% specificity (receiver operating characteristic, ROC 0.656). 18 These data were acquired from a thermal camera positioned within a 80 × 60 × 60 cm frame. The most optimal cut-off skin temperature for determining urgency of treatment was 1.35°C providing 89% sensitivity and 78% specificity based on any diabetic foot complication requiring immediate treatment, including any cause hospitalization, antibiotic prescriptions, a diagnosis of Charcot or referral for X-ray or MRI (n = 9). This study did not include healthy controls, yet hotspots of more than 2.2°C have been found in a study of healthy feet (n = 103) although the majority significantly reduced after ten minutes, indicating the importance of the rest interval prior to measurement. 19 In contrast, Macdonald et al found 32% of those with healthy feet had at least one hotspot even after ten minutes resting with the subjects’ legs supported, 20 many of which were attributed to uncontrolled factors prior to the test such as caffeine intake, increased physical activity, or slower rates of temperature transition between feet. 20 An added problem is that the difference in the severity and extension of peripheral vascular disease may contribute to an asymmetry of temperature.
Table 1 shows how the rest period applied before measurement in these studies varies considerably, from 5 to 20 minutes, or individual discretion in self-measurement. Likewise, Wijlens et al found hotspots among those with diabetes in 8.5% of measurements yet no ulcers developed in the week after monitoring. They therefore suggested that the 2.2°C threshold was not valid as a single measurement and would require confirmation the following day. 21 Other suggestions have included studying the decay rates of temperature distributions 22 or combining both contralateral and mean temperature analyses. Higher mean resting temperatures have been found in those with diabetic neuropathy or a history of foot ulceration than non-neuropathic subjects with diabetes. 23
Contralateral Temperature and Pressure Measurements: Anatomical Positions.
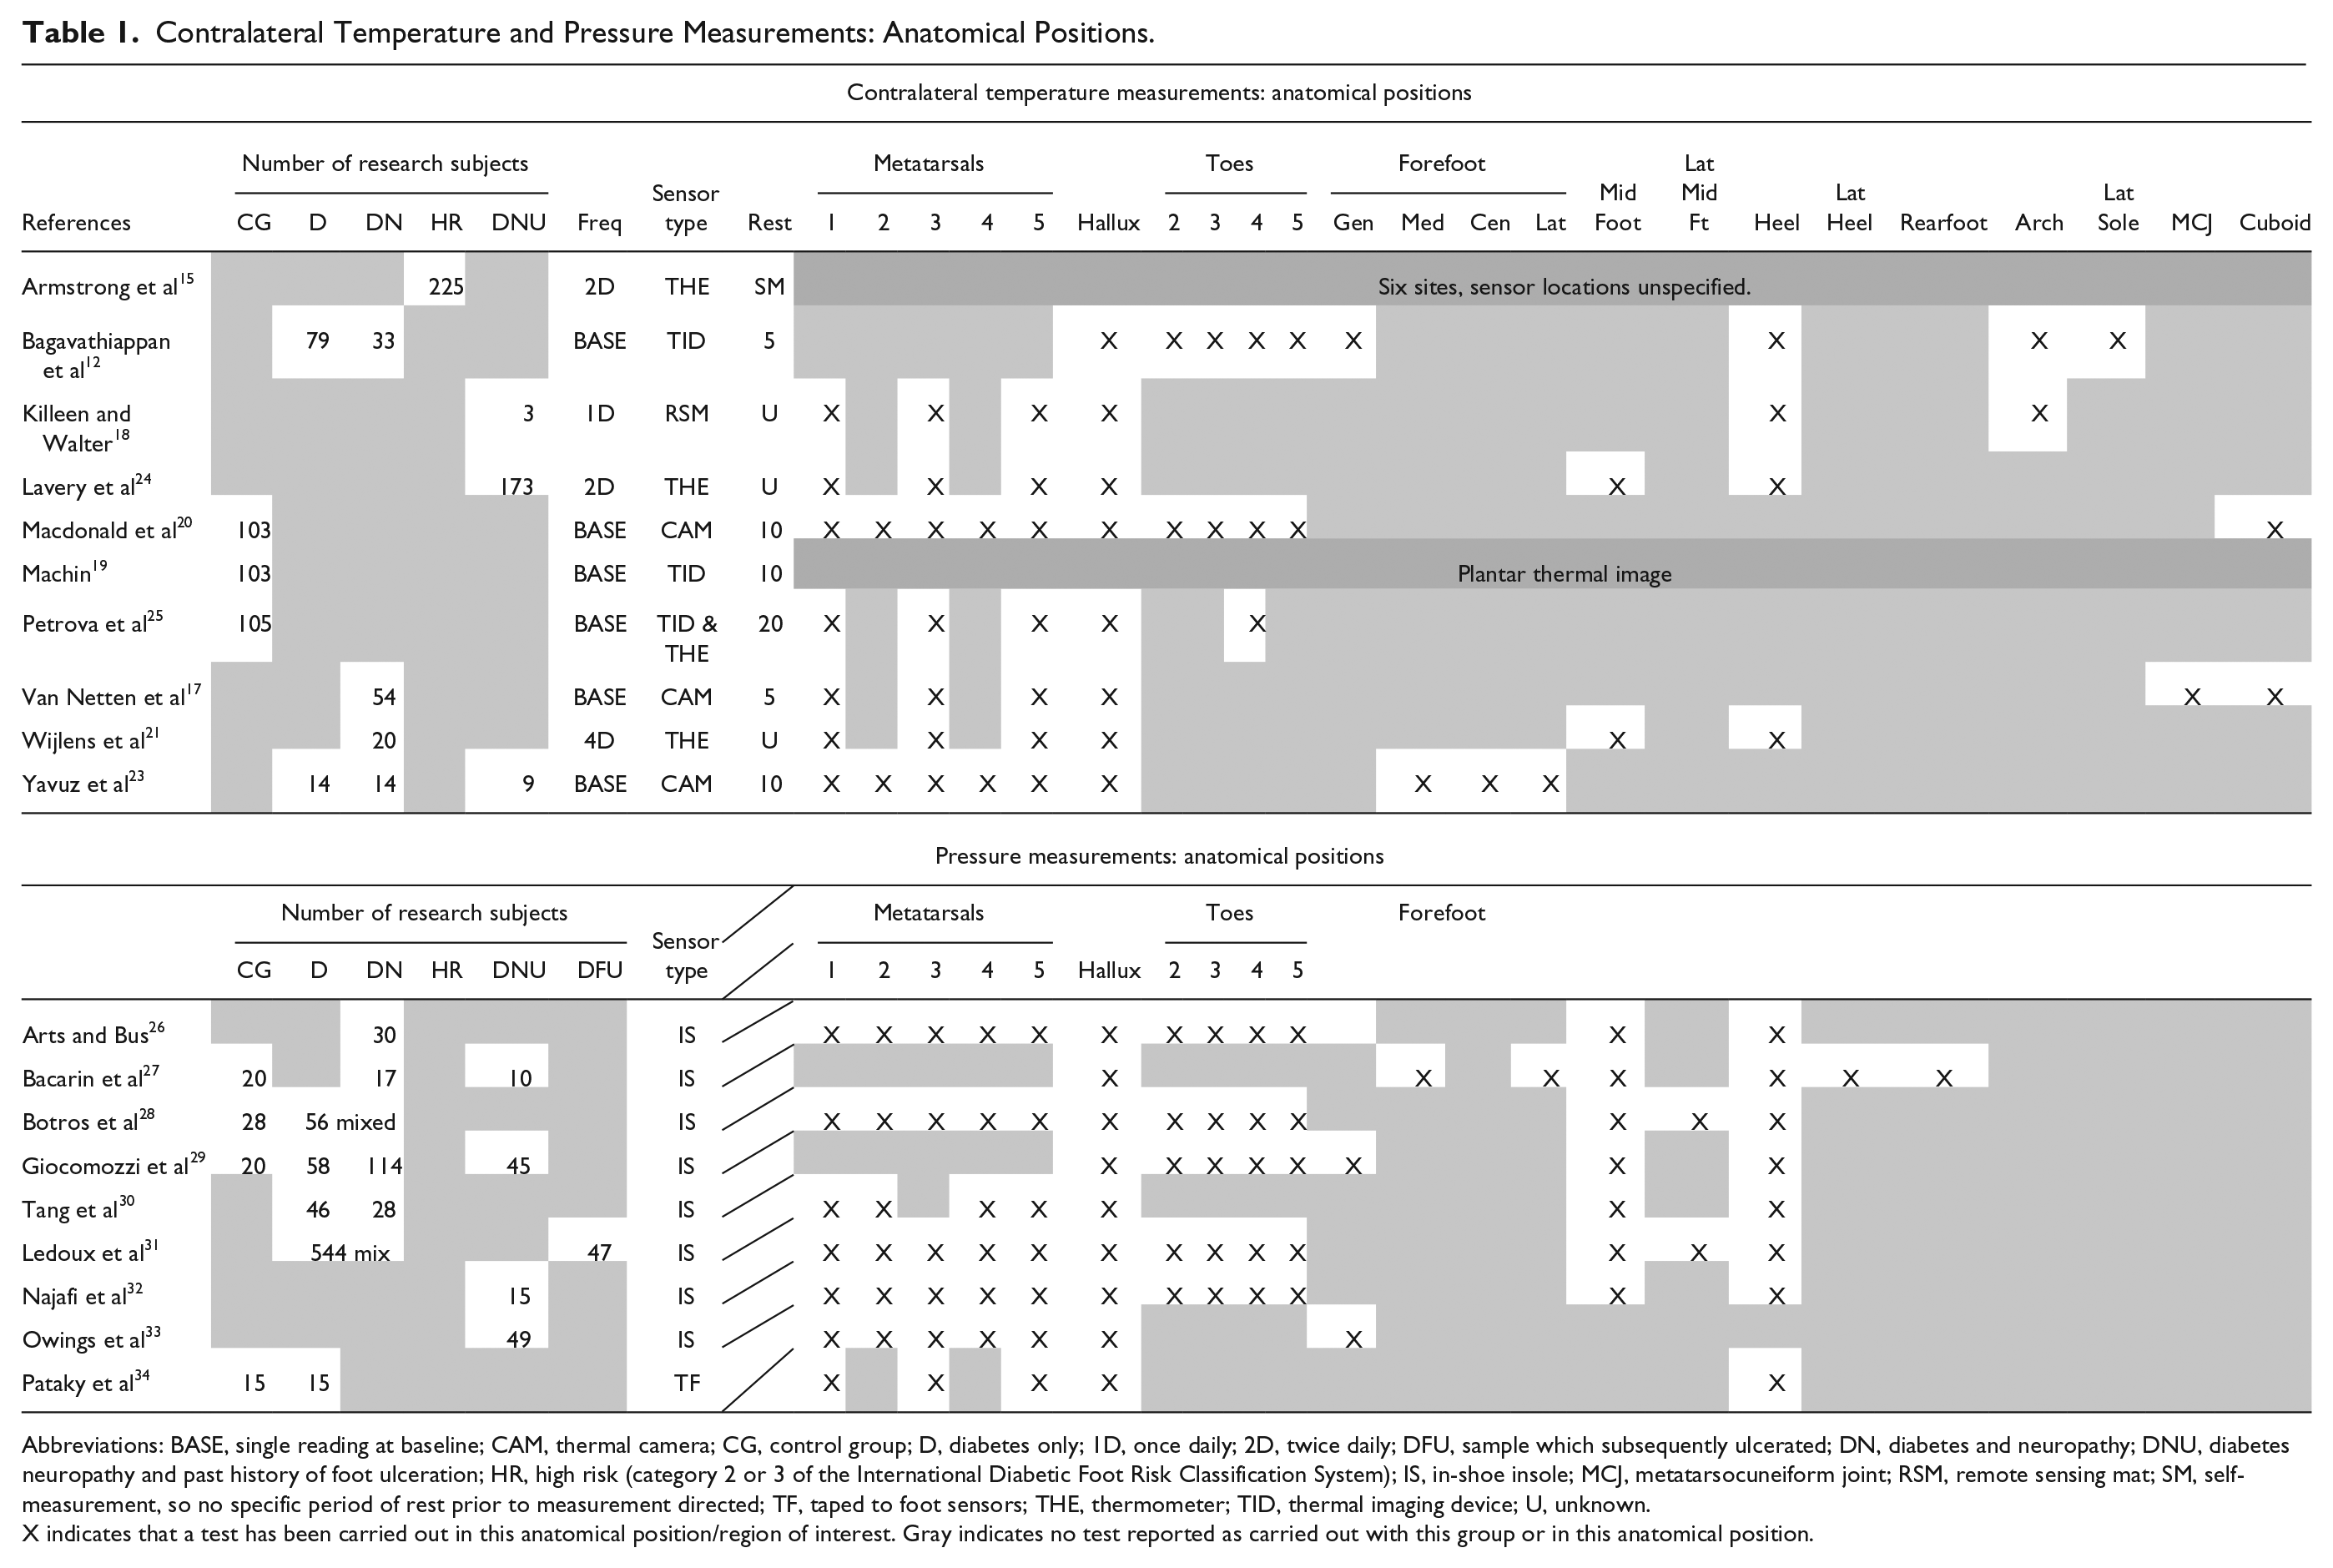
Abbreviations: BASE, single reading at baseline; CAM, thermal camera; CG, control group; D, diabetes only; 1D, once daily; 2D, twice daily; DFU, sample which subsequently ulcerated; DN, diabetes and neuropathy; DNU, diabetes neuropathy and past history of foot ulceration; HR, high risk (category 2 or 3 of the International Diabetic Foot Risk Classification System); IS, in-shoe insole; MCJ, metatarsocuneiform joint; RSM, remote sensing mat; SM, self-measurement, so no specific period of rest prior to measurement directed; TF, taped to foot sensors; THE, thermometer; TID, thermal imaging device; U, unknown.
X indicates that a test has been carried out in this anatomical position/region of interest. Gray indicates no test reported as carried out with this group or in this anatomical position.
To summarize, contralateral temperature differences (hotspots) are important but have so far not provided acceptable specificity and sensitivity in prediction. Standardization of both the anatomical regions being monitored and the rest period prior to measurement 35 is key, but we suggest combining this with the analysis of other microclimate indicators such as pressure.
Pressure
The maximum physical force exerted on a region such as the plantar area of the foot, known as peak pressures, has been implicated in foot ulceration for some time. 36 Caselli et al found barefoot forefoot pressure and forefoot-to-rear foot peak pressure ratios are associated with a high risk of foot ulceration (odds ratio 1.19 [95% CI 1.11-1.28], P < .0001 and 1.37 [1.16-1.61], P < .0001, respectively). 37 Other studies suggest that there are higher pressures in the feet of those with diabetes and neuropathy,38-41 or in people with claw/hammer deformities.42,43 Peak pressure analysis has been advantageous in offloading treatments to minimize foot ulceration, 44 with the development of mean plantar pressure targets 45 (currently 200 kPa based on Pedar sensors; www.novel.de/novelcontent/pedar) for those with diabetes, neuropathy, and a history of ulceration. 33 Investment in in-shoe monitoring pressure insoles for those in DFU remission over an 18-month period was also found to be cost-effective given lower subsequent event occurrence rates (0.14 vs 0.62). 32
However, predicting a first ulcer from pressure readings remains problematic given the interrelationship of many other factors capable of influencing pressure including tendon stiffness and fiber disorganization, decreased joint mobility, and the degree of neuropathy. Murray et al selected 63 individuals with both type 1 and type 2 diabetes, neuropathy, and a peak plantar pressure more than 10 kg/cm2 (around 98 kPa). Six of them subsequently ulcerated within the 10 to 22 months re-examination period, but no difference was found in mean peak pressure or the number of high-pressure areas greater than 10 kg/cm2 between the ulcer and the nonulcer group. 46 Measurement relied on three walkway images captured by a pedobarograph rather than the real-time data.
Peak pressure itself is an average derived from a number of regions of interest, eg, first, third, and fifth metatarsals, which vary in pressure studies (Table 1). Useful in-shoe pressure ranges associated with healthy feet or those with diabetic neuropathy are beginning to emerge (Table 2), but Casselli’s practical approach of grouping pressure ranges according to a subject’s neuropathy disability score has yet to be replicated using in-shoe sensors. 37 This is important given reported differences in the pressures found by barefoot and in-shoe pressure sensors. 33
In-Shoe Overall and Region-Specific Peak Pressure.
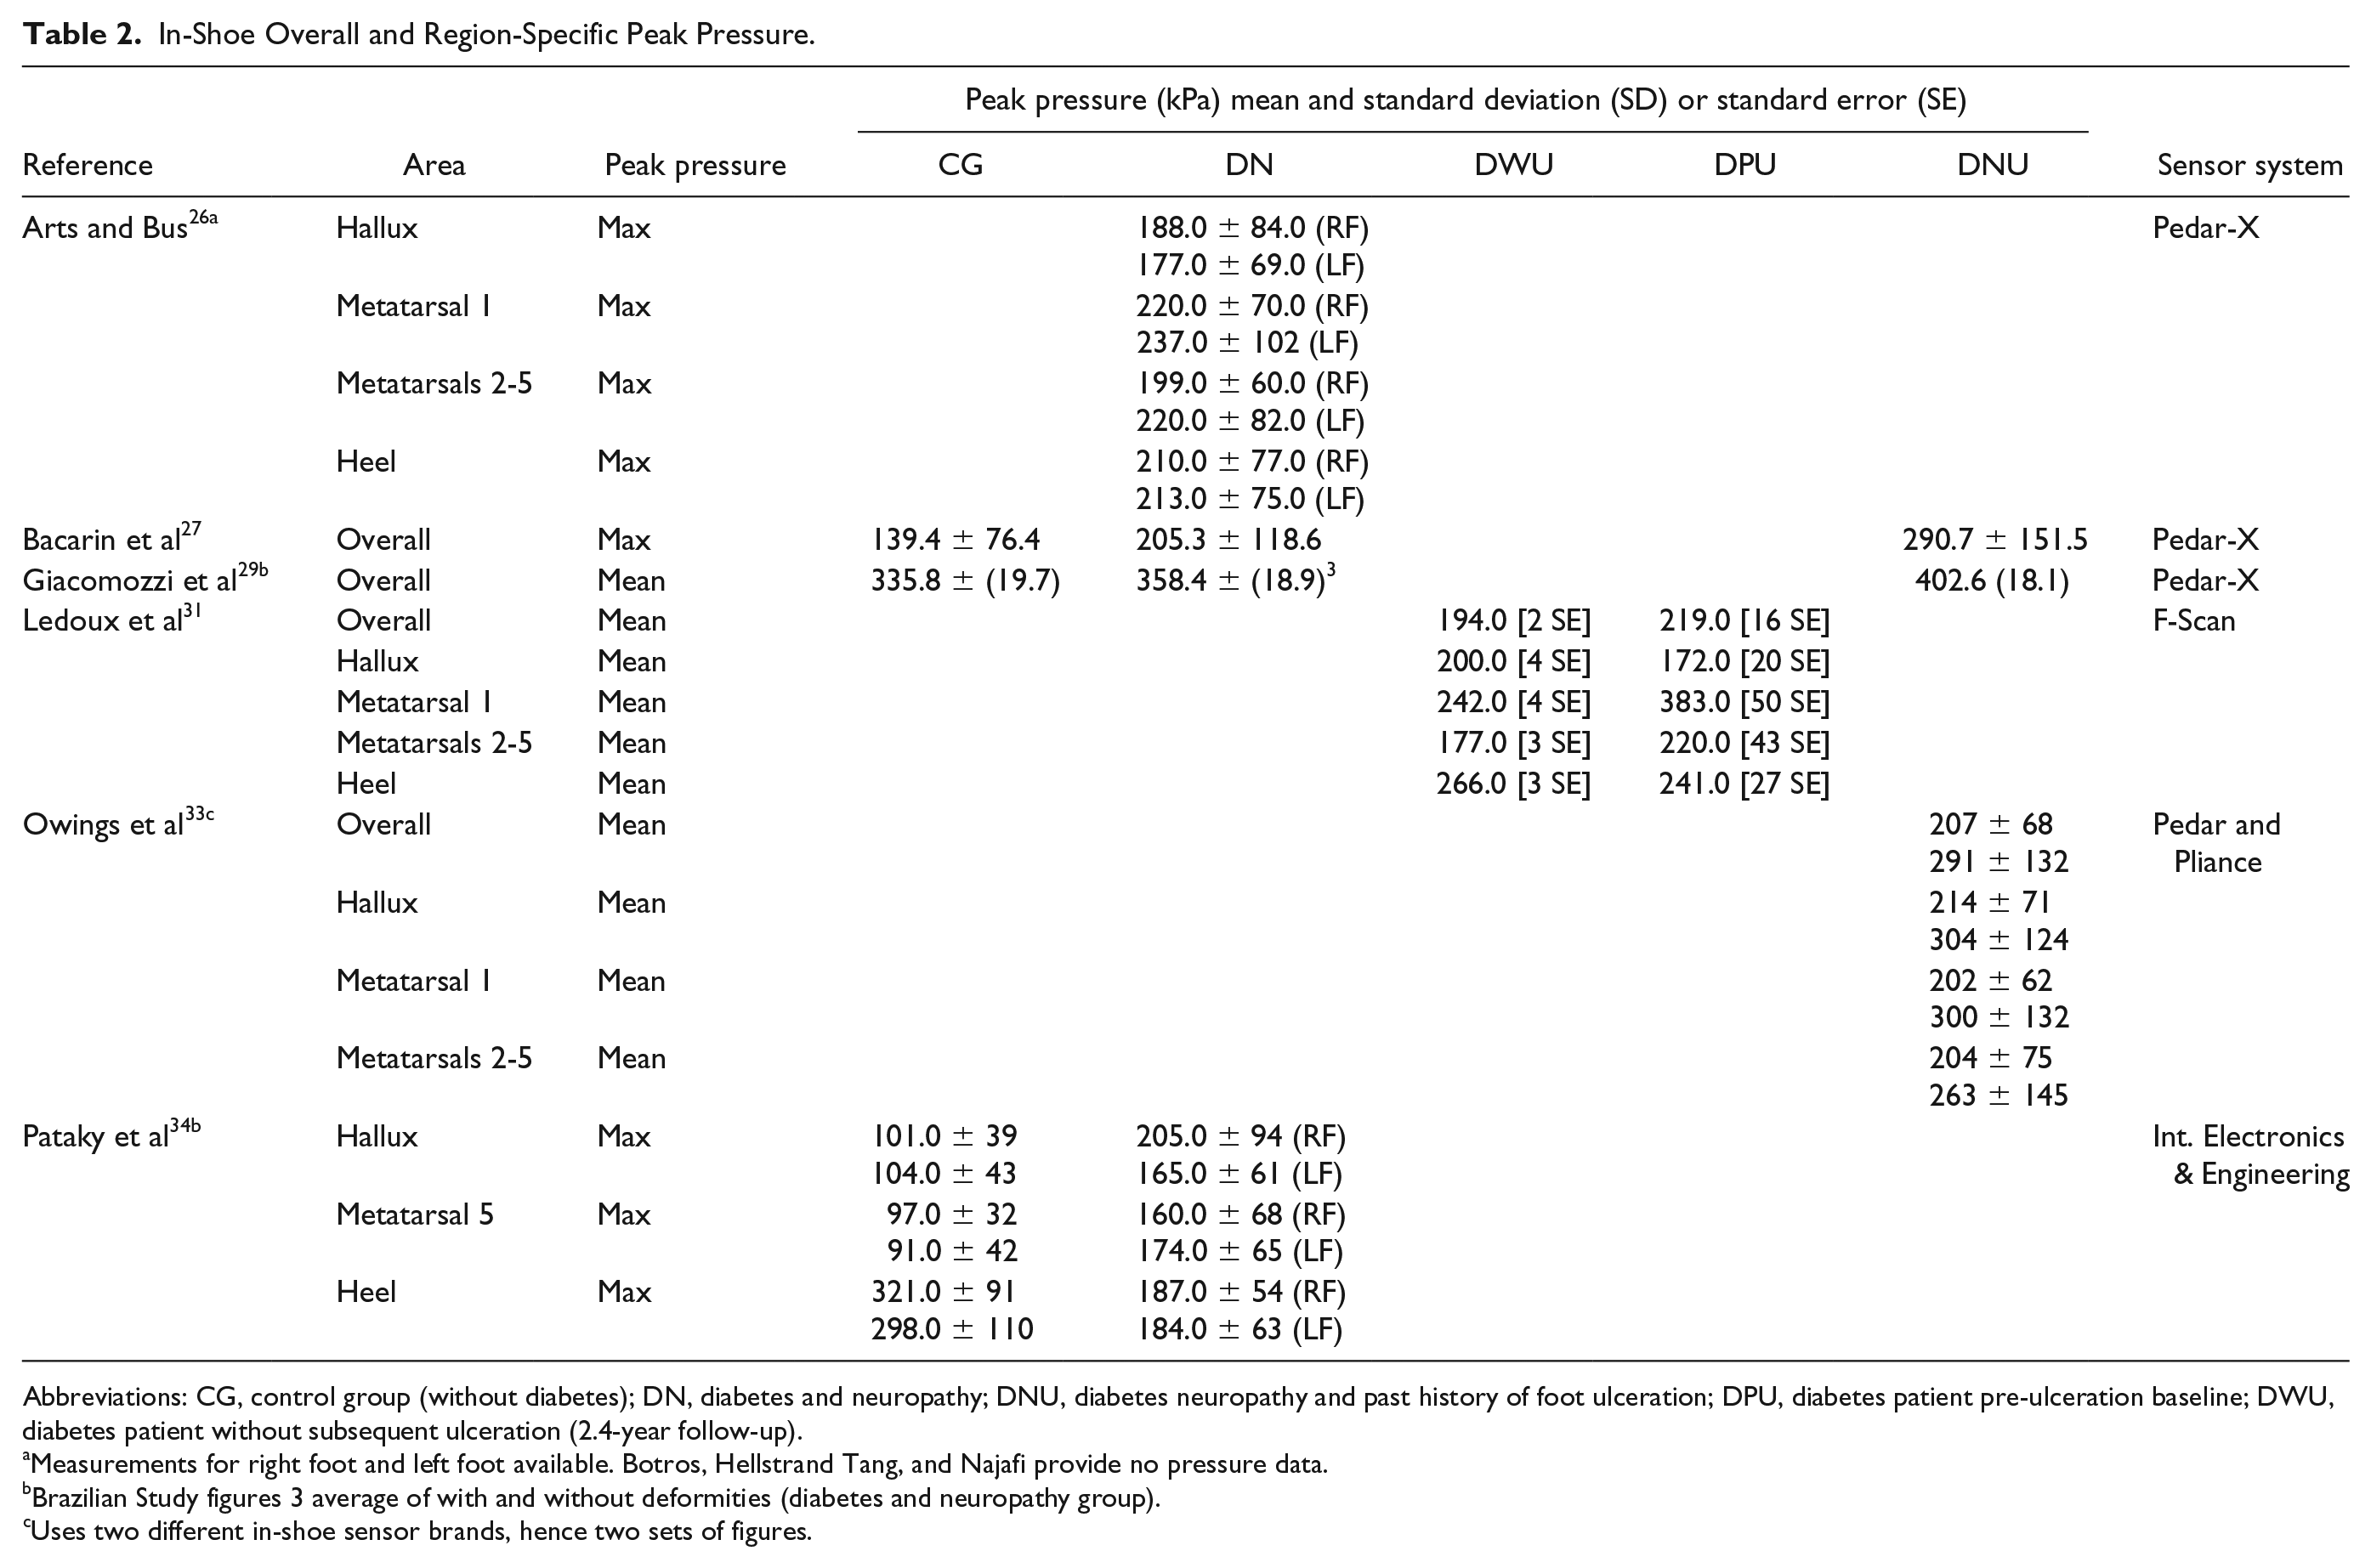
Abbreviations: CG, control group (without diabetes); DN, diabetes and neuropathy; DNU, diabetes neuropathy and past history of foot ulceration; DPU, diabetes patient pre-ulceration baseline; DWU, diabetes patient without subsequent ulceration (2.4-year follow-up).
Measurements for right foot and left foot available. Botros, Hellstrand Tang, and Najafi provide no pressure data.
Brazilian Study figures 3 average of with and without deformities (diabetes and neuropathy group).
Uses two different in-shoe sensor brands, hence two sets of figures.
Giacomozzi et al found that among 134 patients risk classification correlated poorly with pressure distribution. They added that differences in the region of interest (eg, first, third, and fifth metatarsals), degree of neuropathy, BMI, age, and walking speed rendered the studies almost impossible to compare. 29 A longitudinal study of Lavery et al, focusing on 1666 people with diabetes of whom 263 later developed an ulcer during a 24-month period, showed that peak pressure was not a suitable diagnostic tool to identify high risk patients, yielding a sensitivity of only 63.5% and a specificity of 46.3%. 24
Another study of peak plantar pressure and foot ulceration was carried out by Ledoux et al 31 in 591 people with diabetes enrolled at a single Veterans Association hospital. Overall mean pressure (based on eight areas, Table 1) was higher for subjects who subsequently developed plantar ulcers during the follow-up period of 2.4 years (219 vs 194 kPa ). However, mean peak pressure at the heel and hallux was actually lower in plantar-ulcer group despite ten of the 47 ulcers occurring at the heel and 19 at the hallux. An increase of peak pressure at the metatarsals was found to predict the risk of ulceration although only 12 of the ulcers occurred at the metatarsals. Further, this may not be generalizable to the population as a whole given the study participants were mostly male. It is also important to note that among the 544 participants who did not develop plantar ulcers, 30 withdrew from the study due to nonplantar ulcers.
Yavuz et al suggest that pressure has a low predictive value given only 38% of plantar ulcers develop at peak pressure points47,48 rather than peak shear locations.49,50 New pressure variables continue to emerge51,52 which remain the subject of debate 25 but, as with temperature, there is a strong argument not to rely on pressure in isolation but to analyze combined microclimate parameters when assessing DFU risk.
Shear
Whereas pressure is force per unit area, distributed perpendicular to the surface of the foot, shear stresses occur when two forces exert in opposing directions causing a deformation of the tissue parallel to that surface. Shear stresses have been technically difficult to measure53-55 until recently. 56 A review of plantar shear stress measurements (in studies between 1980 and 2009) highlights the wide variation in shear stress ranges previously found both in healthy feet (19-86.5 kPa) and in those with diabetes (18-72.7 kPa), although these groups were not age-matched. Subsequent research suggest that the local peak shear stress is higher in those with diabetes (mean 82.0 ± 26.4 kPa) than healthy controls (64.6 ± 15.7 kPa), and higher still in those with diabetic neuropathy (86.4-91.3 ± 29.0-30.3 kPa) and in people with a history of DFU neuropathy (135.3 ± 60.6 kPa). 57 This research begins to give us a range for shear forces within each group, although these data have been established using floor pressure plates rather than through in-shoe measurement. Shear forces on bare feet on a flat floor will differ significantly from in-shoe shear ranges and are likely to occur in different places. Compounding this, it is self-evident that different shoes and the fit of footwear will have a significant bearing on shear stress. Zou, Mueller, and Lott used in-shoe sensors to gather the mean peak maximum shear stress of 20 subjects with diabetes, neuropathy, and a history of DFU and found that forefoot shear was greater than rearfoot shear. 58 In-shoe shear ranges for those with differing degrees of neuropathy therefore also need to be collected using in-shoe sensing equipment. This will provide an important component in microclimate assessment of the risk of foot ulceration or re-ulceration. Further studies are required to standardize methodologies, but useful reference data are emerging.
Relative Humidity and Mean Skin Resistance
Moist skin typically has friction 4 to 24 times higher than dry skin 59 and the coefficient of friction can increase by a factor of two with environmental changes from cold and dry to warm and moist. 60 Moisture increases friction between skin and a surface such as an insole, causing tissue deformation when different layers of skin move tangentially relative to each other during movement. 61 Subepidermal moisture changes can be measured using bioimpedance (ie, measuring the conductive properties of skin 62 ). Baird et al measured skin hydration levels by analyzing its electrical resistance, quantifying improvement after 25% urea cream application once daily over a period of six weeks. 63 In-shoe sensors have been tested that are capable of measuring relative humidity over an eight-hour period at one minute interval. 64 Both a lack of moisture and excess moisture can affect dermal foot health and its delicate balance. Plantar surface tissue hydration relies on secretions from the sweat glands. Anhydrosis is common in diabetes 65 and can compromise the barrier function of the skin leaving it open to infection. 63 Tentolouris et al found that skin dryness positively correlates with DFU when using an adhesive neuropad to assess the moisture status of skin in 379 subjects with diabetes (ROC 0.71, sensitivity 97.1%, and specificity 49.3%). Interestingly, there are relatively few articles concerning humidity, friction, and DFU, most being concerned primarily with wound control rather than prevention. 66 A wearable sensor array including humidity and galvanic skin response along with environmental temperature and force has been trialed with 15 healthy participants within sandals. 67 However, its sampling rate was 20 Hz (compared to 40 Hz of some commercial in-shoe pressure monitoring insoles) and battery life was limited to 2.5 hours (although potentially capable of achieving 16 hours of continuous use with low power electronics). Clearly, more research is needed to determine healthy moisture levels in feet with diabetes and neuropathy through the measurement of mean skin resistance, relative humidity, and the associated coefficient of friction for skin, insole, and footwear materials, to fully understand the role of hydration in skin breakdown and repair. These could be valuable new features to add to the information about the ulceration process already gleaned from shear, pressure, and temperature to give us the complete picture of foot microclimate.
Conclusion
DFU prediction has remained difficult in clinical practice although this systematic review demonstrates that there are a number of factors strongly implicated in the development of foot ulcers. It seems sensible to combine them together by monitoring in-shoe microclimate as a whole. The inclusion of relative humidity and mean skin resistance (skin hydration) in particular has often been overlooked and should form part of microclimate measurement. Sensor systems capable of measuring microclimate including temperature, pressure, and humidity have been trialed 68 but to date (1) multi-sensing examples have yet to be applied to those at risk of DFU and/or (2) do not provide a wireless in-shoe system that might be used in every day free living. A necessary first step to the development of a microclimate sensing array is to summarize the microclimate variables implicated in ulceration to facilitate possible designs for an in-shoe microclimate sensor array.
Our summary of microclimate variables implicated in DFU (Table 3) may prove a useful starting point for the design and refinement of in-shoe microclimate arrays.
Summary of Microclimate Variables Implicated in Foot Ulceration.
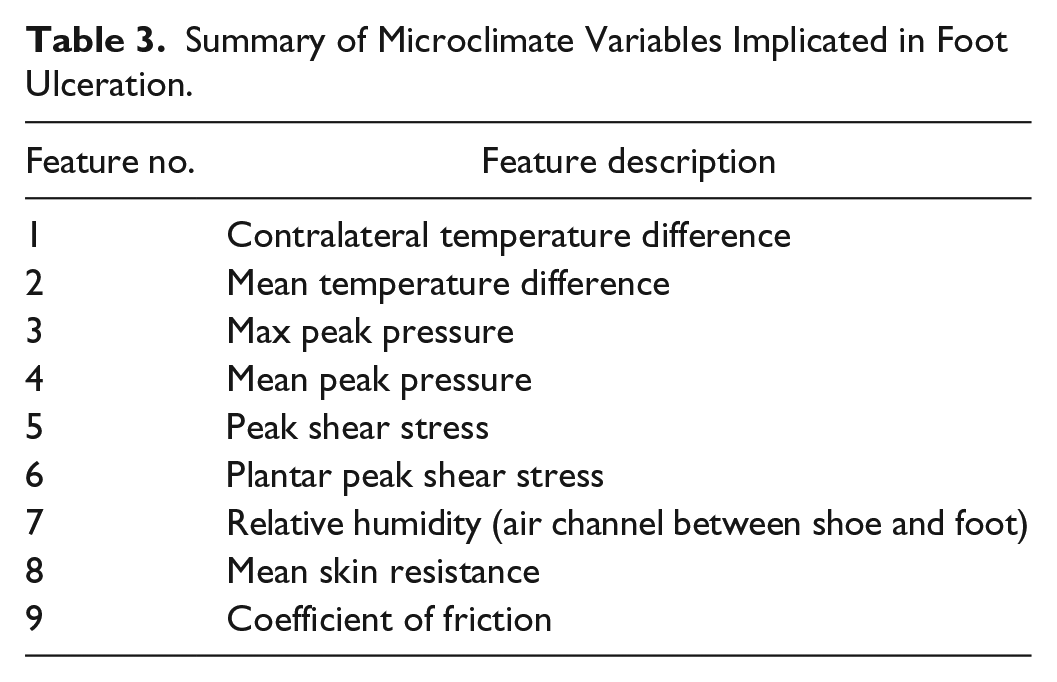
There is still considerable research required both to fully understand the inter-relationship of these compact microclimate features and to narrow down ranges implicated in a high probability of foot ulceration. Real-time, rather than “snapshot” data, may offer greater potential to develop a system that uses machine learning or other forms of pattern recognition analysis for DFU prediction. To gather real-time microclimate data during free living activities, the lifespan and durability of sensors will be critical. Another challenge to be overcome concerns sensor placement configuration. The available evidence summarized in this review shows how the placement of sensing apparatus or definition of region of interest within the foot largely varies. This needs to be standardized, perhaps tailored to statistical studies of likely ulcer locations, or taking into account the past history of the person with diabetes. 69 Future research will also need well-described cohorts with a clear definition of neuropathy and peripheral vascular disease.
Physical activity can also be monitored using wrist and thigh accelerometer devices 70 whose data can be cross-referenced against microclimate data and the risks of ulceration. If large numbers of people can be equipped with such in-shoe sensor arrays, machine learning algorithms would enable us to also look for real-time patterns in this kind of movement data, and tools like principal components analysis can be used to further reduce the microclimate features identified above into a smaller and more manageable number of predictive components. However, the first necessary step is to design, prototype, and validate potential microclimate sensor arrays. Only then, it will be possible to develop a better predictive model based on the complex and dynamic environment of the foot.
Footnotes
Acknowledgements
The authors thank and appreciate Leicester General Hospital Library Service.
Declaration of Conflicting Interests
The author(s) declared no potential conflicts of interest with respect to the research, authorship, and/or publication of this article.
Funding
The author(s) received no financial support for the research, authorship, and/or publication of this article.