
Abstract
Background:
Accurate self-monitoring of blood glucose (SMBG) is a key component of effective self-management of glycemic control.
Methods:
The OneTouch Verio Reflect and OneTouch Ultra Plus Reflect BG monitoring systems were evaluated for accuracy in a clinical setting. Subjects also used the meters for a one-week trial period and reported their level of satisfaction with meter features.
Results:
Both systems were accurate over a wide glucose range and met lay user and system accuracy BG standards described in ISO15197:2015. Subjects felt that the features of a meter with a dynamic color range indicator and personalized guidance, insight, and encouragement could provide significant benefits to them in the management of their diabetes.
Conclusions:
Both meter systems were accurate over a wide glucose range and the features of the meter and messages were well received by patients in a short take-home trial.
Clinical trial registration:
Clinicaltrials.gov NCT0351542
Keywords
Introduction
Self-monitoring of blood glucose (SMBG) is recognized as an integral part of diabetes care management in people with type 1 diabetes (T1D) and type 2 diabetes (T2D), allowing them to evaluate their individual response to therapy and impact of diet and physical activity.1-5 However, blood glucose monitoring systems (BGMS) may be susceptible to error from a variety of factors6,7 and the experts recognize the need for improved glucose meter performance.8,9
The current study evaluated the accuracy of two new glucose meter systems according to the International Organization for Standardization ISO15197:2015(E). 10 Subjects were also given an opportunity to use the meter at home and measure their satisfaction with its features and potential to help them manage their diabetes.
Materials and Methods
Study Materials
Sponsor (LifeScan, Wayne, PA, United States) provided three lots of Verio or Ultra Plus test strips randomly sourced and sequestered from supply chain batches. Sponsor also provided YSI 2900 STAT PLUS Analyzers (Yellow Springs, OH, United States). The YSI 2900 is accepted as a reference method for CE-mark, but not by the FDA.
Study System
The OneTouch Verio Reflect and OneTouch Ultra Plus Reflect meters provide glucose results over the range of 20 to 600 mg/dL within a hematocrit range of 20% to 60% and an operating temperature range of 10°C to 40°C without the need for user calibration coding. Both systems use BG test strips which utilize a flavin adenine dinucleotide-dependent glucose dehydrogenase enzyme to provide plasma-equivalent glucose results with minimal interference.11,12 The strip requires 0.4 μL of fresh capillary blood, has a five-second test time, and corrects for hematocrit, temperature, and common electroactive interferences. 13
The meter has a ColorSure Dynamic Range Indicator that points to low, high, or one of the five in-range segments that lets patients know where their result lies according to their customizable glucose range (Figure 1a). The meter has a Blood Sugar Mentor which provides the patient personalized guidance (Figure 1b), insight (Figure 1c), and encouragement (Figure 1d) based on algorithms giving 24 different messages based on individual results. In addition, it has a test tracker for setting recommended daily testing frequency goals, and a graph which shows patients how they are trending over time. When used in conjunction with the OneTouch Reveal mobile app, readings from the meter will automatically synch with the app via Bluetooth low energy connectivity.
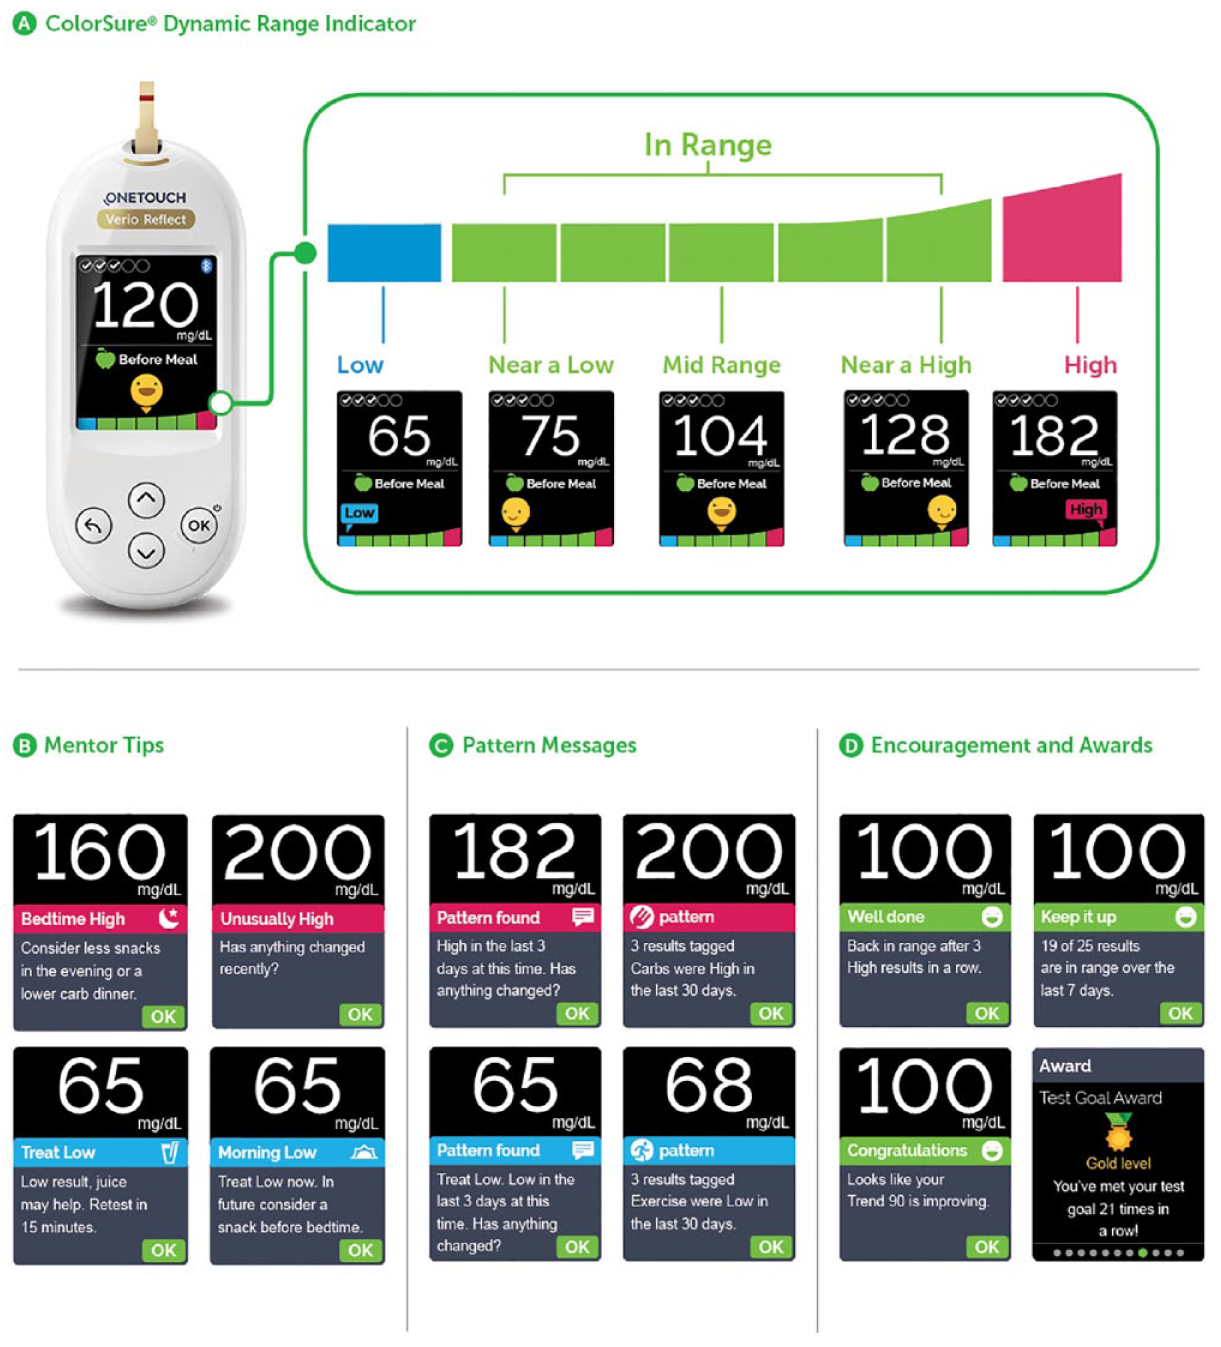
OneTouch Verio/Ultra Plus Reflect blood glucose monitoring systems. (a) ColorSure Dynamic Range Indicator. A changing emoji pointing to the green color bar indicates that the current blood glucose result is in range or is nearing high or nearing low. A message points to the blue bar if the result is low and points to the red bar if the result is high. (b) Mentor tips. (c) Pattern messages. (d) Encouragement and awards.
Study Design
Subjects aged ≥15 years with a current diagnosis of T1D or T2D and screening hematocrit values within 20% and 60% were used. Accuracy evaluations were followed by a one-week home use period in a subset of participants. Protocols were approved by the responsible ethical review committees and all participants gave written informed consent prior to study procedures.
Lay User Accuracy Testing
Self-testing was performed by subjects with SMBG experience, but without experience with the BGMS being tested and were permitted to read the Owners Booklet. Subjects lanced a fingertip and performed a self-test using both systems and a test strip from the assigned lot. Study staff collected blood from the same finger puncture for hematocrit and reference plasma glucose testing.
Lay user evaluations were conducted at National Health Service sites: Royal Infirmary of Edinburgh; Birmingham Heartlands Hospital; Highlands Diabetes Institute, Inverness and at the Institute for Diabetes Technology (IfDT), Ulm, Germany.
System Accuracy Testing
System accuracy testing was conducted after lay user testing to avoid influencing subject performance in the former. Study staff lanced a different subject fingertip and collected blood for YSI reference plasma glucose testing. Study staff then applied blood from the subject’s lanced fingertip onto three strip lots tested in duplicate in each meter. Blood was also tested in two control meters providing a total of 14 results per subject. Finally, the study staff collected blood from the same lancing for a repeat YSI reference plasma glucose testing. The glucose level into which the sample fell was determined according to the average of the YSI readings. Blood samples were collected to meet glucose distribution “bins” described in ISO15197:2015(E). 10
Home Use Testing
A subset of subjects participated in home-use in which subjects were asked to conduct regular SMBG and perform a series of tasks covering the functionality of the meter. When the subjects returned to the clinic, they answered a questionnaire seeking their opinion of the meter features on a five-point scale (5 = strongly agree; 4 = agree; 3 = neither agree nor disagree; 2 = disagree; 1 = strongly disagree). A favorable response was defined as a response of “strongly agree” or “agree.”
Data Analysis and Acceptance Criteria
To assess bias, fingertip test results were compared to the reference method (YSI2900) and assessed against the accuracy standards in ISO15197:2015(E) 10 in which 95% of the measured glucose values shall fall within either ±15 mg/dL of the average measured values of the reference measurement procedure at glucose concentrations <100 mg/dL or within ±15% at glucose concentrations ≥100 mg/dL. A total of 99% of individual glucose measured values shall fall within zones A and B of the consensus error grid for T1D.
Results
Lay User Accuracy
A total of 313 subjects, 172 males and 141 females, participated in the study. Median age was 59.1 years, with a range of 15 to 82 years. A total of 42.5% of subjects had T1D; 57.5% had T2D; and 74% of subjects were taking insulin either by bolus, insulin pump, or along with oral medications. The mean time since diabetes diagnosis was 19.2 years with a range of 0.9 to 61.7 years. Subjects had a median frequency of SMBG of three tests per day.
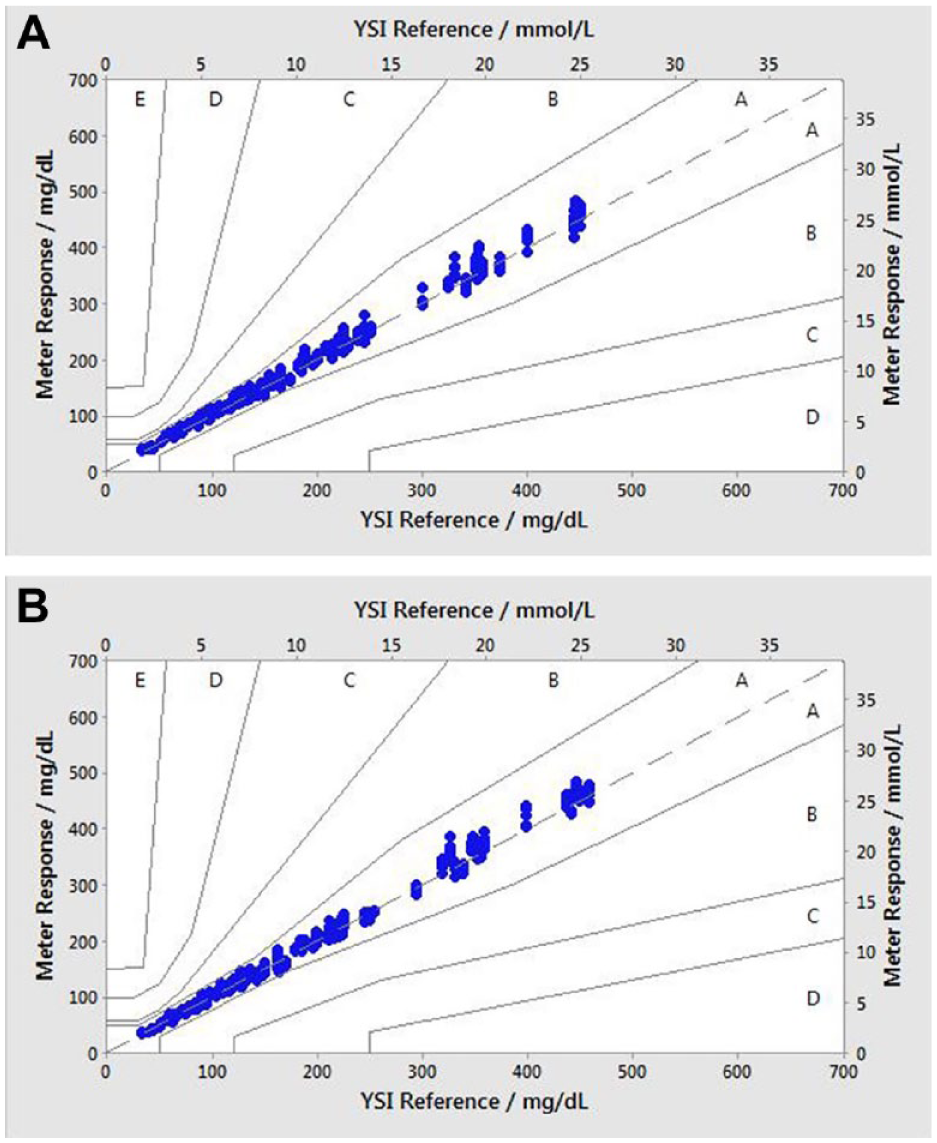
Table 1 summarizes lay user accuracy results across all three lots tested for both meters. ISO15197:2013(E) accuracy criteria were met when all glucose values were taken together with 96.5% (Verio) and 98.1% (Ultra Plus) of results within the acceptance criteria. Similar results were seen when each reagent lot was analyzed individually (data not shown). A total of 96.4% (Verio) and 97.8% (Ultra Plus) of BG results ≥100 mg/dL had a bias within the ±15% limits, and 97.1% (Verio) and 100% (Ultra Plus) of BG results <100 mg/dL had a bias within the ±15 mg/dL limit.
Clinical Accuracy of OneTouch Verio Reflect and OneTouch Ultra Plus Reflect Blood Glucose Monitoring Systems.
Data shown for system accuracy are from duplicate samples in three batches in 100 patients.
Data shown for lay user accuracy are from patient conducted finger sticks in 313 patients.
System Accuracy
Table 1 summarizes the system accuracy results across all three lots tested. ISO15197:2013(E) accuracy criteria were met when all glucose values were taken together with 99.5% (Verio) and 99.7% (Ultra Plus) of results within the acceptance criteria. Similar results were seen when each reagent lot was analyzed individually (data not shown). A total of 100% (Verio and Ultra Plus) of BG results <100 mg/dL were within a bias of ±15 mg/dL, and 99.3% (Verio) and 99.5% (Ultra Plus) of results ≥100 mg/dL had a bias within the ±15% limit.
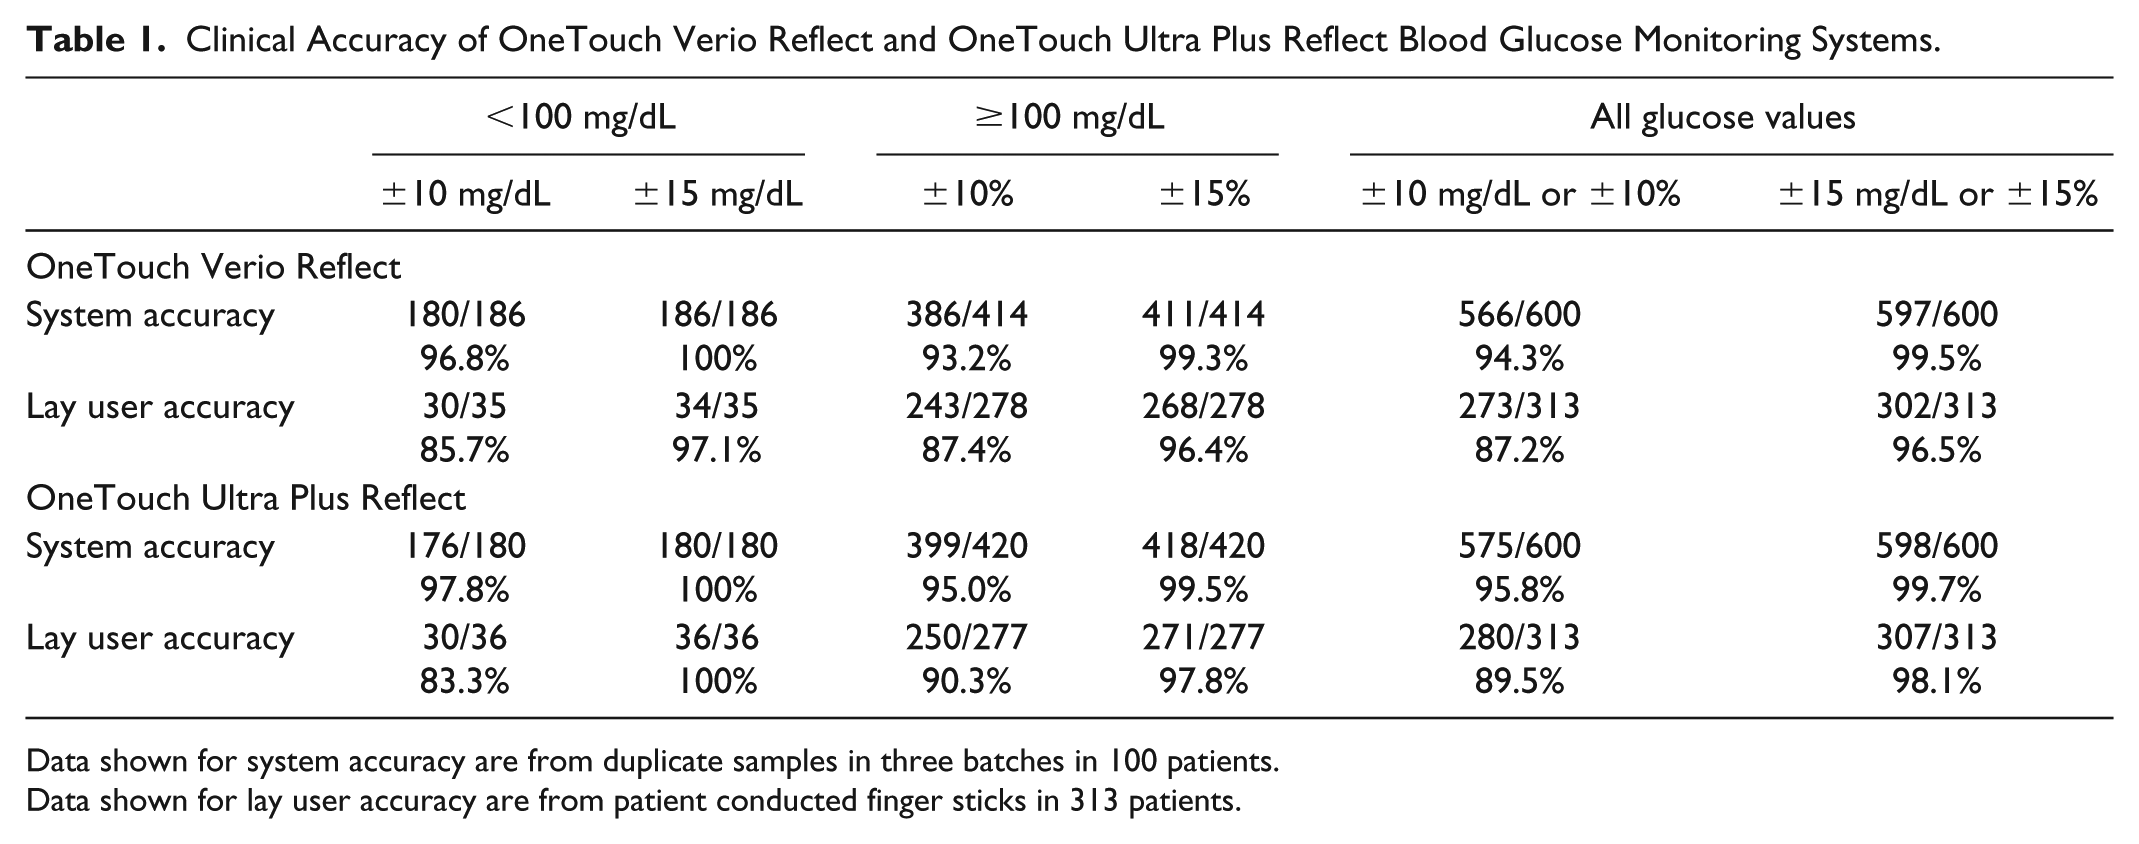
Figure 2 shows the glucose results obtained with Verio (Figure 2a) and Ultra Plus (Figure 2b) meters and the corresponding YSI reference glucose concentration results. The accuracy limit lines are ±15 mg/dL at glucose concentrations <100 mg/dL and ±15% at glucose concentrations ≥100 mg/dL. Each individual BG result is shown and demonstrates that >95% (597/600, Verio) and >95% (598/600, Ultra Plus) of the values fell within these accuracy threshold limits.
System accuracy blood glucose bias plot. Blue dots represent blood glucose results within the ±15 mg/dL (<100 mg/dL) or ±15% (≥100 mg/dL) accuracy limit lines for three lots. Open circles represent blood glucose results outside these limits. (a) OneTouch Verio Reflect. Blue dots, n=597; open circles, n=3. (b) OneTouch Ultra Plus Reflect. Blue dots, n=598; open circles, n=2.
Linear Regression Analysis
Regression analysis data for all three lots taken together for system accuracy and lay user testing for each meter demonstrated a highly significant correlation (P < .001) between the meters and the reference standard (YSI) values (data not shown).
Consensus Error-Grid Analysis
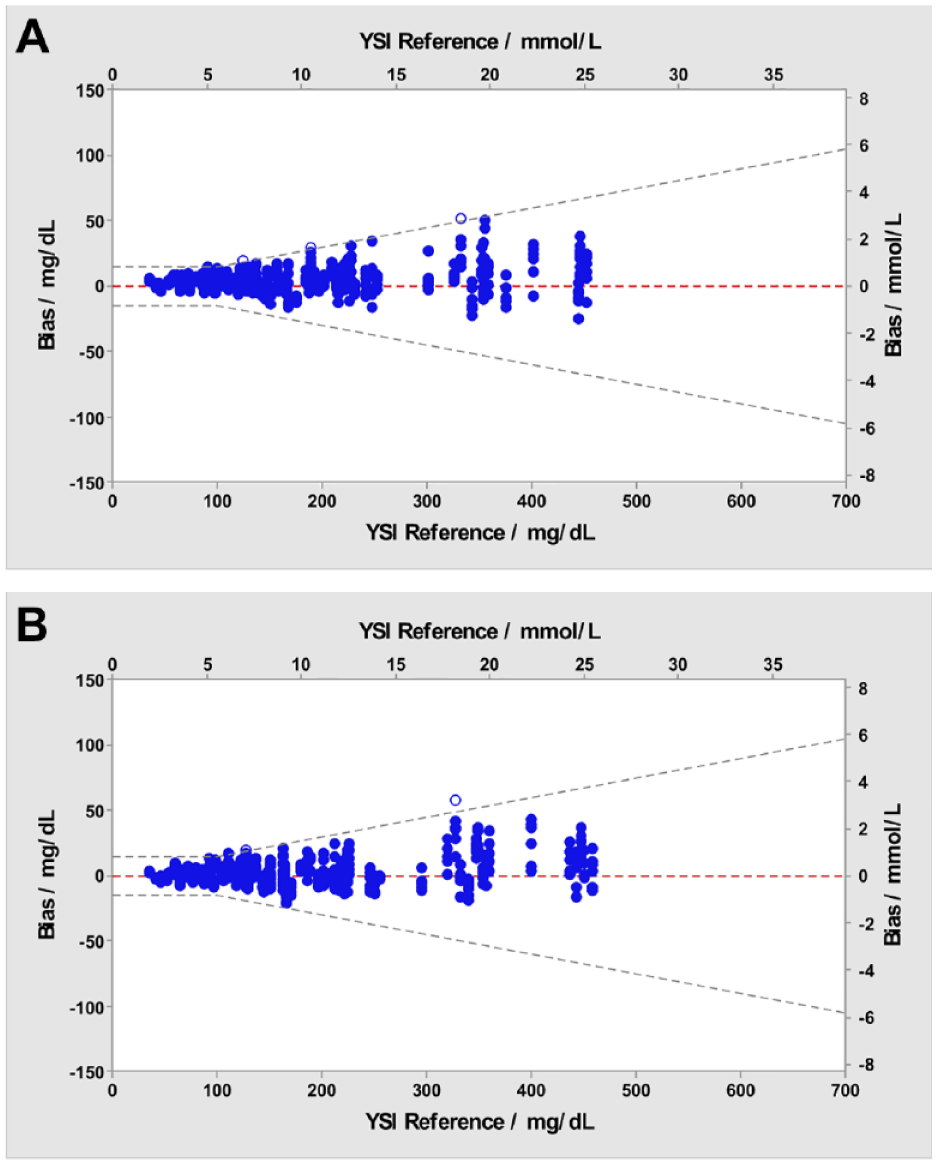
The consensus error grid is a plot of BGMS results that signify the degree of clinical risk posed to a T1D user obtaining an incorrect measurement on their BG meter.14,15 A total of 100% (600/600) of individual glucose values for each meter fell within zones A of the consensus error grid (Figure 3a, b), indicating that the results would be expected to have no effect on clinical outcomes.
Consensus error grid plot glucose plot. (a) Verio test strips; (b) Ultra Plus test strips. Zone A: no effect on clinical action; zone B: altered clinical action—little or no effect on clinical outcomes; zone C: altered clinical action—likely to affect clinical outcomes; zone D: altered clinical action—could have significant medical risk; and zone E: altered clinical action—could have dangerous consequences. N = 600 data points (200 per test lot). All data points fall within zone A.
Patient User Acceptance Survey
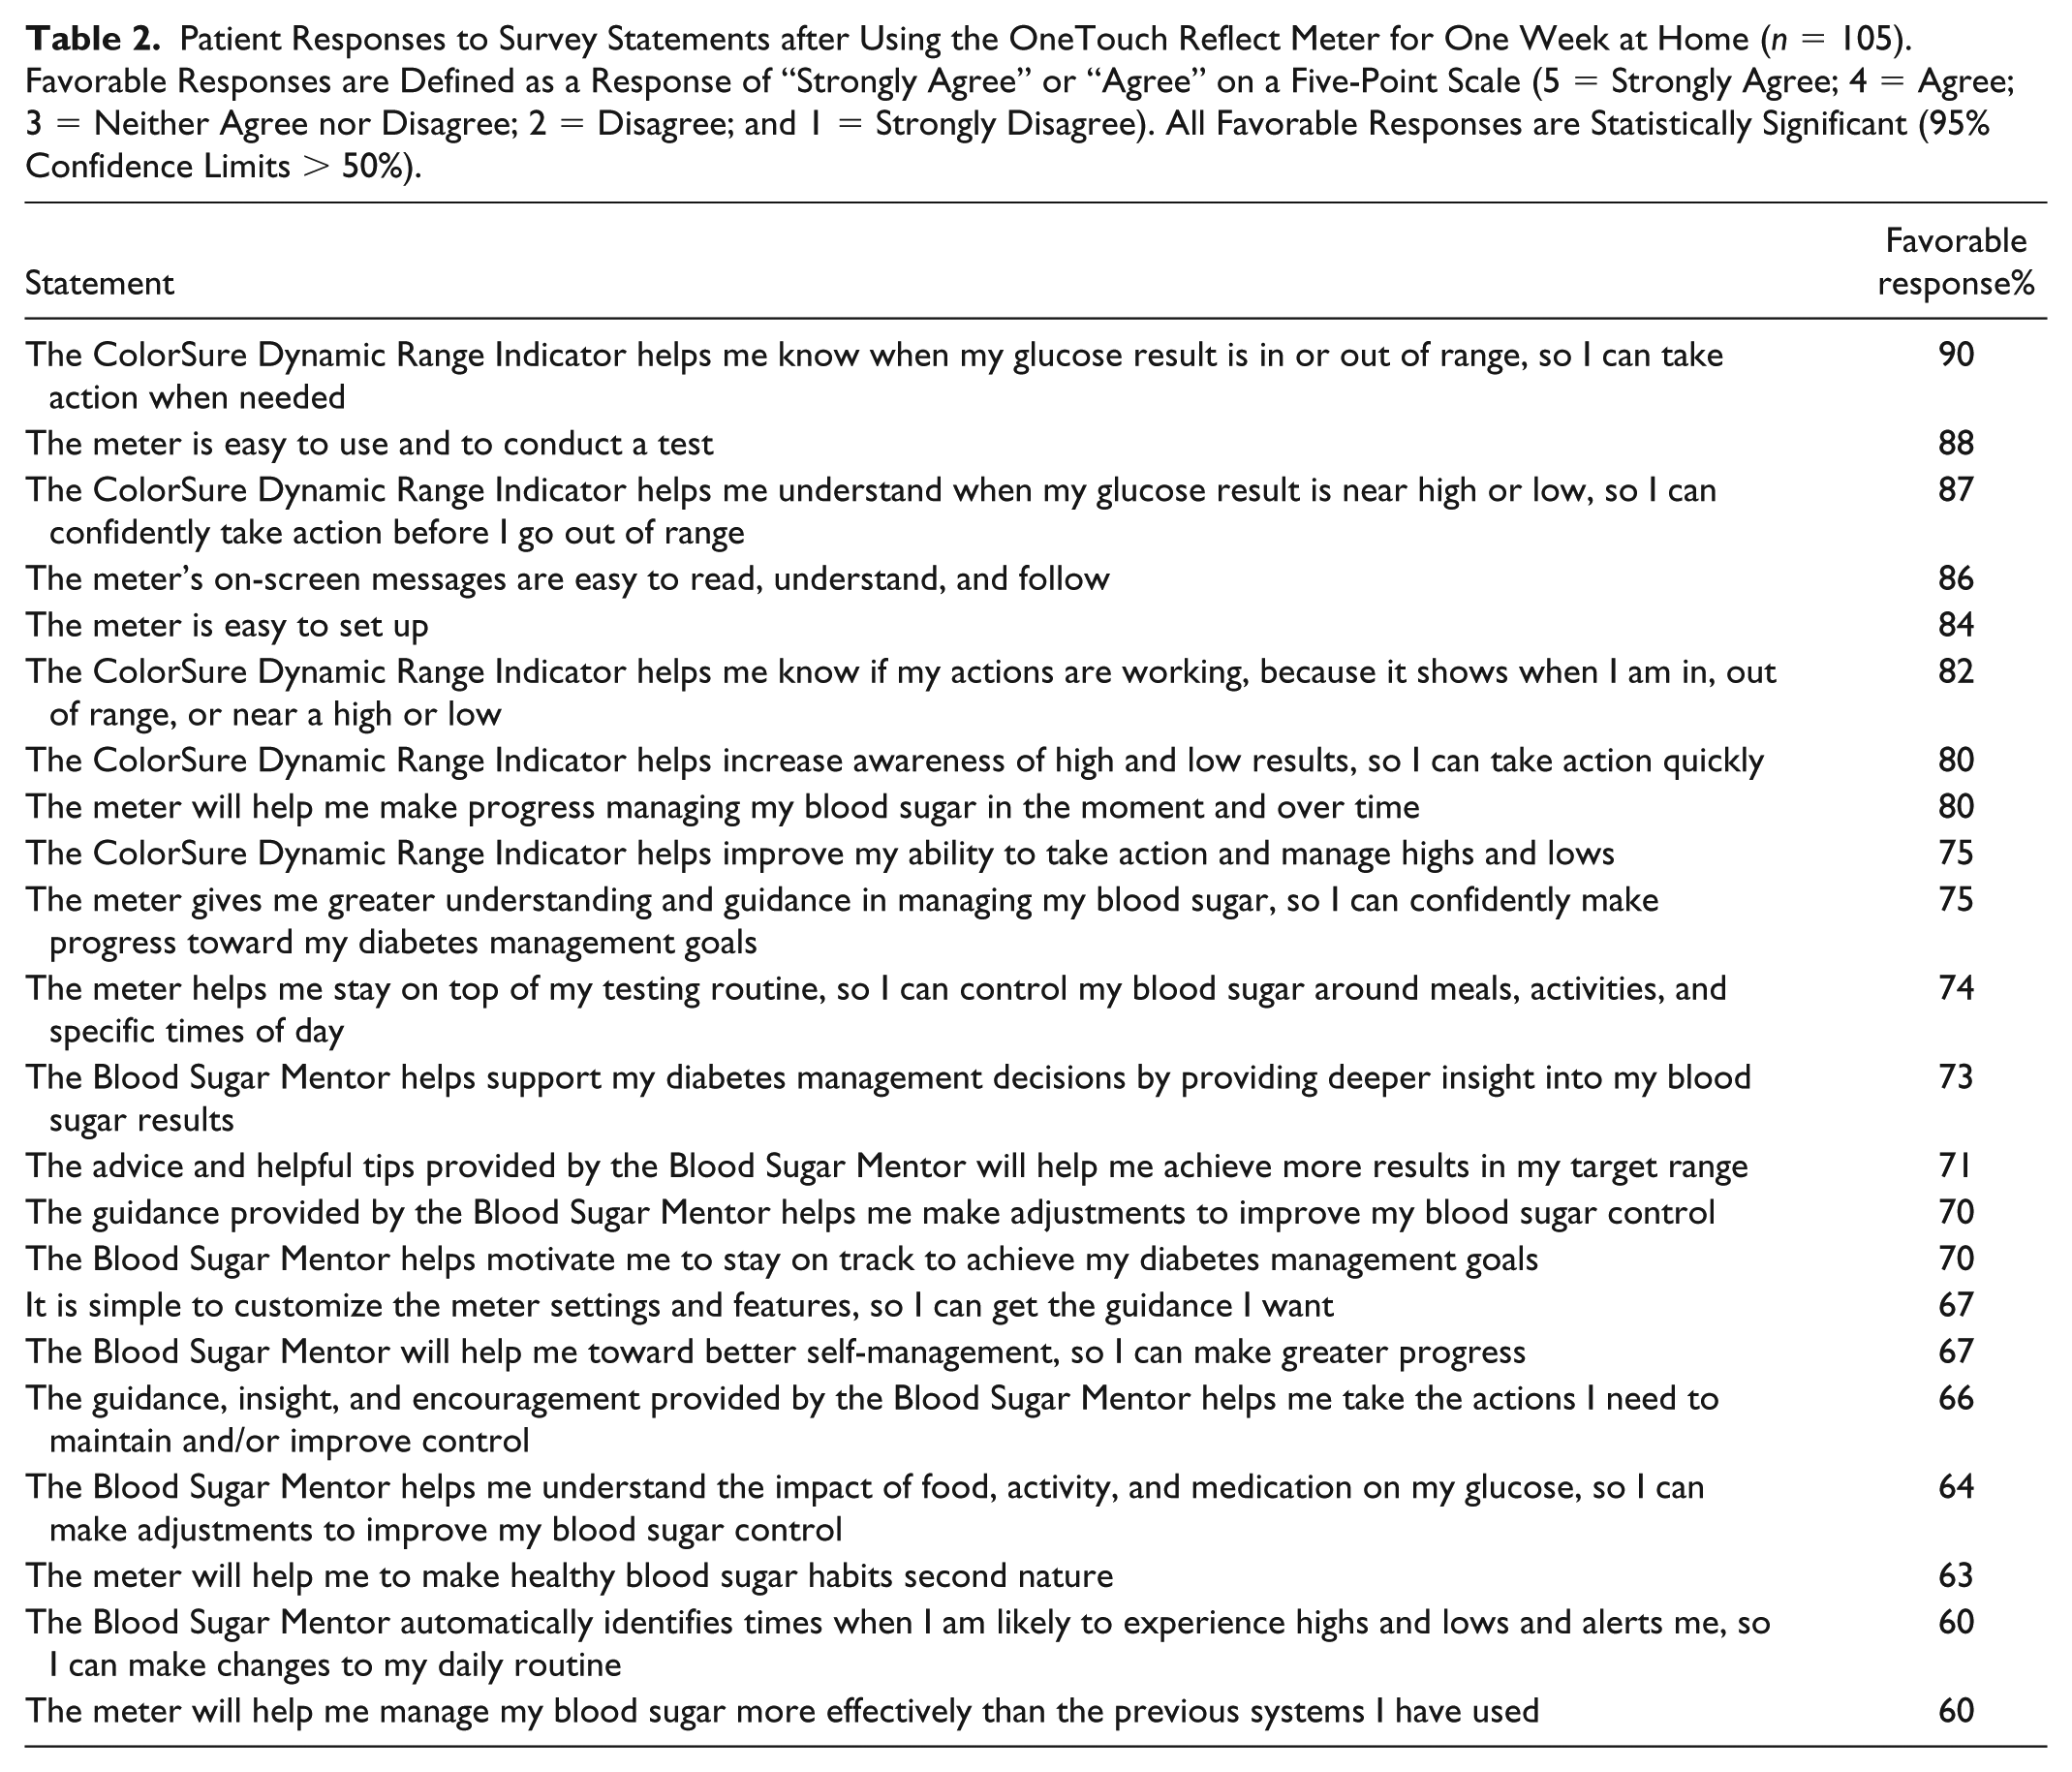
Table 2 shows the favorable response rates to the statements presented to 105 subjects at the end of Visit 2 following their one-week take home period with the Reflect BGMS. Key findings include 91% of subjects agreed or strongly agreed that the ColorSure Dynamic Range Indicator helped them know when their glucose results were in or out of range, so they could take action when needed.
Patient Responses to Survey Statements after Using the OneTouch Reflect Meter for One Week at Home (n = 105). Favorable Responses are Defined as a Response of “Strongly Agree” or “Agree” on a Five-Point Scale (5 = Strongly Agree; 4 = Agree; 3 = Neither Agree nor Disagree; 2 = Disagree; and 1 = Strongly Disagree). All Favorable Responses are Statistically Significant (95% Confidence Limits > 50%).
Safety and Tolerability
One subject experienced syncope. There were no other adverse events observed other than the anticipated effects of the lancing procedure such as bleeding and transient mild pain at the site of lancing.
Discussion
A symposium on BG monitoring published as a special publication platform of Journal Diabetes Science and Technology highlighted the importance of measurement accuracy and precision for all patients using SMBG. 16 In the current clinical evaluation, each new BG system met ISO15197:2015(E) accuracy criteria for approval. The accuracy criteria specified in the ISO15197:2015(E) guideline is used for regulatory clearance in most countries in the EU and uses a 100 mg/dL cut-point for data evaluation.
Despite advances in technology and medications, only about 50% of people with diabetes are at their target BG levels and there has been little improvement in this level since 2003. 17 Many people living with diabetes do not achieve their BG targets due to a lack of understanding of their results and the inability to know what action to take. 18 The new meter tested has a Blood Sugar Mentor feature that automatically generates color-coded messages of personalized guidance that displays diabetes management information when the results are trending low and high, when the meter identifies a pattern of results falling outside the high and low range limits and provides encouragement with motivational messages. The ColorSure Dynamic Range Indicator provides real-time information to help patients avoid highs and lows. Identification of patterns helps patients understand the impact of food, activity, and medication on their glucose; identify possible causes that may have caused these glucose patterns; and make adjustments to improve their blood sugar control. Encouragement motivates patients to stay on track to achieve their diabetes management goals. Messages such as “well done,” “keep it up,” and “congratulations” appear on the meter based on specific algorithms. In addition, awards provide a level of gamification and are earned when certain criteria are met, such as meeting the daily testing frequency goal or tagging results after a meal. Finally, the mobile app will automatically send patients messages on their meter when recurring patterns of high or low BG are detected so patients may act to avoid them in the future.
Patients using this meter felt strongly that these features would be of potential benefit to them. They remarked that the range indicator could help them know when their glucose result is in or out of range, so they can take action when needed. They believed that the meter could help them stay on top of their testing routine so they could control their blood sugar around meals, activities, and specific times of day. Finally, they felt that encouraging messages could help motivate them and keep them on track during their diabetes management.
In conclusion, both meter systems were accurate over a wide glucose range and met lay user and system accuracy standards described in ISO15197:2015. In addition, the features of the meter and messages were well received by patients in a short take-home trial.
Footnotes
Acknowledgements
The authors thank Kirsty Macleod, Elizabeth Gilman, Krisna Corrigall, Barry Irvine, Danielle King, and Stuart Phillips for assistance on the clinical evaluations. The authors also thank the scientists at IfDT for their contributions to the conduct of the study and Vidifix for help with the figures.
Declaration of Conflicting Interests
The author(s) declared the following potential conflicts of interest with respect to the research, authorship, and/or publication of this article: LK, BG, and LS are full-time employees of LifeScan Global Corporation. HC is a consultant to LifeScan.
Funding
The author(s) disclosed receipt of the following financial support for the research, authorship, and/or publication of this article: This work was funded by LifeScan Global Corporation.