
Abstract
Background:
Despite the benefits and clinical necessity of insulin treatment in type 2 diabetes (T2D), healthcare providers are reluctant to initiate insulin, and patients are reluctant to start it for several reasons, one of these being the complexity of insulin treatment. Patients and their healthcare providers can benefit from titration algorithms (TAs) or rules that assist with the initiation and titration of insulin, performing the calculations that are needed to safely initiate and conservatively adjust.
Methods:
The primary objective for this in silico study was to examine the effectiveness of 3 dose TAs (1-3) for optimization of basal insulin glargine (Gla-100 and Gla-300). In the simulations, 100 virtual subjects with T2D were included (50% men, age 62 ± 3 years, HbA1c 8.1% ± 2.9%, body weight 94 ± 16 kg). Subjects were studied under each TA (TA1 and TA2 fasting blood glucose [FBG] targets 90-130 mg/dL, TA3 FBG target 110-150 mg/dL). Initial dose of both insulins was based on 0.2 U/kg body weight. During 3 months, subjects reported their FBG to the LTHome web-based dose guidance system with a rules engine to safely guide long-acting insulin titration and maintenance. Subjects followed dose recommendations to reach designated FBG target ranges.
Results:
All subjects reached stable doses under all TAs with both Gla-100 and Gla-300 insulin, and 93 or more of the 100 subjects, depending on the assigned TA, achieved the target FBG range within the 3-month simulation for all TAs. Mean FBG was lowered (Gla-100: 155 ± 40 to 118 ± 11 mg/dL with TA1 and TA2 and 132 ± 12 mg/dL for TA3; Gla-300: 125 ± 14 with TA1 and TA2 and 134 ± 15 mg/dL with TA3). Calculated HbA1c improved from 8.1% ± 2.9% to 7.1% ± 2.5% for TA1 and TA2 and 7.5% ± 2.5% for TA3, a reduction of 0.9% and 0.6% over 3 months for both insulins. Three subjects on Gla-100 and one subject on Gla-300 experienced mild hypoglycemia.
Conclusion:
All TAs delivered safe dose recommendations with minimal hypoglycemia, leading to a stable glucose control in the majority of subjects.
Introduction
The majority of people with type 2 diabetes mellitus (T2DM) fail to achieve the HbA1c target of <7.0% with intensive, multiple, oral antidiabetic medication treatment. 1 Ideally, the treatment approach and glycemic targets are individualized soon after diagnosis and adjusted as disease progresses to maintain control. Over time, however, insulin therapy is often the best and requisite treatment for optimal glucose management. 2 Despite the benefits and clinical necessity of insulin treatment, many healthcare providers are reluctant to initiate insulin, and patients are reluctant to start it.3,4 While the benefits of insulin are well described in large randomized clinical trials5,6 and recommended in prominent position statements,2,7 the fear of hypoglycemia persists as the primary barrier to best treatment practices. Physicians, patients, and even diabetes specialists have reported they would treat patients more intensively if hypoglycemia were not a concern.3,8 On closer examination, the risks of both severe and mild hypoglycemia are less frequent in patients with T2DM on insulin than those with T1DM, and found to be similar to what is observed in patients treated with sulfonylureas (0.1 with insulin vs 0.1 episodes with sulfonylureas per year). 9 In light of this, failure to start insulin rather than increasing or maintaining high doses of oral antidiabetics may worsen short-term hypoglycemia risk as well as long-term prognosis. Many oral treatment options are available, but fail as endogenous insulin levels dwindle, 10 and once their effect becomes insufficient, insulin treatment with appropriate supervision is the best way to attain and sustain glycemic control.10-12
This is typically achieved by adding a basal insulin to previous medications because they are associated with modest hypoglycemia risk compared to premixed and prandial insulin regimens.10-12 Long-acting (LA) first-generation basal insulins such as Lantus (insulin glargine, Gla-100, Sanofi) and second-generation basal insulin Toujeo (insulin glargine, Gla-300, Sanofi) have a flat time-action profile and afford consistent glucose lowering effect over 24 hours with minimal hypoglycemia and good control of basal glucose excursions. 13 They can be titrated in a way that lowers fasting blood glucose (FBG) to a normal target with low risk of night time hypoglycemia. 14 Recent studies of T2DM adults treated with Gla-300 showed statistically significantly better BG stability with low within- and between-day variability, longer duration of action, and less hypoglycemia (most evident during the night) with Gla-300 than with Gla-100.15,16
T2DM patients and their healthcare providers can benefit from titration algorithms (TAs) or rules and the built-in rules engines in medical devices that assist with the initiation and titration of a once daily injection of LA glargine insulin. These TAs perform the complex calculations that are needed to safely initiate and conservatively adjust LA insulin dosing over several days and weeks toward a selected glucose target14,17 while avoiding hypoglycemia.18-22 This titration process is monitored by a qualified healthcare provider and has proven to be successful and cost effective. 20 With this approach it would be essential to examine circumstances (intentional or unintentional) that may be associated with rapid fluctuations of BG, to better understand potential limitations in the TAs and the in-built rules engine.
This in silico study was performed with the primary objective to examine the overall safety and effectiveness of titration support provided by 3 different TAs and the built-in rules engine in 2 devices (LTHome, a web-based dose guidance system for LA insulins, and MyStar DoseCoach, a BG monitoring system carrying the same dose guidance system for LA insulins, Sanofi, Germany), for initiation and optimization of basal insulin glargine (Gla-100 [Lantus] and Gla-300 [Toujeo]), in subjects with T2DM when used as a daily dosing guide for treating FBG to normal target ranges. The algorithms and the rules engine making use of these algorithms are identical in both devices. For our study, an interface was programmed which gave the required information (recent FBG, last insulin dose, and hypoglycemic events since the last injection if any on a daily basis) from the simulation output for the respective virtual patient to the website and gave back the recommended next insulin dose as input to the simulator. The in silico environment (www.tegvirginia.com 23 ) was used primarily to study the TA titration process and examine interferences caused by intentional or unintentional circumstances of self-management. These interferences include metabolic changes known to occur during high-intensity (HI) exercise,24-27 overeating, 28 and acute illness, 29 in patients with T2DM. The intent of this in silico study was to create virtual situations that would allow multiple opportunities for TA adjustments of the Gla-100 and Gla-300 doses under extreme conditions. The results can be used to examine the glucose dynamics in people with T2DM experiencing the variability of lifestyle events to determine possible risk without exposing them in a clinical study. Learnings from the simulations can provide a better understanding of the TA performance in adjusting LA insulin dosing during these events with both Gla-100 and Gla-300.
Methods
Diabetes Mellitus Metabolic Simulator
To simulate basal insulin therapy in virtual subjects with T2DM, we used the Diabetes Mellitus Metabolic Simulator (DMMS, www.Tegvirginia.com), a simulation model representing glucose, insulin, and glucagon dynamics over a 24-hour period and a population of 100 in silico subjects with T2DM. These virtual subjects were generated by randomly extracting different realizations of parameter vectors from a parameter distribution matrix in the manner previously described, however, with insulin/glucose responses representing T2DM. 23 One hundred T2DM subjects are represented in the simulator by a vector containing subject-specific model parameters.
Characteristics of the T2DM population are presented in Table 1 and are similar to baseline and oral glucose tolerance measures reported in clinical studies in people with T2DM. Discussion of full validation against a T2DM clinical population is beyond the scope of this article.
Metabolic Characteristics of the T2DM In Silico Population.
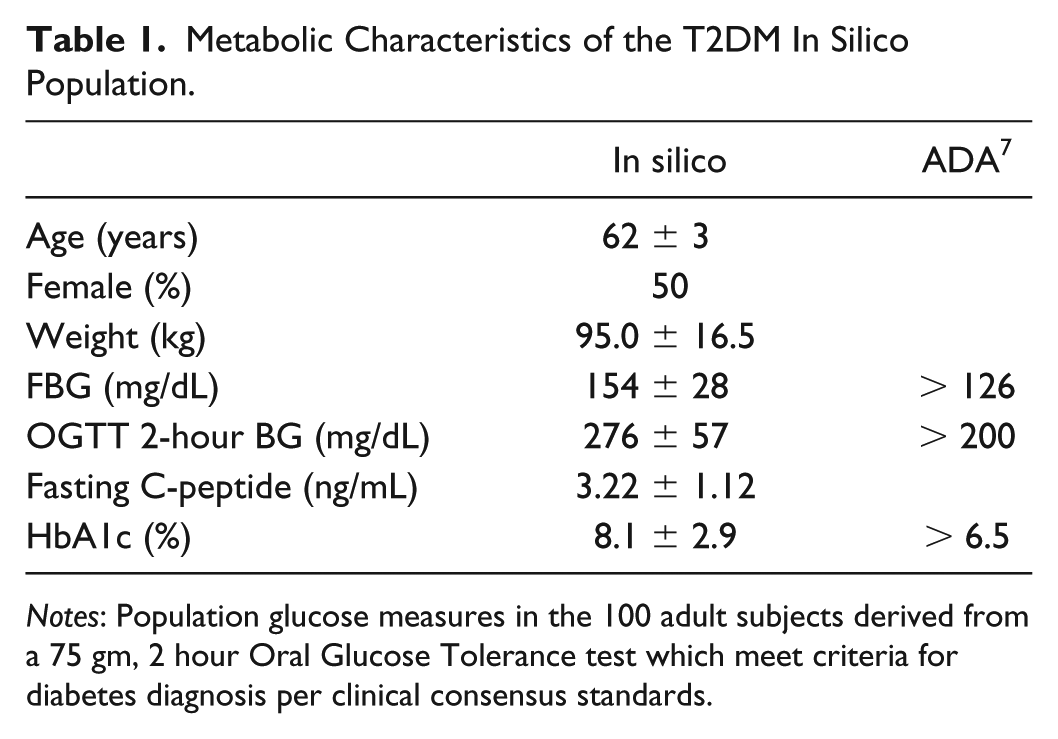
Notes: Population glucose measures in the 100 adult subjects derived from a 75 gm, 2 hour Oral Glucose Tolerance test which meet criteria for diabetes diagnosis per clinical consensus standards.
Exogenous insulin through subcutaneous injection as a supplement to endogenous insulin secretion was modeled as with the T1DM population with an additive compartment which would operate within the Dalla Man metabolic model.
Glargine Insulin PK Model
To model the pharmacokinetic/pharmacodynamic (PK/PD) characteristics of the LA insulins, we used clinical data from 2 PK/PD studies of T1DM subjects treated with Gla-100 and Gla-300 in controlled experimental conditions (studies PKD11627 and TDR11626, provided by Sanofi). The models relied on the understanding that both of these insulins have PK/PD characteristics identical to those of normal human insulin once they have reached the plasma compartment defined by the Dalla Man metabolic model. 23 Therefore, the Gla-100- and Gla-300-specific models only involved the PK characteristics from the time of subcutaneous injection to distribution into the plasma.
We represented all subcutaneous kinetics by creating a single subcutaneous compartment whose insulin mass increases instantaneously by the full amount of a dose and whose flux into the plasma is defined by an “insulin release rate profile.” This profile was established by combining plasma concentrations from the clinical data collected from 2 clinical trials: one examining Gla-100 and Gla-300 doses given each day for several days, providing sparse, long-term, 8-day data, and another examining response to a single dose providing denser short-term data spanning 36 hours. The “insulin release rate profile” was defined by a time series of rate values, each representing the fraction of a bolus that will enter the plasma, per unit time, at any given time elapsed after the subcutaneous bolus injection. As our subcutaneous model delivers the insulin to the plasma compartment, the remaining PK/PD characteristics are entirely addressed by the Dalla Man model. The resulting concentration curves produced by our model for Gla-100 and Gla-300 correlate well with the data provided by Sanofi, as shown in Figure 1.
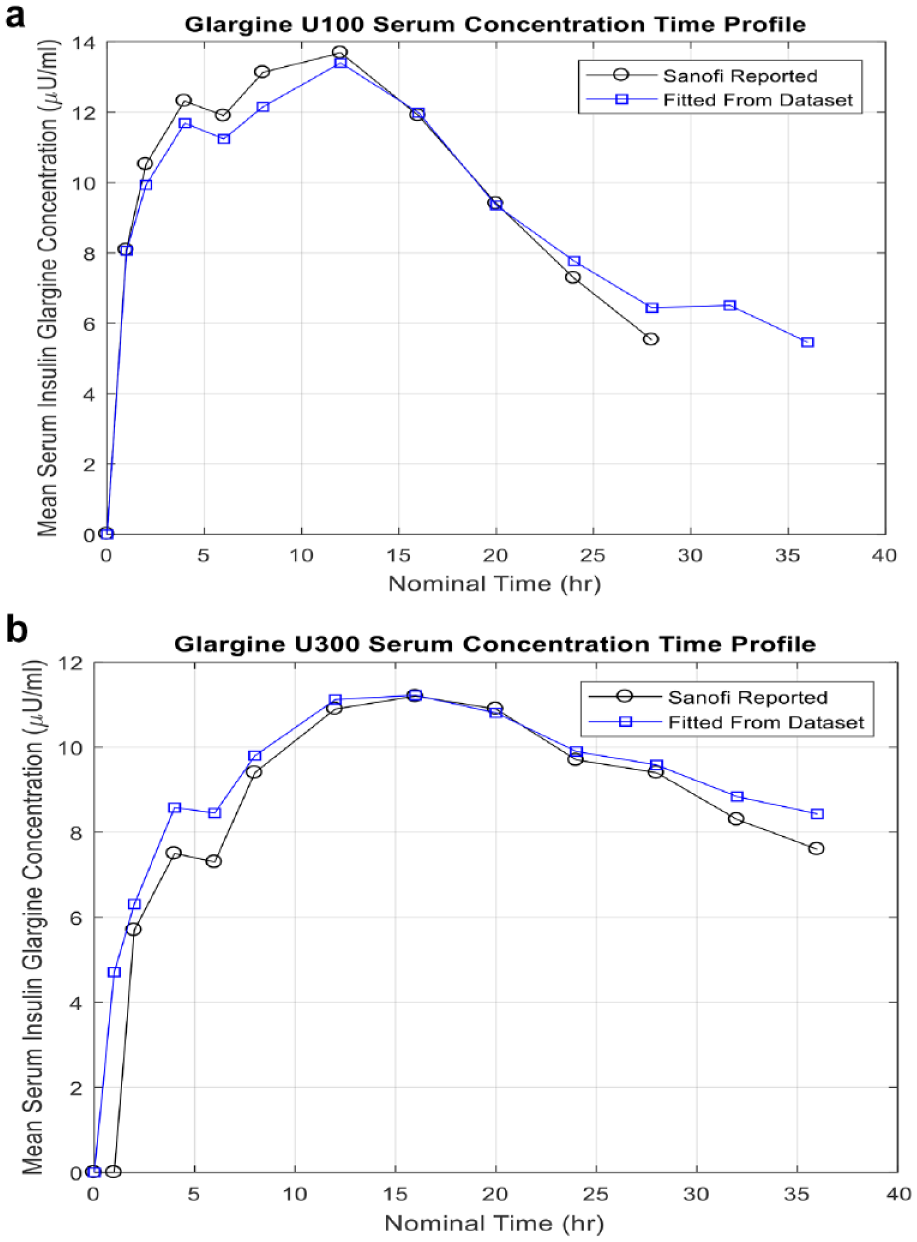
Glargine model.
Exercise Model in T2DM
Exercise is an important lifestyle factor that impacts glucose control for patients with T2DM. The in silico exercise model currently available in diabetes simulators represents exercise in T1DM people only, and does not account for the insulin resistance present in people with T2DM. This model would need to effect BG levels over the ensuing 24 hours postexercise to simulate impact on fasting glucose levels. For these titration studies, we modeled intermittent HI postprandial exercise performed after the evening meal. Such exercise would create several opportunities to affect the titration process, due to a short-term increase in glucose utilization (GU) lasting a few hours and a delayed, longer-lasting decrease in endogenous glucose production (EGP). The former effect could increase chances of hypoglycemia at night, while the latter could reduce the FBG measurements on the morning after exercise.
We used GU, BG, and plasma insulin concentration data from a study reported by Larsen et al
24
to establish variation of insulin-independent GU during exercise and insulin-dependent GU for about 3 hours after exercise, as represented in the
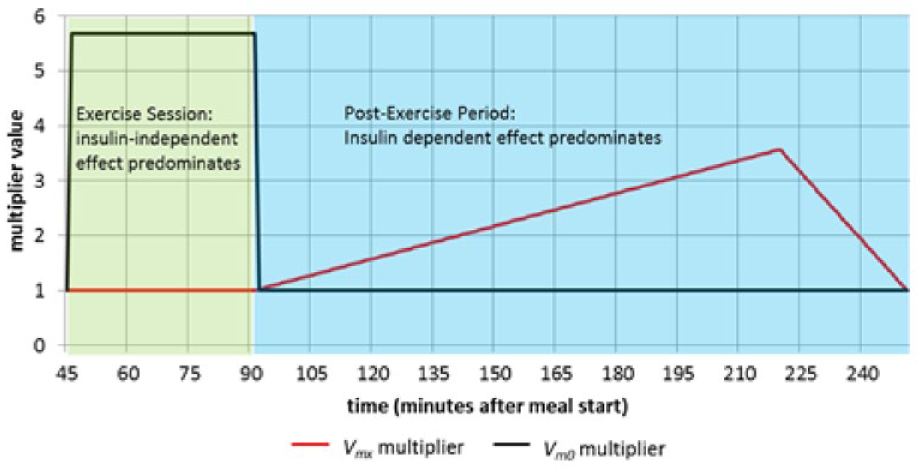
Exercise model for T2DM population.
Our model of altered EGP is derived from data found in studies by Devlin et al,
25
Marliss and Vranic,
26
and Giacca et al.
27
It is designed to match the reduction in basal EGP rate and FBG
25
on the morning following evening exercise and to result in a cumulative reduction (over the span from 200 minutes until 1200 minutes after exercise completion) corresponding to the excess EGP experienced during the exercise.26,27 The model was implemented by varying the
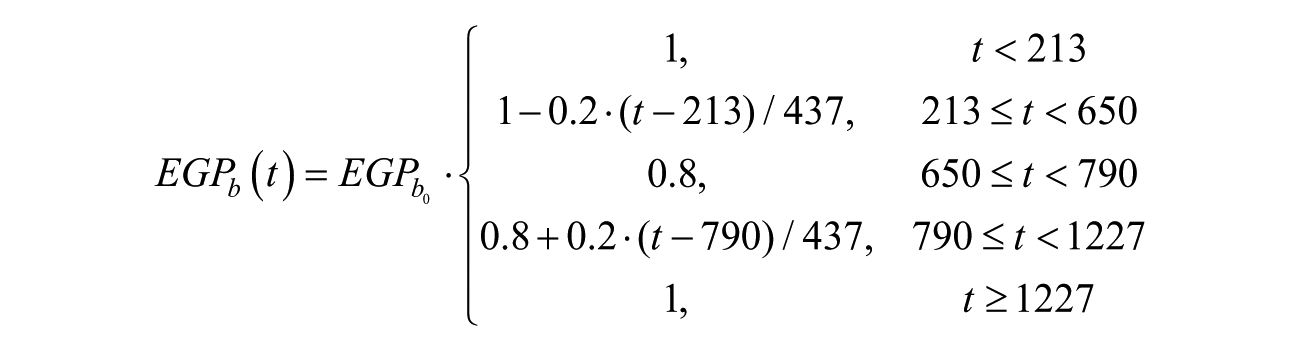
where
Overeating
Overeating was simply an excessive amount of carbohydrates ingested using the model as implemented. 28 Large meals (carbohydrate count of 75 g for all meals) for 2 consecutive dates were given to simulate excessive eating.
Illness Model
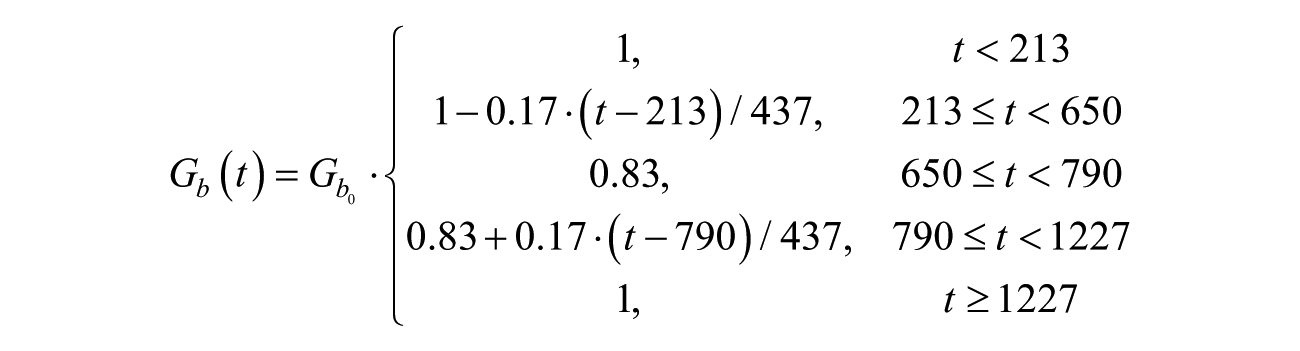
Illness was modeled to induce hyperglycemia as seen in hypermetabolic states of noncritical illness. 29 We achieved this by adjusting the subjects’ metabolic parameters associated with EGP, tuning them to produce the magnitude reflecting a severity with the largest possible effect on the titration rules, while representing a short-term, noncritical illness. To satisfy this goal, we targeted a 70 mg/dL increase in the FBG for all subjects, increasing the parameter kp1, as defined in the Dalla Man metabolic model. 23 . The required multiplication factor for kp1 was found independently and empirically for each subject, via a fasting simulation in which kp1 was dynamically varied. The onset of illness was represented by changing kp1 linearly from its nominal value to the value representative of illness over a 1-hour time span. This parameter remained at this level until the end of the illness period (with different possible durations, as specified for the particular “life event” being simulated), at which point kp1 was returned, linearly, over a 4-hour period, to its nominal value.
Interday variability in glucose related to internal and external physiological factors were not included in these simulations. The day-to-day variation beyond a single day was simulated by 3 months of sequential single-day scenarios to achieve the full 90-day study duration. The variability introduced to perturb the TA recommendations was introduced at specified time points and isolated to a few days to clearly demonstrate and maximize the opportunity for the TA to respond to resulting hyperglycemia or some low morning glucose values.
Treatment Algorithms and Rules Engine
The TAs and the rules engine were programmed to calculate the dose of LA insulin glargine U100 and U300, respectively, based on the dose given the day before, the FBG, and information on hypoglycemic events since the last injection, if any. In LTHome, the patient has to enter this information on the starting page of the website. In MyStar DoseCoach, FBG and hypoglycemic BG values measured by the device are used automatically. There are 3 different TAs (refer Table 2) which have to be selected by the prescribing physician based on the respective patient. The intended use is for patients with T2D on basal insulin with oral antidiabetic agents and/or GLP1 agonists, but not with bolus insulin. The TAs will give daily dose suggestions.
Titration Rules and Results of Treatment With Gla-100 and Gla-300.
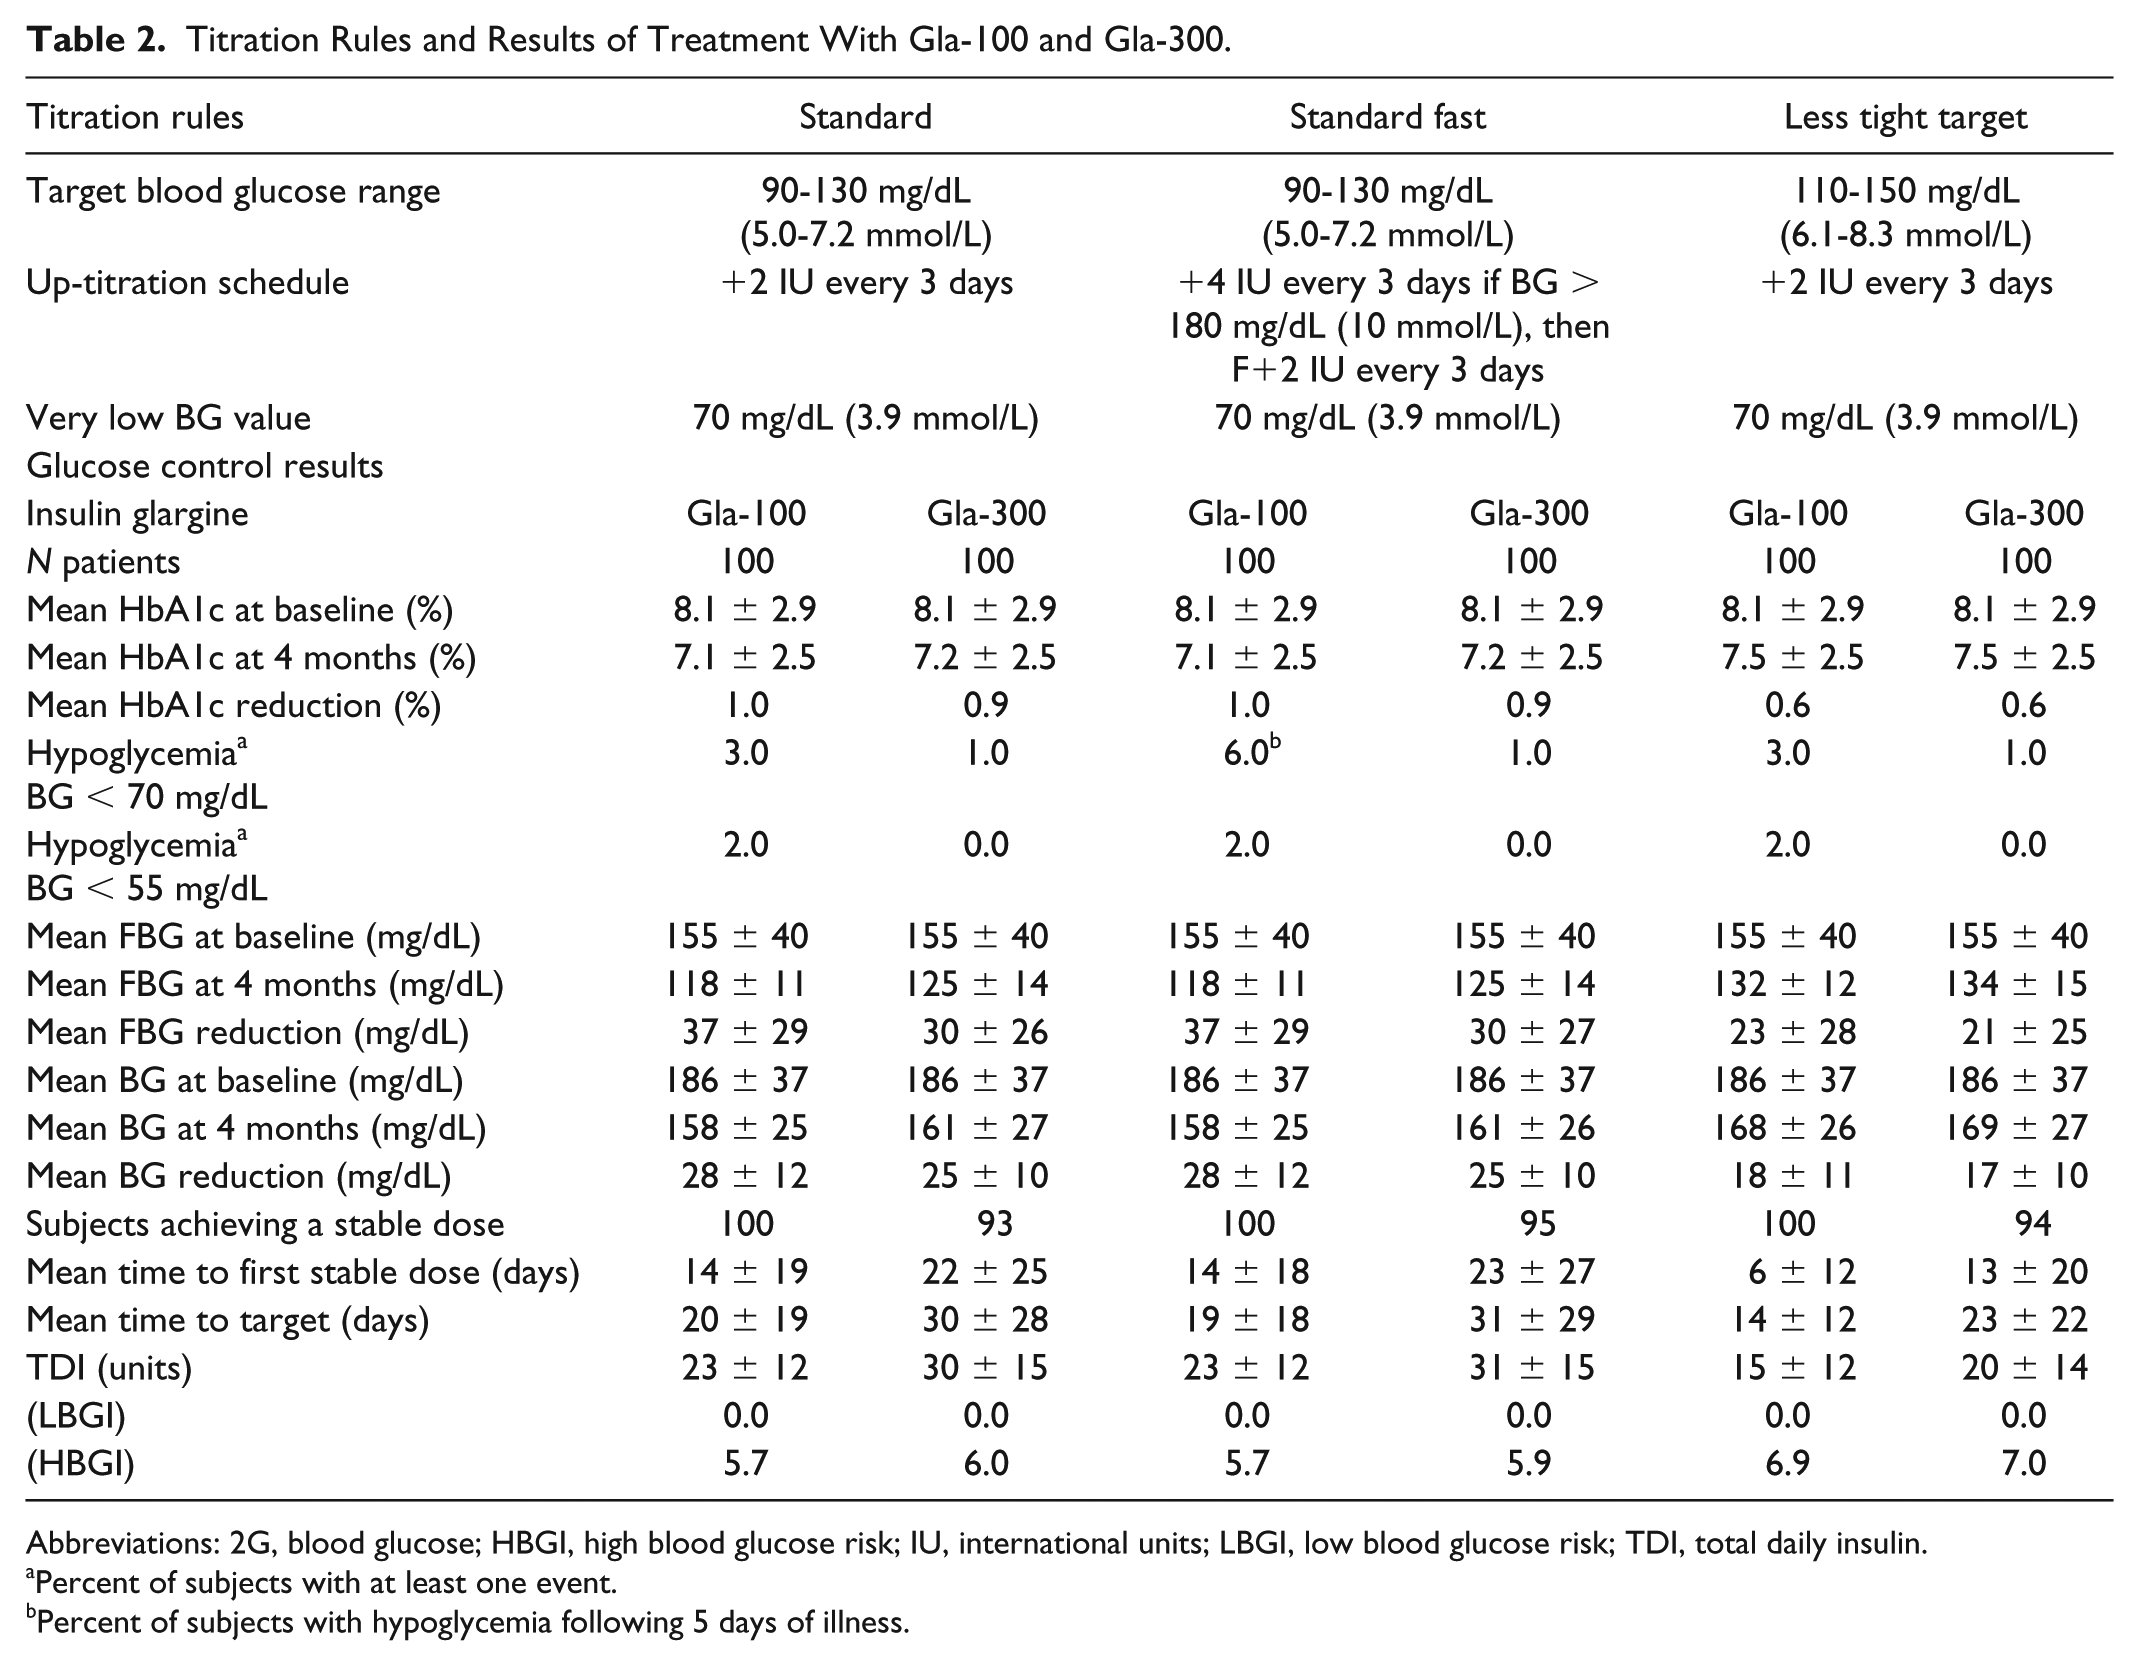
Abbreviations: 2G, blood glucose; HBGI, high blood glucose risk; IU, international units; LBGI, low blood glucose risk; TDI, total daily insulin.
Percent of subjects with at least one event.
Percent of subjects with hypoglycemia following 5 days of illness.
Simulation Study Design
This in silico head-to-head parallel comparison study was performed to evaluate the effectiveness of LTHome in recommending insulin glargine dosing to improve daily FBG and achieve glucose control within a designated target range. We examined 100 virtual adult subjects with T2DM with individualized glucose-insulin responses to initiate and optimize insulin Gla-100 and Gla-300 using 3 TAs. All subjects were studied under each of the TAs provided in Table 2. Through the DMMS, the subjects’ daily FBG values were sent via web service calls to the LTHome website. While monitoring daily for safety aspects based on the built-in rules engine, the LA insulin dose was calculated based on the reported FBG, previous insulin dose, and self-reported hypoglycemic events. This calculated dose was then recommended to the subject in the DMMS for the Gla-100 or Gla-300 dose adjustment to be made the evening of the same day. The study duration was 4 months, starting with a 7-day insulin initiation period (0.2 U/kg body weight) to reach a stable plasma insulin concentration, followed by dose titration to a designated BG target range. Glucose control based on FBG for the subjects was observed during insulin initiation (days 0-6), dose stabilization (days 7-10), and titration to target (days 11-119). BG values were captured for 24 hours during days with regular meals and also during and after the occurrence of simulated life events (days 61-65) such as exercise, overeating, and illness models derived from clinical study data.24-26 Bolus insulin was not delivered during the simulations.
Primary endpoints included HbA1ccalc 30 at 4 months, number of subjects experiencing hypoglycemia (BG < 70 mg/dL) and severe hypoglycemia (≤ 55 mg/dL) events, number of subjects who reached target range, and mean percent of time-in-target (90-130 and 110-150 mg/dL). Secondary endpoints included change in mean FBG, change in mean BG, percent time above target range, total daily basal insulin dose (TDI), and risk indices (high BG risk index [HGBI], low BG risk index [LBGI]) 31 with control variability graph analysis (CVGA). 32
The primary and secondary endpoints for the T2DM population were analyzed by descriptive statistics: number and percent of subjects included in the analyses, mean ± standard deviation with minimum and maximum glucose control values. Endpoints were examined for each TA and comparisons were made between the Gla-100 and Gla-300 treatment results. Additionally, all causes for dosage adjustment, particularly during the exercise, heavy meals, and illness events, were examined.
Results
All 100 in silico subjects were included in the simulations (50% men, age 62 ± 3 years, HbA1ccalc 8.1% ± 2.9%, body weight 94 ± 16 kg). The vast majority of subjects reached stable doses in the target ranges under all TAs with both Gla-100 and Gla-300 insulin; all 100 subjects achieved the designated target FBG range during the 3-month simulation for all TAs using Gla-100; however, 7 subjects were still approaching target range using Gla-300 (Figure 3). Glucose control metrics comparing the 3 TAs are presented in Table 2. Time-in-target BG increased from 11.2% (TA1, TA2) and 24.1% (TA3) at the initiation of the insulin to 34.2% and 41.1%, respectively, using Gla-100, while time-in-target increased similarly to 31.1% and 41.2% with Gla-300. Time-above-target decreased from 88.8% and 74.6% at baseline to 65.8% and 56.1% with Gla-100 and 68.8% and 57.0% with Gla-300. Calculated HbA1c improved from 8.1% ± 2.9% to 7.1% ± 2.5% for TA1 and TA2 and 7.5% ± 2.5% for TA3 with Gla-100 treatment and 7.2% ± 2.5% for TA1 and TA2 and 7.5% ± 2.5% for TA3 with Gla-300 treatment. This produced a comparable reduction in HbA1c for both basal insulins of 1%. Mean FBG was lowered from 155 ± 40 to 118 ± 11 mg/dL under TA1 and TA2 and 132 ± 12 mg/dL under TA3 using Gla-100 and lowered to 125 ± 14 mg/dL with TA1 and TA2 and 134 ± 15 mg/dL with TA3 using Gla-300.
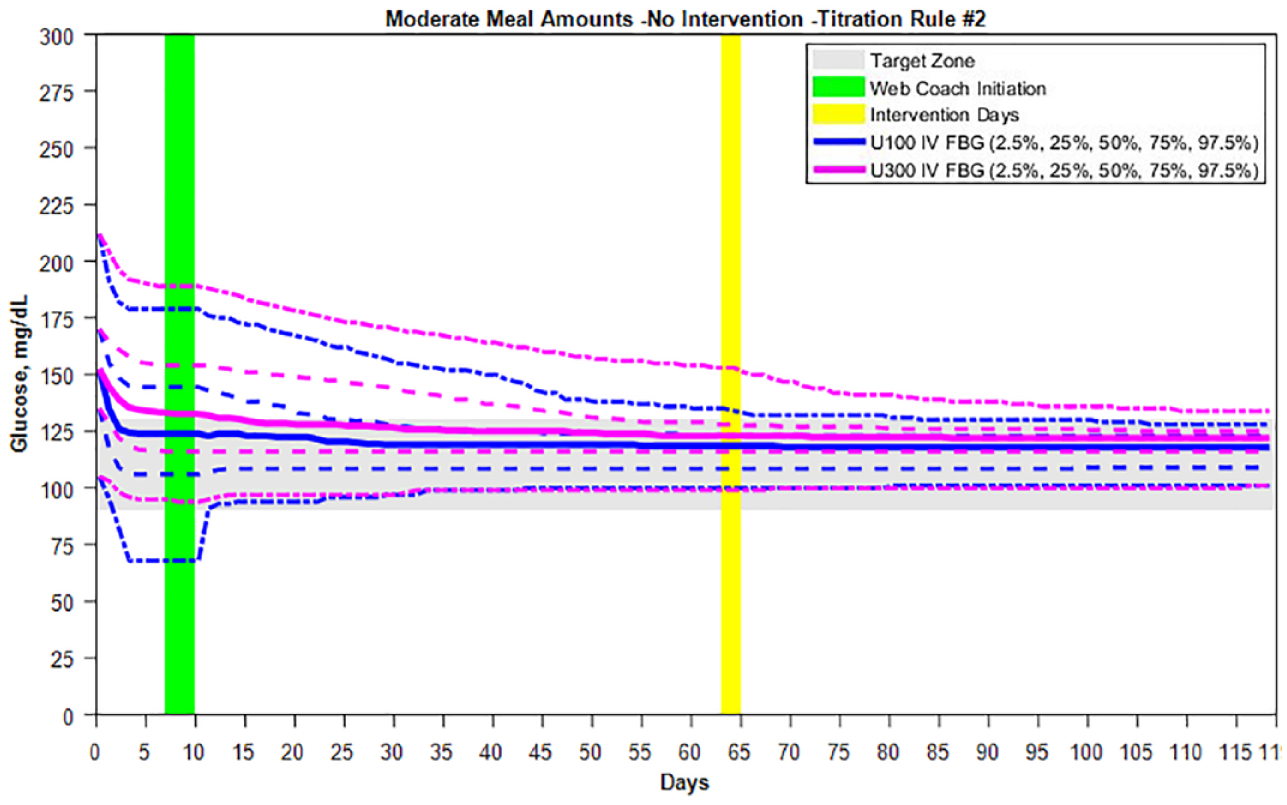
Comparison of Gla-100 and Gla-300 titration to target over 4 months with dosing recommended by the LTHome using Titration Rule #2. Initial dosing with Gla-U100 at 0.2 U/kg body weight caused hypoglycemia in some subjects, while this did not occur with the Gla-U300 insulin.
Severe hypoglycemia (BG ≤55 mg/dL) occurred in 2 subjects during initial dosing of the insulin Gla-100, and no subject on initial dosing with Gla-300, while an additional subject experienced hypoglycemia <70 mg/dL during initial dosing in both the Gla-100 and Gla-300 groups. There was no hypoglycemia during the standard titration-to-target period when there was no exercise, illness, or large meals. The introduction of exercise alone failed to cause hypoglycemia; however, exercise that followed a week of illness caused 2 subjects to experience severe hypoglycemia ≤55 mg/dL and 8 subjects with BG <70 mg/dL when using Gla-100. During this illness/exercise scenario, no subject experienced severe hypoglycemia while 4 subjects had BG < 70 mg/dL when using Gla-300 (data not shown). The hypoglycemia events primarily occurred at night (10:00
Mean TDI was 23 ± 12 units for TA1 and TA2 and 15 ± 12 units for TA3 for Gla-100. Gla-300 dosing was higher at 30 ± 15 units with TA1, 31 ± 15 units with TA2, and 20 ± 14 units with TA3. Dose adjustments were primarily due to up-titration to lower FBG to the target ranges for both insulins; however, the exercise following illness events resulted in TA dose reduction for 3 subjects (Figure 4). Illness and overeating resulted in minimal direct dose increase as the LTHome maintained the BG in target or was still bringing the BG into the target range at the time of the events (Figure 5). Overall, BG levels were improved to a zone of “Good Control” (Zones A+B 84% on day 10 at the start of titration to target increased to 96% after reaching target) as shown in the CVGA grid (Figure 6).
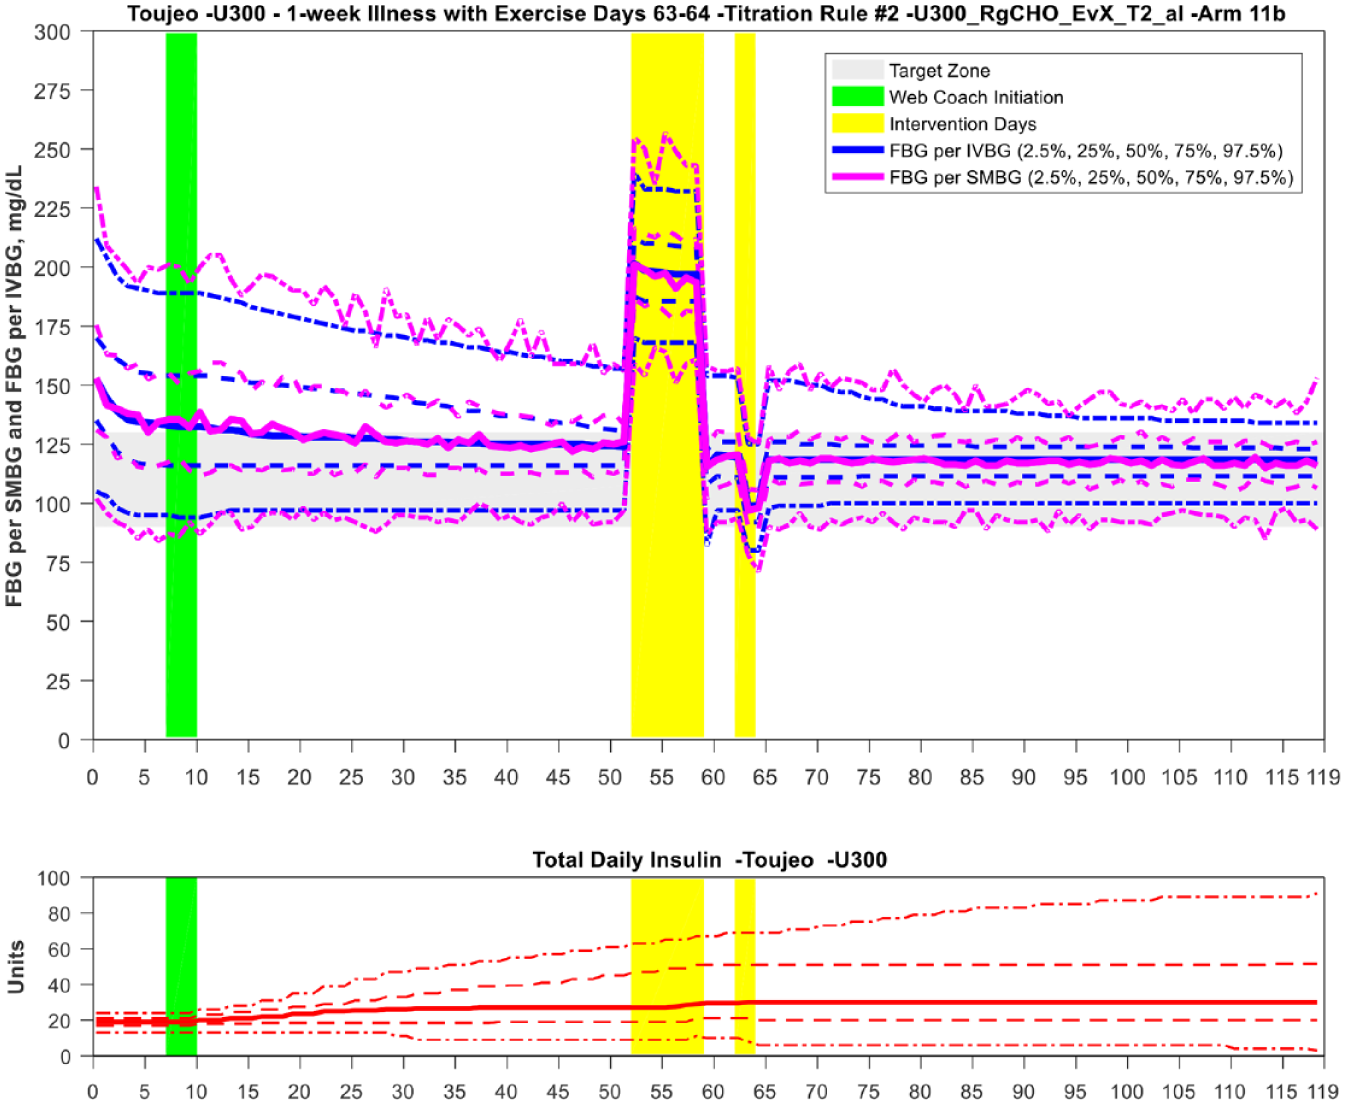
The evening exercise intervention over 2 days following 5 days of illness impacted the FBG the following mornings as shown. The dose was adjusted downward in those subjects within the lower end of the BG target zone. See ↑ at day 65.
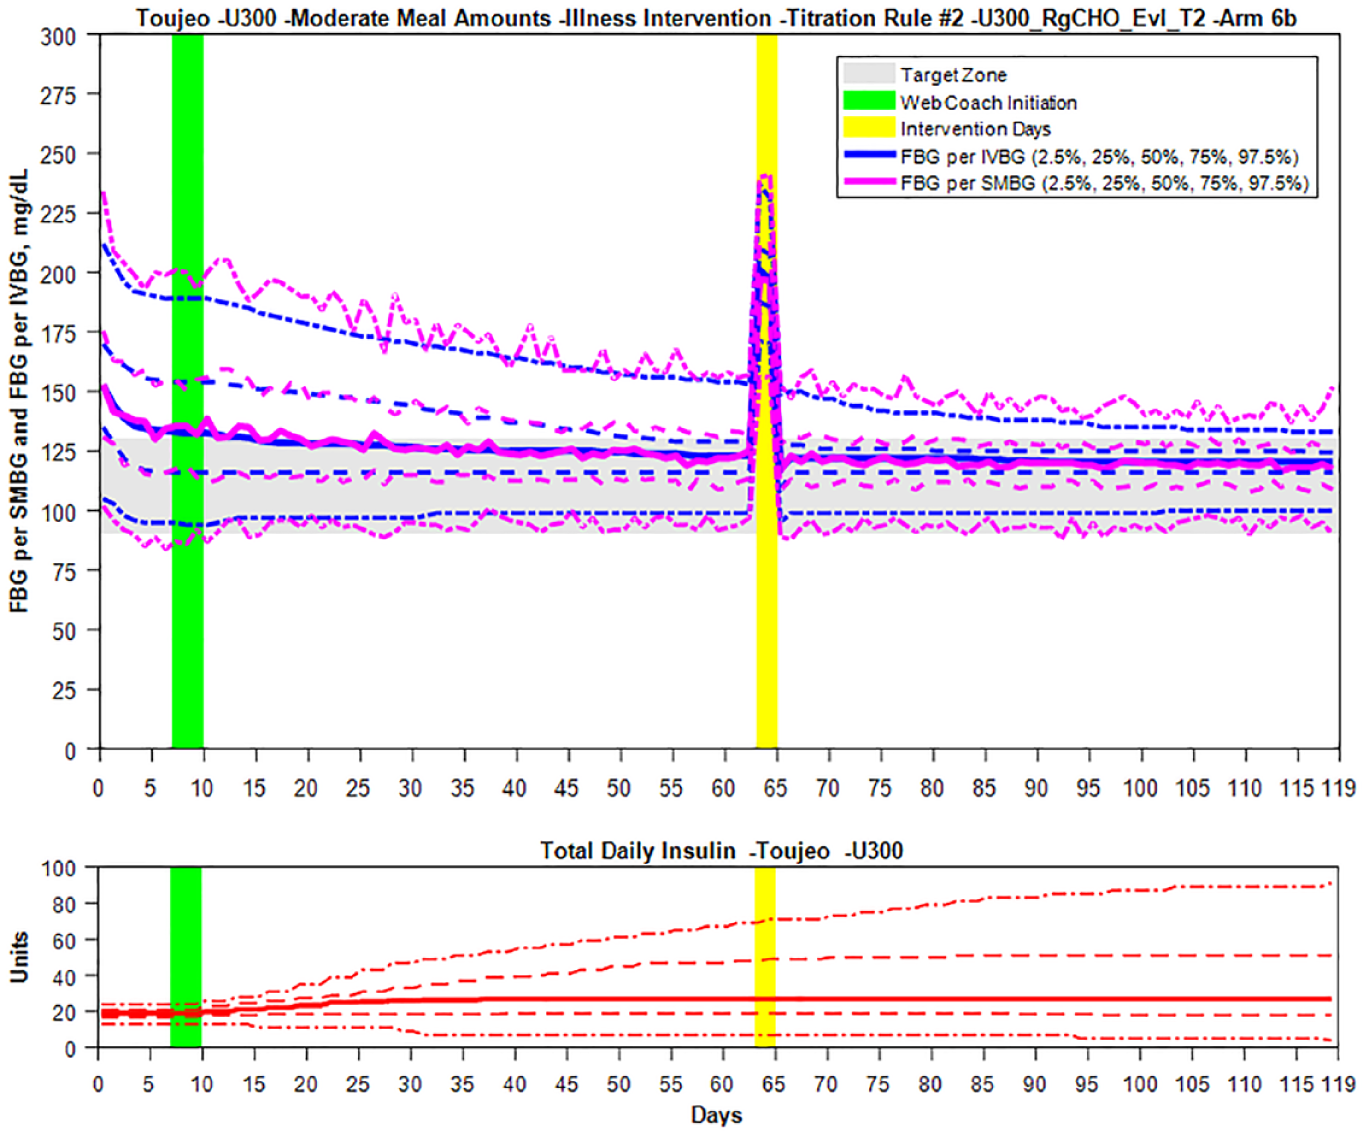
Insulin dosing during illness was minimally impacted, and the WebCoach Gla-300 dose recommendations continued to bring the FBG levels into the target range.
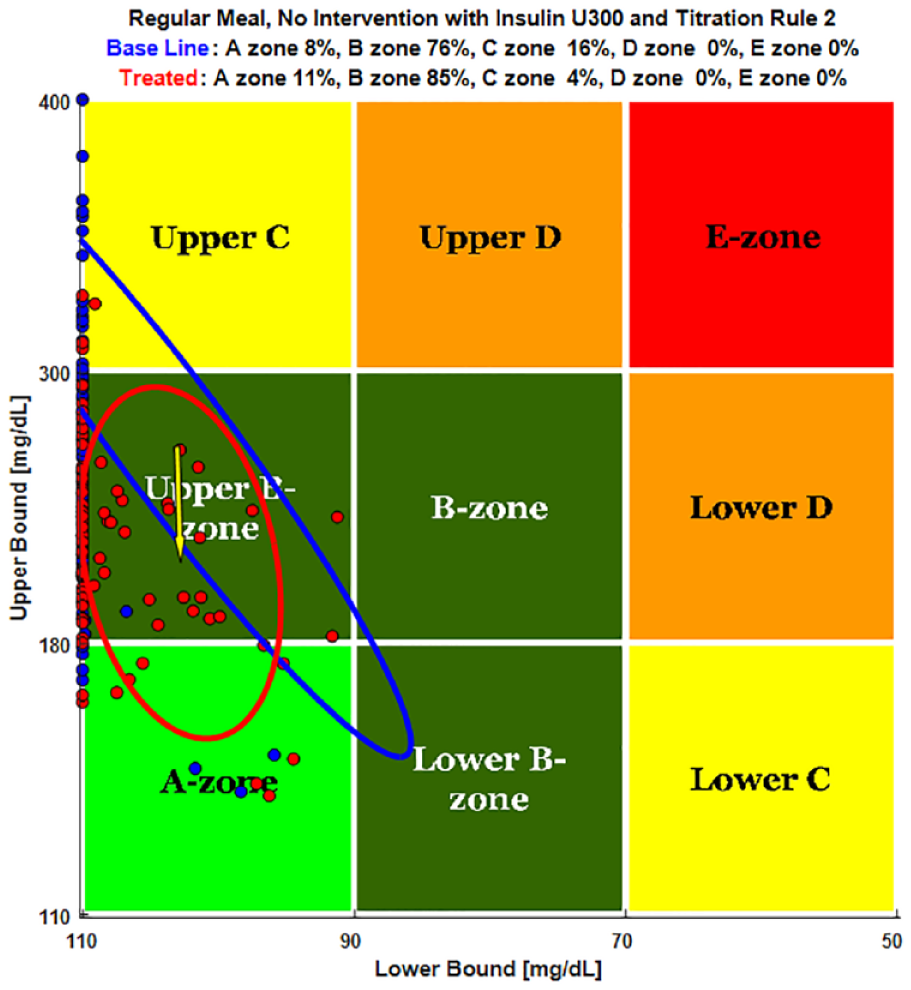
The CVGA grids show the intercept of low and high BG for each subject over the simulation period.
Discussion
LA insulin provides an opportunity to improve glucose control for people with T2DM who are reaching maximum doses and not sufficiently controlled on oral antidiabetic agents. It becomes a necessity for those who have greatly reduced endogenous insulin levels as their disease progresses, but also for those with moderate to severe insulin resistance. Studies have shown that patients can safely and effectively titrate their own basal insulin using patient-driven approaches if given adequate instruction and supervision by a knowledgeable healthcare provider.16,19,33-35 Adding insulin to improve glucose control under various combinations of oral therapies is a challenging paradigm for individualized pharmacologic management2,7 and may fail to adjust to the complexity of daily lifestyle irregularities that impact glucose variability. In this in silico study, 3 TAs and the rules engine were used to guide subjects safely and effectively through an insulin glargine (Gla-100 and Gla-300) up-titration period until a stable dose was reached within a designated target range. We directly compared the dose-response to Gla-100 and Gla-300 titration decisions in virtual subjects with various levels of endogenous insulin and insulin resistance. These simulations demonstrated findings similar to human studies examining the titration rules: Glucose control was achieved in the majority of subjects with minimal hypoglycemia.16,18-22 In the virtual environment, subjects can undergo the identical conditions in parallel, including extreme events that would be dangerous in a human study. 23 Initial weight-based dosing (0.2 U/kg) of Gla-100 and Gla-300 in the virtual T2DM population resulted in hypoglycemia for a few subjects. In reality, these subjects would likely not be considered to be candidates for insulin therapy. However, it should be noted that both hypoglycemia and severe hypoglycemia experience were consistently less with Gla-300 in the population under the same weight-based dosing and lifestyle protocols. Also, specific to this simulation study, rigorous exercise to force hypoglycemia, and illness and overeating to cause extreme and prolonged hyperglycemia were imposed on the TAs to examine dose-response adjustments and stability after subjects had reached the target ranges. We found that dose adjustments during these extreme events were minimal, limiting insulin-related hypoglycemia, and glucose variability.
Finally, while Gla-300 required longer time to reach target than the Gla-100, the majority (≥93%) of subjects reached a stable dose (defined as the same dose applied for at least 10 consecutive days) within 3 weeks of starting the insulin, and their specified target zone within 30 days after stable dosing. Subjects remained in target zone for the remainder of the simulation period (mean 40 days).
Limitations of this study include the low hypoglycemia rate and short simulation duration that would have tested the LTHome more extensively. Additionally, while most subjects improved in their glucose control over the 4-month simulation, they remained in the high- and low-boundary regions of the target zones, and some subjects did not reach target. This is predominantly related to the TA’s ability to lower BG in a controlled and safe manner, with minimal hypoglycemia risk. Finally, as most people with T2DM take a variety of oral antidiabetic medications, these subjects received only insulin. Further simulations could examine initiation of LA insulin glargine and dose titration to target in the presence of polypharmacy. Prolonging exercise and illness could force more extreme and prolonged hyper and hypoglycemia which would potentially require downward dose adjustment or discontinuation as a test of the titration rules and a better understanding of the difference in Gla-100 and Gla-300 or other LA insulins under these conditions. Finally, these subjects neither have the usual interday physiological variability in insulin sensitivity, nor have the additional comorbid medical conditions that contribute to glucose metabolic disarray. Despite these limitations, simulations are informative and allow experimentation of difficult clinical situations experienced by people with T2DM.
Conclusions
These simulations inform real-life T2DM glucose management with LA insulin in the quest to better define the art of diabetes care and the path toward optimal, individualized glycemic control for people with T2DM. The results are similar to those reported in human studies, which demonstrate that the rules engine and TA developed and implemented into LTHome and MyStar DoseCoach provide safe and efficacious dose guidance for titration and maintenance of LA daily basal insulin, even in situations of overeating, exercise, and illness with first-generation as well as second-generation basal insulin.
Footnotes
Declaration of Conflicting Interests
The author(s) declared the following potential conflicts of interest with respect to the research, authorship, and/or publication of this article: Jochen Sieber and Frank Flacke were full-time employees of Sanofi at the time the work was conducted. Mark Weinheimer, Gail Kongable, Susan Riddle, and Yung-Yeh Chang are full-time employees of the Epsilon Group, Abbott.
Funding
The author(s) disclosed receipt of the following financial support for the research, authorship, and/or publication of this article: This work was funded by Sanofi.