
Abstract
Background:
Point-of-care (POC) hemoglobin A1c (HbA1c) testing has advantages over laboratory testing, but some questions have remained regarding the accuracy and precision of these methods. The accuracy and the precision of the POC Afinion™ HbA1c Dx test were investigated.
Methods:
Samples spanning the assay range were collected from prospectively enrolled subjects at three clinical sites. The accuracy of the POC test using fingerstick and venous whole blood samples was estimated via correlation and bias with respect to values obtained by an NGSP secondary reference laboratory (SRL). The precision of the POC test using fingerstick samples was estimated from duplicate results by calculating the coefficient of variation (CV) and standard deviation (SD), and separated into its components using analysis of variance (ANOVA). The precision of the POC test using venous blood was evaluated from samples run in four replicates on each of three test cartridge lots, twice per day for 10 consecutive days. The SD and CV by study site and overall were calculated.
Results:
Across the assay range, POC test results from fingerstick and venous whole blood samples were highly correlated with results from the NGSP SRL (r = .99). The mean bias was −0.021% HbA1c (−0.346% relative) using fingerstick samples and −0.005% HbA1c (−0.093% relative) using venous samples. Imprecision ranged from 0.62% to 1.93% CV for fingerstick samples and 1.11% to 1.69% CV for venous samples.
Conclusions:
The results indicate that the POC test evaluated here is accurate and precise using both fingerstick and venous whole blood.
Recent estimates reveal that diabetes affects nearly 425 million people globally and approximately 30.3 million in the United States.1,2 The global burden of this disease is projected to grow to 629 million by the year 2045, and a lack of access to resources and screening in underserved or rural communities already contributes to a significant undiagnosed population.1,3 HbA1c is recommended for use in diagnosing diabetes by the American Diabetes Association (ADA), 3 and there are several laboratory methods that have been cleared by the US Food and Drug Administration (FDA) for this purpose. 4 Testing HbA1c at the POC has the potential to decrease the fraction of undiagnosed diabetes because it can provide patient results within minutes and is well suited for areas where medical laboratories may not be accessible.5-7 However, the variable performance8-10 of some previous POC devices in combination with a lack of mandatory proficiency testing in some POC settings, has led the ADA to withhold its endorsement of POC HbA1c methods for use in the diagnosis of diabetes. 3
The National Academy of Clinical Biochemistry (NACB) recommends that HbA1c assays used for diagnosis should achieve an imprecision of <3% CV and should be NGSP certified. 11 Currently the NGSP requires 92.5% of results to be within ±6% of a reference method traceable to the Diabetes Control and Complications Trial (DCCT). 12 Recently the Afinion™ HbA1c Dx test (“POC test”) became the first POC method to obtain US FDA clearance for use as an aid in the diagnosis of diabetes and in the identification of people at risk of developing diabetes. Prior to this clearance this investigation was initiated to assess the accuracy and precision of this POC test with laboratory professionals trained per product labeling as the test operators.
Methods
Two prospective, observational studies were conducted to assess the performance of the POC test with respect to accuracy and precision. Both studies were performed at the same three diabetes/endocrinology research centers, using the same three lots of test cartridges, Afinion AS100 Analyzers, and test operators who were trained per product labeling in the use of the POC test. Study protocols were reviewed and approved by a central Institutional Review Board (IRB), and all subjects completed an IRB-approved, written informed consent form prior to their participation. These studies included patients aged 18 years or older and excluded those known to have the hemoglobin HbF >7% and those taking glucocorticoids or nicotinic acid medications. Current practice guidelines recommend that HbA1c should not be used in patients with conditions associated with increased red blood cell turnover, 3 so the study also excluded those with hemophilia, thalassemias, hereditary spherocytosis, chronic hepatic or renal disease, iron deficiency or hemolytic anemia, those who were pregnant, or those who had been transfused or received chemotherapy within the previous 3 weeks. The study designed to assess accuracy also excluded individuals known to have the hemoglobin variant HbE, which is a hemoglobin variant known to cause interference with the reference method (the Tosoh G8 HbA1c method) at the time of protocol development.
The POC test (manufactured by Alere Technologies AS, Oslo, Norway; a subsidiary of Abbott Laboratories) is a fully automated boronate affinity assay for the determination of the percentage of HbA1c in human whole blood. The test cartridge contains all of the reagents and calibration information necessary for the determination of %HbA1c. A patient specimen is collected with the integrated sampling device then reinserted back into the test cartridge. The test cartridge is then placed in the cartridge chamber of the analyzer and the sample is automatically diluted and mixed with a solution that releases hemoglobin (Hb) from the erythrocytes. After the Hb is precipitated, the sample mixture is transferred to a blue boronic acid conjugate which binds to the cis-diols of glycated Hb. This reaction mixture is soaked through a filter membrane and all precipitated Hb, conjugate-bound and unbound (ie, glycated and nonglycated Hb) remains on the membrane. Excess conjugate is removed with a washing reagent. The analyzer measures the reflectance of the precipitate on the membrane as blue (glycated Hb) and red (total Hb) color intensities. The percentage of total glycated hemoglobin and %HbA1c has been shown to be well correlated; 13 calibration adjusts the measured total glycated hemoglobin to report the equivalent level of HbA1c. This POC test is traceable to the International Federation of Clinical Chemistry and Laboratory Medicine (IFCC) reference method for measurement of HbA1c, 14 and is certified by the NGSP as having documented traceability to the DCCT reference method. The NGSP awards certification to manufacturers for successfully meeting specific performance criteria. 15 HbA1c measured using the Tosoh glycohemoglobin test on the G8 HPLC Analyzer at the NGSP SRL at the Diabetes Diagnosis Laboratory, University of Missouri School of Medicine was used as the HbA1c reference method. This SRL method is traceable to the DCCT method and to the IFCC reference methods (mass spectroscopy and capillary electrophoresis).16-18
In order to evaluate accuracy over the measurement range of the POC test, HbA1c values distributed across the assay range were targeted as shown in Table 1, which also emphasizes clinically relevant HbA1c intervals. The number of samples was set at 120 per FDA special controls for HbA1c test systems. 19
Target Distribution of Samples.
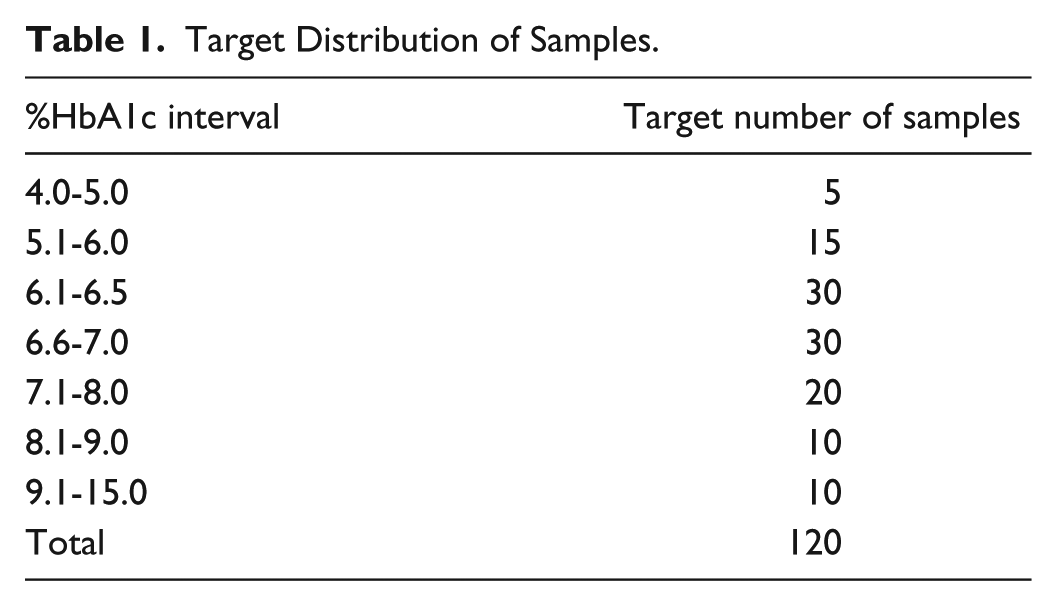
Once the target enrollment within a subgroup was achieved, each site focused on enrolling subjects into unfilled subgroups. The first 120 subjects to fill the predetermined distribution (Table 1) were analyzed for accuracy, and all evaluable duplicate fingerstick results were analyzed for precision. Two of the three test cartridge lots were provided to each study site. Upon enrollment, one fingerstick sample was collected from each subject and tested with one of the two cartridge lots at the site. A second fingerstick sample was then collected and tested with the other cartridge lot. The precision of these duplicate fingerstick sample results was calculated. Samples were grouped by %HbA1c based on the average of the duplicate test results into the following levels: low (4.00%-5.99% HbA1c, or 20.2-42.0 mmol/mol HbA1c), threshold (6.00%-6.99% HbA1c, or 42.1-52.9 mmol/mol HbA1c), medium (7.00%-9.99% HbA1c, or 53.0-85.7 mmol/mol HbA1c), and high (≥10% HbA1c, or 85.8 mmol/mol HbA1c). The standard deviation (SD) was calculated for each sample pair. The coefficient of variation (CV) was estimated for each HbA1c level by taking the root mean square (RMS) of the pairwise SD within each level and dividing it by the mean of each level. 20 Within-subject precision was separated into repeatability (within-run) and between-lot components of variance using a two-factor ANOVA model without nesting based on Type II sum of squares (MATLAB ANOVAN and SAS PROC MIXED).
A venous whole blood sample was also collected from each subject and tested on each of the test cartridge lots. To balance the number of tests performed with each lot, the order of the first cartridge lot used for testing was alternated between subjects. For the 120 subjects fulfilling the predetermined distribution (Table 1), an aliquot of the venous whole blood sample was sent to the NGSP SRL for duplicate testing on the Tosoh G8 HbA1c method.
The first-replicate results from the POC test (fingerstick and venous whole blood samples) were compared against the average of duplicate results from the same venous sample on the NGSP SRL reference. The Passing-Bablok slopes and intercepts were calculated and used to estimate the bias at 5.0%, 6.5%, 8.0%, and 12% HbA1c. The mean bias to the NGSP SRL was calculated across the measurement range by using Bland-Altman analysis. Both the absolute difference (in %HbA1c units) and the relative difference (as a percentage) were determined. The number of POC results that fell within ±6% of the NGSP SRL reference results was calculated.
The precision of the POC test using venous whole blood was assessed by testing fresh samples collected from subjects having HbA1c values within one of the four %HbA1c levels previously defined (low, threshold, medium, and high). Each site assessed one subject at each of the four %HbA1c levels for a total target enrollment of 12 subjects (3 subject samples per level). These subjects were enrolled July-August 2015.
Due to expected fresh sample hemolysis over time, the 20-day study design recommended in CLSI Guideline EP05-A3 20 was adapted to a 10-day design. A venous whole blood sample was drawn from each subject. Four replicates were tested on each of the three test cartridge lots, two times per day for 10 consecutive days resulting in 240 measurements per site. The testing was conducted at 3 sites resulting in a total 720 measurements for each HbA1c level.
For each HbA1c level (low, threshold, medium, and high) at each site, the repeatability (within-run), between-run, between-day, between-lot, and within-site SD and CV were calculated. 20 The RMS of the within-site SD and CV for each HbA1c level was calculated. The components of variance were estimated using SAS PROC VARCOMP.
Results
Accuracy and Fingerstick Precision
Specimens were collected from a total of 177 subjects in order to achieve the predetermined target distribution of HbA1c values. The first 120 subjects to fill the designated %HbA1c levels (Table 1) made up the evaluation set for the analysis of accuracy. This population of 120 subjects was 44% male with an average age of 57 years and an average body mass index (BMI) of 31 kg/m2. POC test results ranged from 4.66% (27.4 mmol/mol) to 11.58% (103.1 mmol/mol) HbA1c using fingerstick samples and 4.72% (28.1 mmol/mol) to 11.49% (102.1 mmol/mol) HbA1c using venous samples. The NGSP SRL results using the venous samples ranged from 4.6% (26.8 mmol/mol) to 11.4% (101.1 mmol/mol) HbA1c.
The POC fingerstick and venous whole blood values were highly correlated to the NGSP SRL values, with Pearson correlation coefficients of 0.990 for both sample types. Each of the three lots individually produced correlation coefficients ≥0.989. Passing-Bablok regressions yielded a slope of 1.000 (95% confidence interval, CI: 0.971, 1.033) using fingerstick samples and 1.000 (95% CI: 0.968, 1.031) using venous whole blood samples. The y-intercepts were −0.040 %HbA1c (95% CI: −0.271, 0.165) using fingerstick samples and −0.030 %HbA1c (95% CI: −0.232, 0.184) using venous samples. For the three lots pooled together as well as for each lot considered separately, the 95% CIs for the slopes included the value 1, and the 95% CIs for the intercepts included the value 0 %HbA1c. The resulting regression plots and parameters are shown in Figure 1.
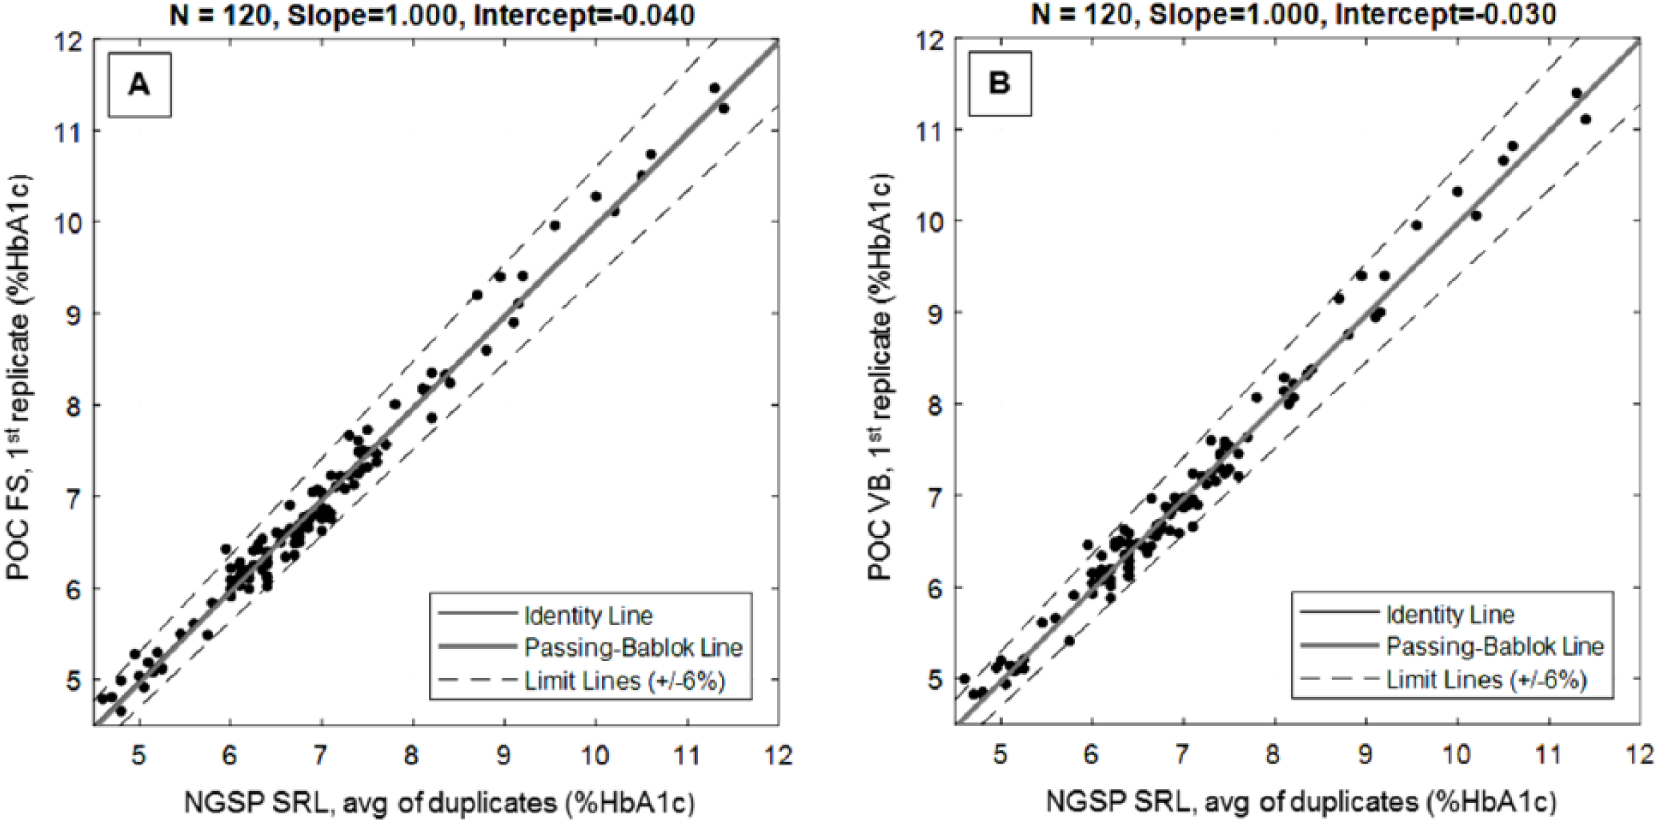
Passing-Bablok regression plots for (A) fingerstick (FS) and (B) venous whole blood (VB) samples.
Using these regression parameters, the bias between the POC results and the NGSP SRL reference was calculated at several concentrations, and in each case found to be minimal. Relative bias was −0.800% (fingerstick) and −0.600% (venous) at a concentration of 5.0% HbA1c, −0.615% (fingerstick) and −0.462% (venous) at a concentration of 6.5% HbA1c, −0.500% (fingerstick) and −0.376% (venous) at a concentration of 8.0% HbA1c, and −0.333% (fingerstick) and −0.250% (venous) at a concentration of 12.0% HbA1c.
Similarly small bias results were obtained from Bland-Altman analysis across the assay range. The mean differential bias was −0.021% HbA1c (fingerstick) and −0.005% HbA1c (venous); the relative bias was −0.346% (fingerstick) and −0.093% (venous) (Table 2). The 95% CI of the bias estimates contained the value 0, indicating the absence of significant differential or relative bias, and visual examination of the difference plots (Figure 2) showed no obvious patterns to the differences, which tended to be symmetric about the zero bias line.
Differential and Relative Bias Estimates Across the POC Assay Range Relative to the NGSP SRL.
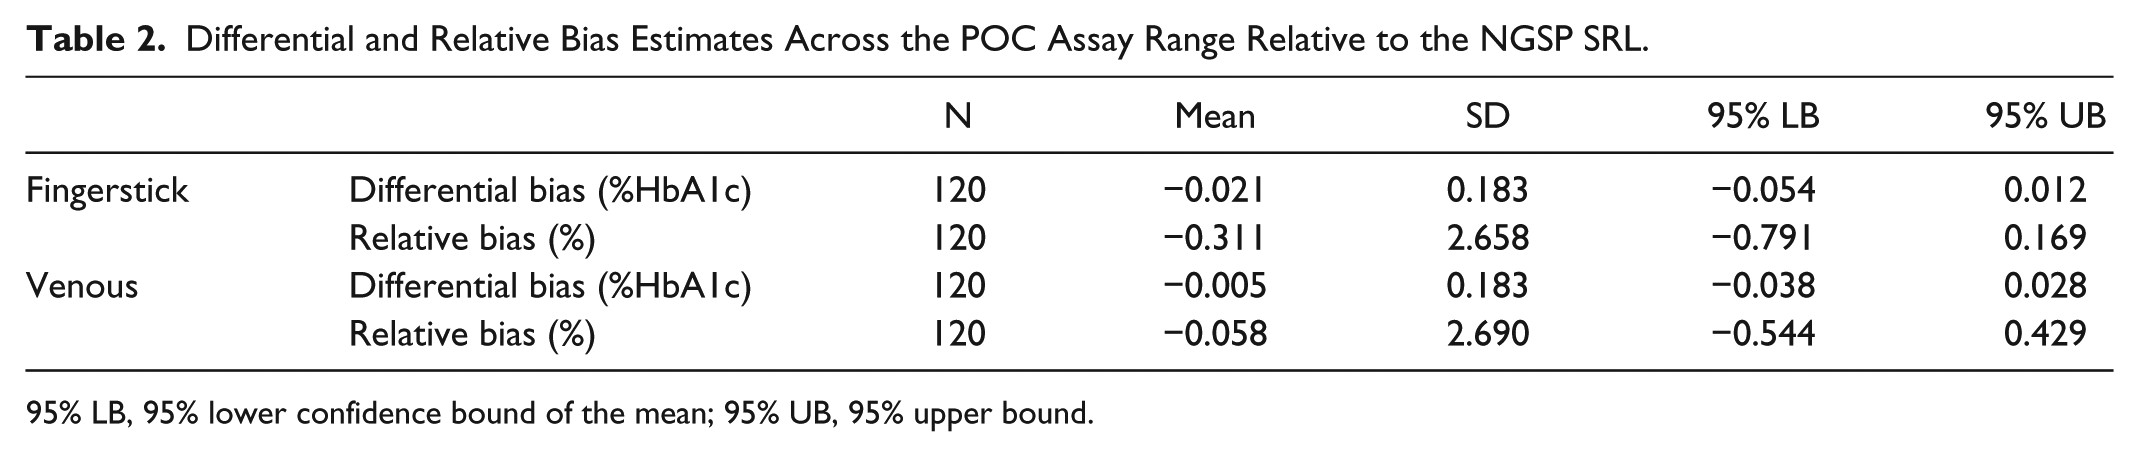
95% LB, 95% lower confidence bound of the mean; 95% UB, 95% upper bound.
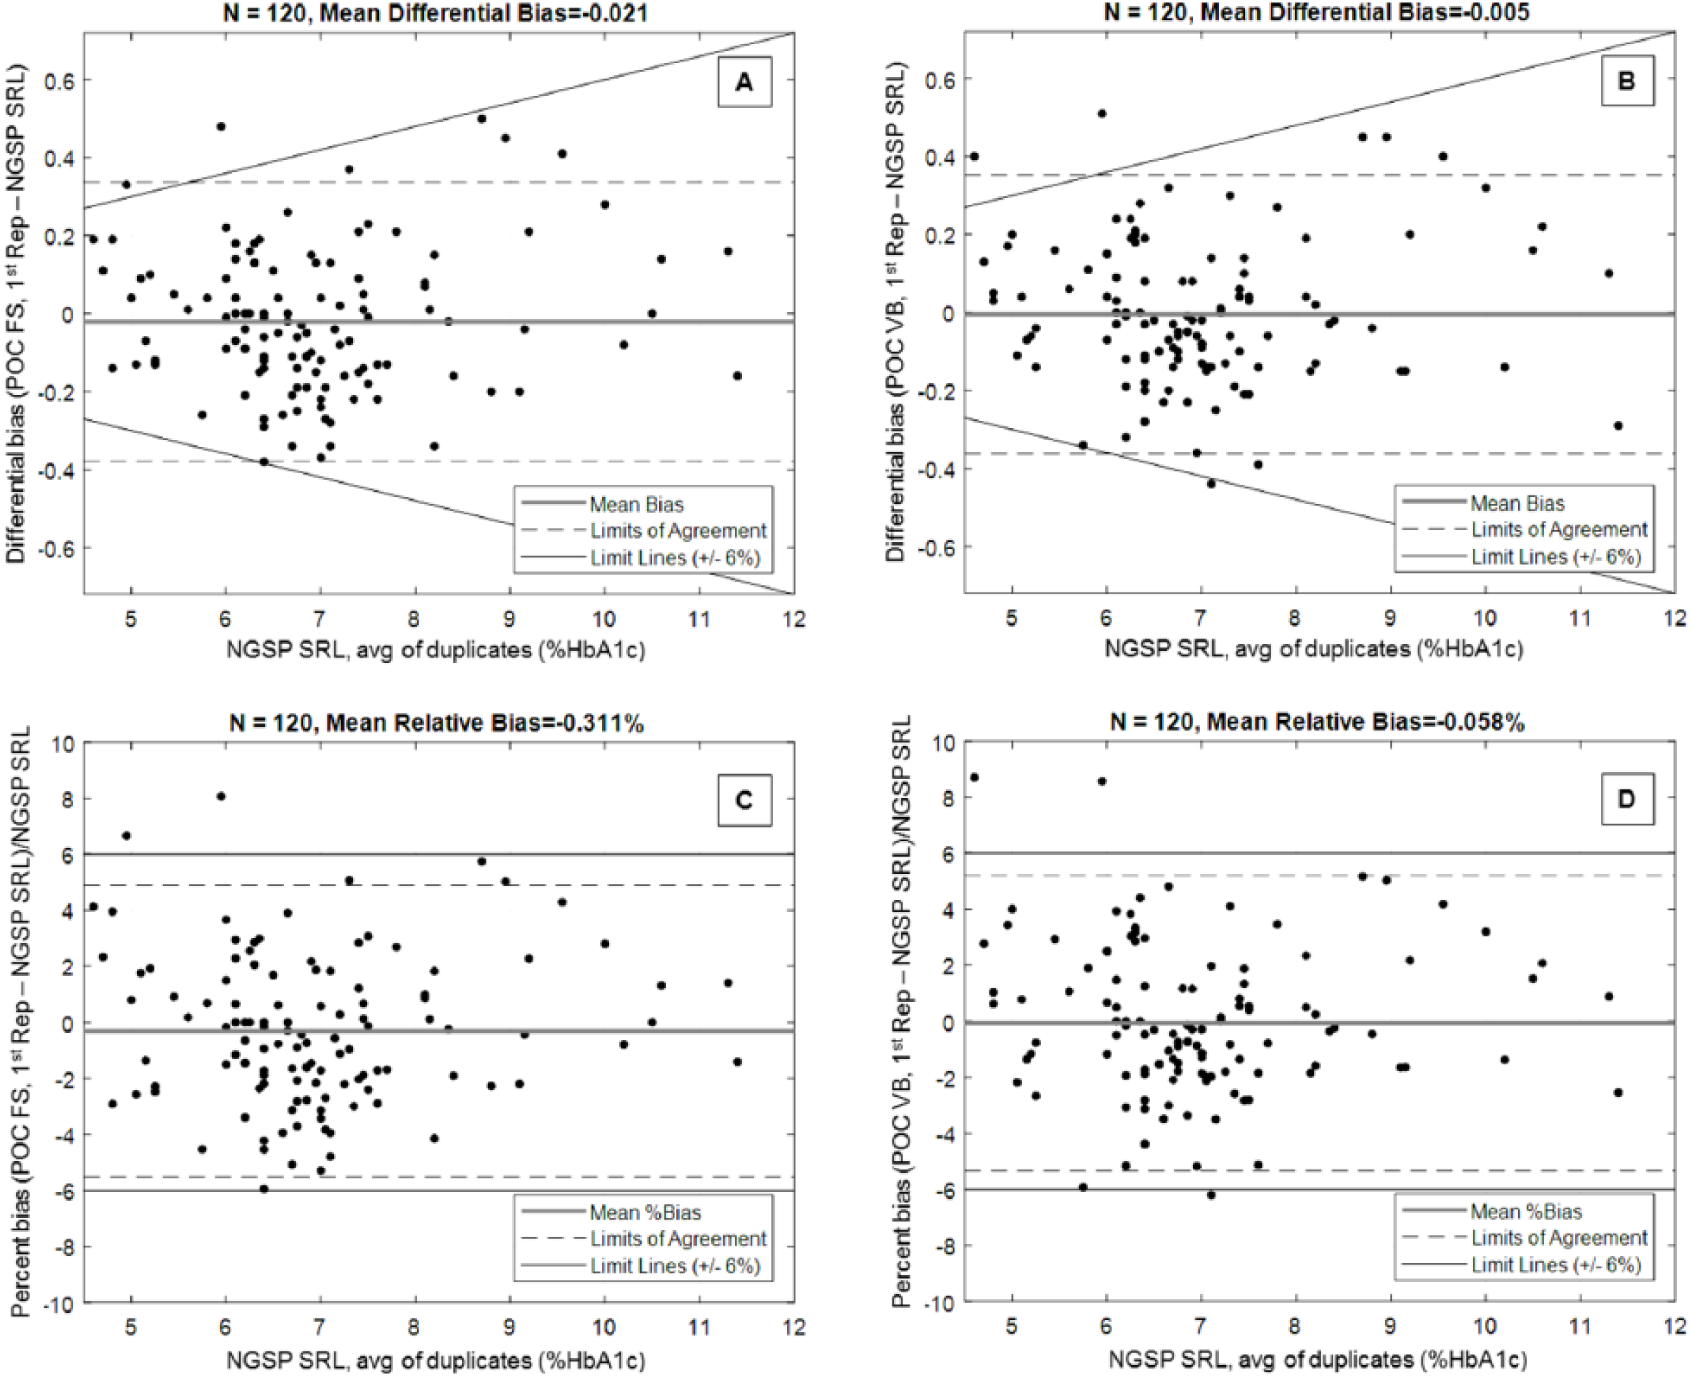
Differential bias plots for (A) fingerstick (FS) and (B) venous whole blood samples (VB); relative bias plots for (C) FS and (D) VB samples; limits of agreement (mean ± 1.96 SD).
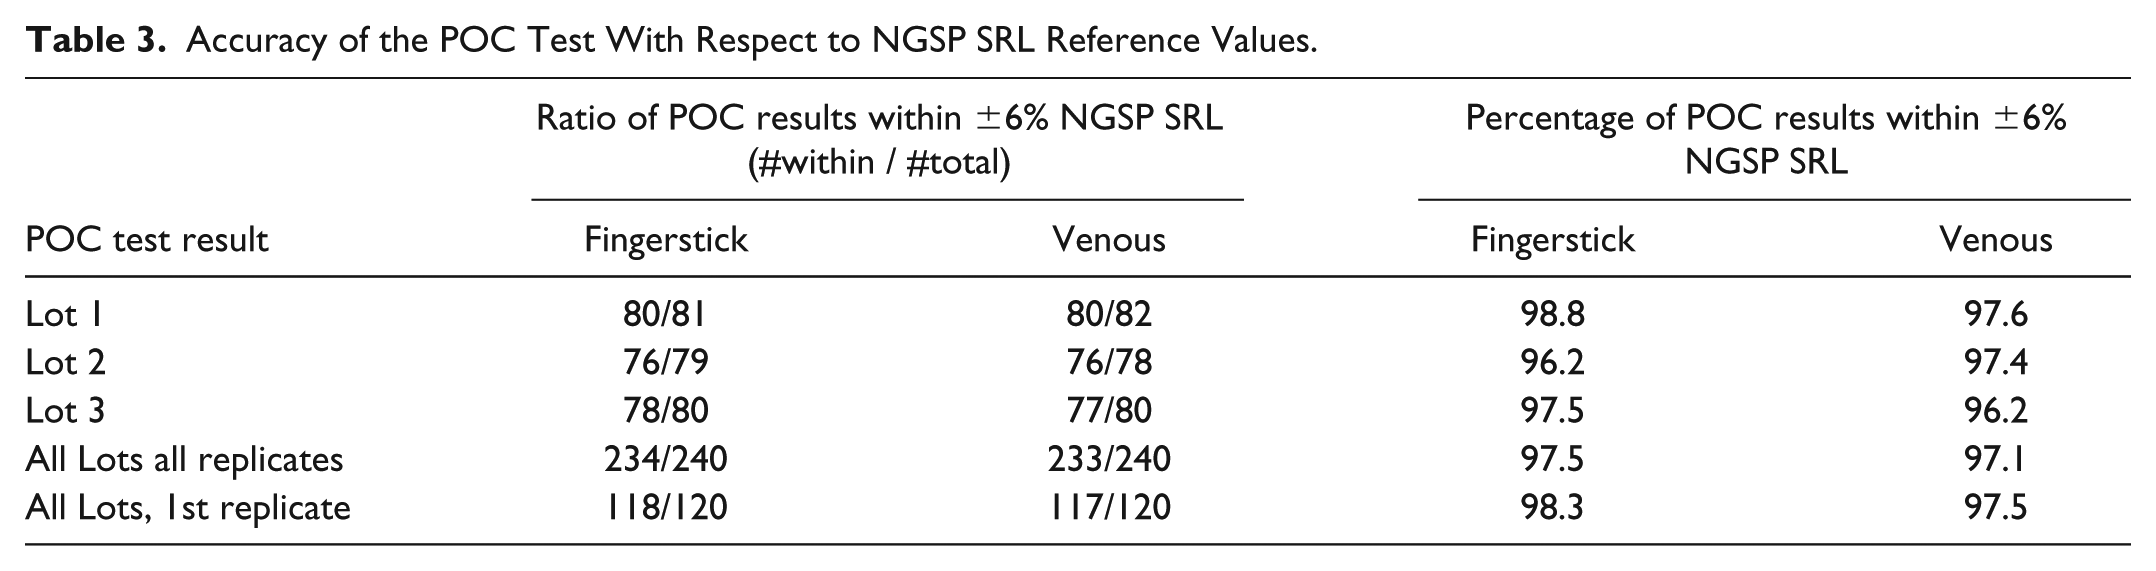
When pooling the results from all lots across all sites, at least 97% of POC test results fell within ±6% of the corresponding NGSP SRL reference values regardless of sample type (Table 3). None of the three test cartridge lots evaluated across sites produced less than 96% of results within ±6% of the NGSP SRL values. It was found that 95% of POC results using fingerstick samples and 93.3% of results using venous samples were within ±5% of the NGSP SRL values.
Accuracy of the POC Test With Respect to NGSP SRL Reference Values.
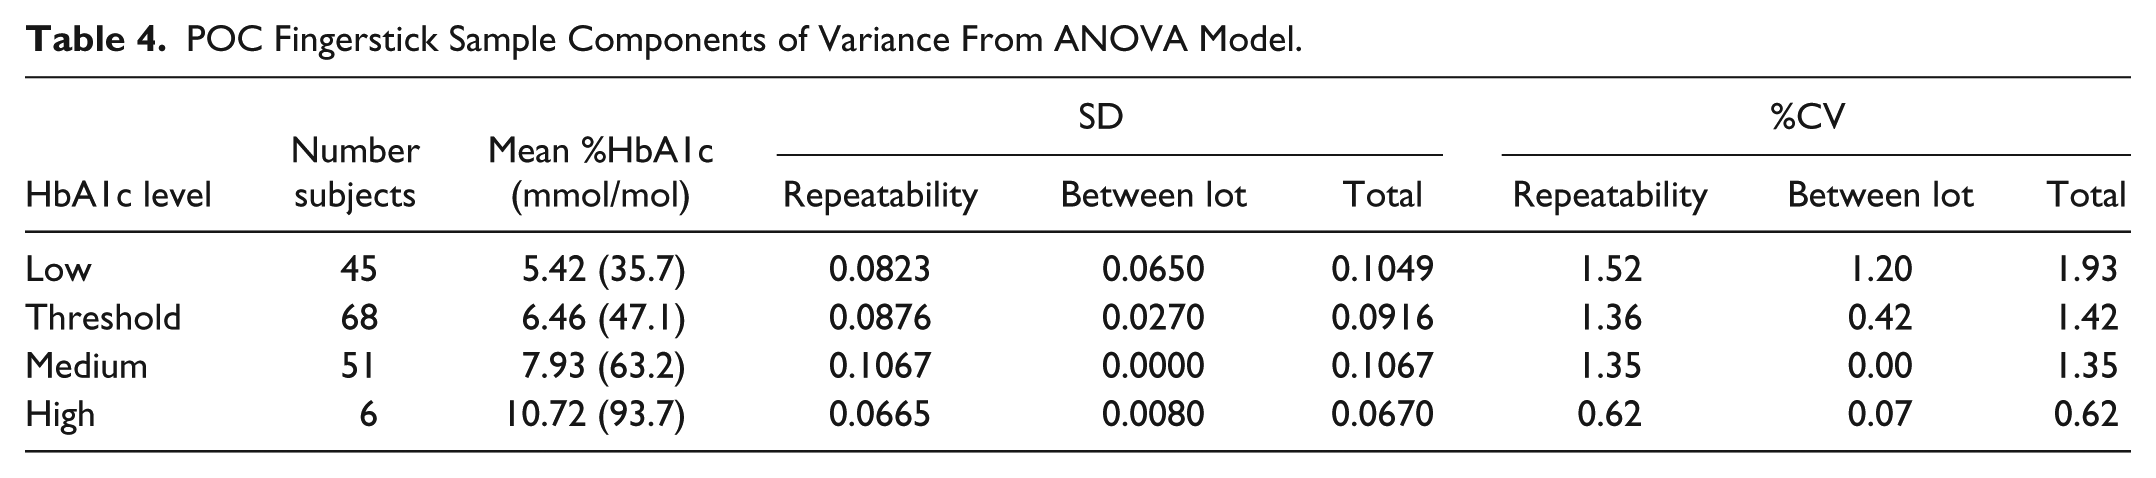
For the evaluation of fingerstick precision, 170 of the 177 subjects had the necessary two POC fingerstick test results on separate cartridge lots. Depending upon HbA1c level the repeatability component of variance ranged from 0.62% to 1.52% CV and the between-lot component ranged from 0.00% to 1.20% CV (Table 4). The total CV ranged from 0.62% to 1.93%.
POC Fingerstick Sample Components of Variance From ANOVA Model.
Venous Whole Blood Precision
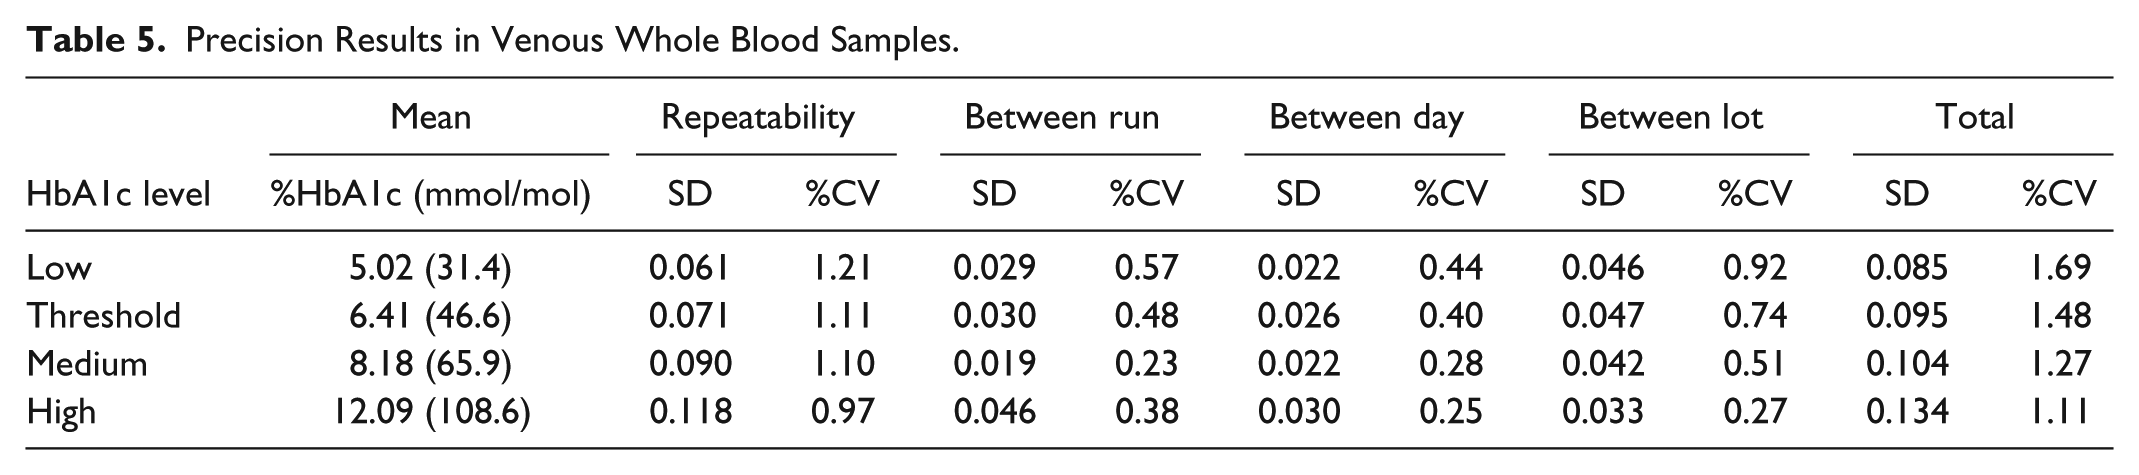
To evaluate precision using venous whole blood samples, 12 subjects were enrolled, three for each of four targeted HbA1c levels. This population was 42% male and had a mean age of 54 years and a mean BMI of 31 kg/m2. A venous blood specimen from each subject was tested on each of the three cartridge lots in four replicates, with two runs per day for 10 consecutive days. Across the three study sites, the resulting number of POC test measurements for each HbA1c level ranged from 718 to 720 replicate results. The RMS total CV for venous whole blood samples ranged from 1.11% to 1.69% (Table 5). The repeatability component of variance ranged from 0.97% to 1.21% CV. The between-run, between-day, and between-lot components did not exceed 0.92% CV.
Precision Results in Venous Whole Blood Samples.
Discussion
The results demonstrate that the POC test evaluated here is accurate across its measurement range including at the diabetes diagnostic cut point of 6.5% (47.5 mmol/mol) HbA1c. There is a very high positive correlation between the POC test and the NGSP SRL reference: the Pearson correlation coefficient was at least 0.99 using both fingerstick and venous sample types. Passing-Bablok regression uniformly produced slopes close to 1 and intercepts close to 0% HbA1c using both sample types. These regression models indicated that the bias at the diagnostic cut point of 6.5% (47.5 mmol/mol) HbA1c is minimal and on the order of a couple hundredths or less %HbA1c. Difference analysis also showed that the mean bias across the POC test measurement range was small and clinically insignificant. In both fingerstick and venous whole blood samples the 95% CIs of the estimated bias contained the value 0, indicating the absence of differential or relative bias. According to the 2017 College of American Pathologists (CAP) survey, the most recent available at the time of this writing, the mean bias for the POC method estimated here is comparable or smaller than the mean bias for many NGSP-certified laboratory methods. 21
It is noteworthy that, of the three cartridge lots tested across study sites, none produced less than 96% of results within ±6% of the NGSP SRL reference values. Beginning in 2019, the NGSP will tighten their certification criteria to 90% of candidate test results within ±5% of the reference method result. 22 Even when assessed against the future NGSP criteria of ±5%, the POC test exceeded the required performance standard.
The POC test exhibited highly precise results across its measurement range using both venous and fingerstick whole blood samples. Venous sample results, pooled across all sites and lots, exhibited total CVs that did not exceed 1.69% for any of the HbA1c levels assessed. At the diagnostic cut point of 6.5% (47.5 mmol/mol) HbA1c the total CV was 1.48%. The assessment of precision in fingerstick samples produced similar results, with a CV not exceeding 1.93% for any HbA1c level. These results are well within the HbA1c analytical performance criteria recommended by the NACB.
A disadvantage of the study design for fingerstick precision was that it did not address between-operator or between-instrument components of variance. The study did not include multiple operators testing fingerstick samples from the same subject on multiple instruments, so these components could not be estimated; however, they were the subject of a subsequent study presented elsewhere. 23 Moreover, this study was conducted with laboratory professionals; the performance of the POC test in the hands of nonlaboratory medical professionals remains to be determined. In addition, the venous precision evaluation was conducted over a 10-day period as opposed to the more standard 20-day design. Importantly, the two runs per day, four replicates per run over 10 days resulted in the same number of measurements per sample (80 results on each of three cartridge lots) as would have resulted from the standard 20-day design, and is considered consistent with the CLSI Guideline. 20
These results demonstrate that both the precision and accuracy of the POC test evaluated here meet the performance standards of the NGSP and NACB and that the test is therefore suitable for use in the diagnosis of diabetes and in the identification of people at risk of developing diabetes. This has important implications for clinical care, as POC HbA1c testing has the potential to expand patient access to diabetes diagnostic testing and expedite medical decisions and interventions aimed at the prevention of diabetes and its complications, particularly for those who face challenges in accessing traditional health care settings or attending multiple laboratory and physician follow-up appointments.
Footnotes
Acknowledgements
The authors would like to thank David Stivers for his statistical analysis of the method comparison data and Marta Clendenin for her assistance in preparing this article.
Abbreviations
ADA, American Diabetes Association; ANOVA, analysis of variance; BMI, body mass index; CAP, College of American Pathologists; CI, confidence interval; CLSI, Clinical and Laboratory Standards Institute; CV, coefficient of variation; DCCT, Diabetes Control and Complications Trial; FDA, US Food and Drug Administration; FS, fingerstick; Hb, hemoglobin; HbA1c, hemoglobin A1c; IRB, institutional review board; NACB, National Academy of Clinical Biochemistry; POC, point of care; RMS, root mean square; SD, standard deviation; SRL, Secondary Reference Laboratory; VB, venous whole blood.
Declaration of Conflicting Interests
The author(s) declared the following potential conflicts of interest with respect to the research, authorship, and/or publication of this article: WDA, KK, MHS, YL, and RCSG are employees of the study sponsor, Abbott Rapid Diagnostics, a division of Abbott Laboratories.
Funding
The author(s) disclosed receipt of the following financial support for the research, authorship, and/or publication of this article: Funding was provided by the study sponsor, Abbott Rapid Diagnostics, a division of Abbott Laboratories.