
Abstract
Background:
Point-of-care (POC) HbA1c tests hold the promise of reducing the rates of undiagnosed diabetes, provided they exhibit acceptable analytical performance. The precision and total error of the POC (Afinion™ HbA1c Dx) test were investigated using whole blood samples obtained by fingerstick and venipuncture.
Methods:
Fingerstick samples spanning the assay range were collected from 61 subjects at three representative POC sites. At each site, six fingerstick samples were obtained from each subject and tested on the POC test across two (Afinion AS100) instruments. Repeatability, between-operator, and between-instrument components of variance were calculated using analysis of variance (ANOVA). Four venous samples (low, threshold, medium, and high HbA1c) were measured in duplicate across three instruments using three reagent lots, twice per day over 20-days. Repeatability, between-run, between-day, between-lot, and between-instrument components of variance were calculated. These fingerstick and venous blood results, combined with estimates of imprecision and bias from a prior investigation, allowed for the calculation of the total coefficient of variation (CV) and total error of the POC test using fingerstick and venous whole blood samples.
Results:
The total imprecision ranged from 1.30% to 2.03% CV using fingerstick samples and from 1.31% to 1.64% CV using venous samples. The total error ranged from 2.87% to 4.75% using fingerstick samples and from 2.93% to 3.80% using venous samples.
Conclusions:
The POC test evaluated here is precise across its measuring range using both fingerstick and venous whole blood. The calculated total error of the test is well under the accepted quality requirement of ≤6%.
The measurement of HbA1c is an accepted, convenient and useful means for the diagnosis of diabetes. Despite some limitations, such as interference from common hemoglobin variants and conditions associated with increased red blood cell turnover, HbA1c measurement presents numerous advantages including greater preanalytical stability, less day-to-day variability during stress or illness, and does not require individuals to fast prior to testing. 1 The barrier to evaluating glycemic status could be further reduced by utilizing POC HbA1c methods, which can provide access to care in disadvantaged communities and offer the potential of identifying many more underserved individuals with prediabetes and diabetes.2-4 The advantages and disadvantages of HbA1c versus fasting plasma glucose or oral glucose tolerance testing for the diagnosis of diabetes have been discussed extensively elsewhere. 1
The results of a previous investigation of a POC method, the Afinion™ HbA1c Dx test (Study A) first suggested that this method may offer acceptable accuracy and precision when used by trained laboratory operators. 5
After the completion of Study A, there was interest in evaluating additional components of variance not assessed in that study design. In the study reported here (Study B), a direct evaluation of repeatability, between-operator, and between-instrument precision is made using fingerstick (capillary) whole blood samples, the principal sample type used at the POC. This is a first of a kind study to evaluate components of variance in fingerstick samples. In addition, precision using venous whole blood samples was evaluated over 20 days, consistent with Clinical and Laboratory Standards Institute (CLSI) Guideline EP05-A3 (Study C). 6 Taken together, the data from these studies (A, B, and C) enable the evaluation of the total imprecision and total error of this POC test for both fingerstick and venous whole blood sample types.
Methods
The POC test (manufactured by Alere Technologies AS, Oslo, Norway; a subsidiary of Abbott Laboratories) is a fully automated boronate affinity assay for the determination of the percentage of hemoglobin A1c in human whole blood. The test cartridge contains all of the reagents necessary for the determination of %HbA1c. A patient specimen is collected with the integrated sampling device then reinserted back into the test cartridge, which is then placed in the Afinion AS100 Analyzer (instrument). The sample is automatically diluted and mixed with a solution that releases hemoglobin from the erythrocytes. After the hemoglobin is precipitated, the sample mixture is transferred to a blue boronic acid conjugate which binds to the cis-diols of glycated hemoglobin. This reaction mixture is soaked through a filter membrane and all precipitated hemoglobin, glycated and nonglycated hemoglobin, remains on the membrane. Excess conjugate is removed with a washing reagent. The analyzer measures the reflectance of the precipitate on the membrane as blue (glycated hemoglobin) and red (total hemoglobin) color intensities. The percentage of total glycated hemoglobin and %HbA1c has been shown to be well correlated; 7 calibration adjusts the measured total glycated hemoglobin to report the equivalent level of HbA1c. The POC test is traceable to the International Federation of Clinical Chemistry and Laboratory Medicine (IFCC) Reference Method for Measurement of HbA1c, 8 and is certified by the NGSP as having documented traceability to the Diabetes Control and Complications Trial (DCCT) Reference Method. The NGSP awards certification to manufacturers for successfully meeting performance criteria for bias testing. 9
In Study A, conducted previously, 5 a first-replicate POC test value (from fingerstick and venous whole blood samples) was compared against the average of duplicate results from a venous sample tested on the Tosoh glycohemoglobin test on the G8 HPLC analyzer at the NGSP Secondary Reference Laboratory (SRL) at the Diabetes Diagnosis Laboratory, University of Missouri School of Medicine, Columbia MO. Passing-Bablok regression equations were calculated and used to estimate the bias of the POC test at HbA1c values of 5.0% (31.1 mmol/mol), 6.5% (47.5 mmol/mol), 8.0% (63.9 mmol/mol), and 12% (107.7 mmol/mol). Three POC test cartridge lots were used across sites, and the between-lot component of variance, as well as repeatability estimates for low, threshold, medium, and high HbA1c levels, were calculated as follows. Samples were grouped into the following four HbA1c interval levels: low (4.00%-5.99% HbA1c, or 20.2-42.0 mmol/mol HbA1c), threshold (6.00%-6.99% HbA1c, or 42.1-52.9 mmol/mol HbA1c), medium (7.00%-9.99% HbA1c, or 53.0-85.7 mmol/mol HbA1c), and high (≥10% HbA1c, or 85.8 mmol/mol HbA1c). For each HbA1c level the imprecision was separated into repeatability (within-run) and between-lot components of variance using a two-factor ANOVA model without nesting based on Type II sums of squares (MATLAB ANOVAN and SAS PROC MIXED).
In Study B, at three POC study sites having laboratories operated by trained medical professionals, fingerstick samples from prospectively enrolled subjects were collected and tested on the POC test. Each subject signed an informed consent form approved by a central, independent institutional review board (IRB) prior to any study procedures being conducted. Enrollment included those that met the following eligibility criteria: Inclusion criterion:
At least 18 years of age
Exclusion criteria:
Known to have the hemoglobin variant HbF > 7%
Diagnosed with hemophilia
Taking glucocorticoid or nicotinic acid medications
Diagnosed with iron deficiency, hemolytic anemia, thalassemias, hereditary spherocytosis, chronic hepatic, or renal disease
Pregnant
Received a blood transfusion or cancer chemotherapy within the prior three weeks
Unwilling or unable to sign a written informed consent and comply with study procedures, or is deemed inappropriate for participation by the site investigator
Each site targeted enrolling five subjects having HbA1c values within one of the low, threshold, medium, and high levels as defined above. Fingerstick sample testing was conducted by using the same lot of POC test cartridges at each of the three study sites. At each site, for each subject, there were three test operators who performed testing across two instruments. Each operator collected two fingerstick samples and tested them, one sample per instrument. The results from the fingerstick testing were evaluated by using ANOVA methodology based on Type II sums of squares (MATLAB ANOVAN and SAS PROC MIXED), consistent with the methodology described in CLSI EP05-A3. 6 The repeatability (within-run), between-operator, and between-instrument components of variance were calculated for each HbA1c level by combining the data from all sites. For each component of variance, the CV was calculated as the SD divided by the grand mean of all the POC test results within the level.
In Study C, at the manufacturer’s site, four venous whole blood samples were selected for precision testing, one at each HbA1c level (low, threshold, medium, and high), as defined for the fingerstick samples. These K2-EDTA-anticoagulated samples were identified from among deidentified remnants of specimens from hospital laboratories or fresh samples collected from an IRB approved in-house donation. Each of the four samples was tested on the analyzer using each of three reagent lots and each of three instruments. Two replicate results were obtained during each of two runs per day over a 20-day period, for a total of 720 measurements at each HbA1c level. From the results of Study C, the repeatability (within-run), between-run, between-day, between-lot, and between-instrument SD and CV were calculated (SAS VARCOMP).
The total CV of the POC test using fingerstick samples was calculated based on the sum of squares of six components of variance: repeatability, between-lot, between-run, between-day, between-instrument, and between-operator (see Table 1). The between-run and between-day components were obtained from the POC test results using venous samples in Study C, since these components cannot be directly estimated using fingerstick samples. The between-lot and repeatability components were obtained from Study A, because the number of subjects was larger in this study than in Study B. Study B was necessary to estimate the between-operator and between-instrument components of variance in fingerstick samples.
Summary of Components of Variance Used in the Calculation of Total Imprecision, and Study From Which the Estimate Was Obtained.
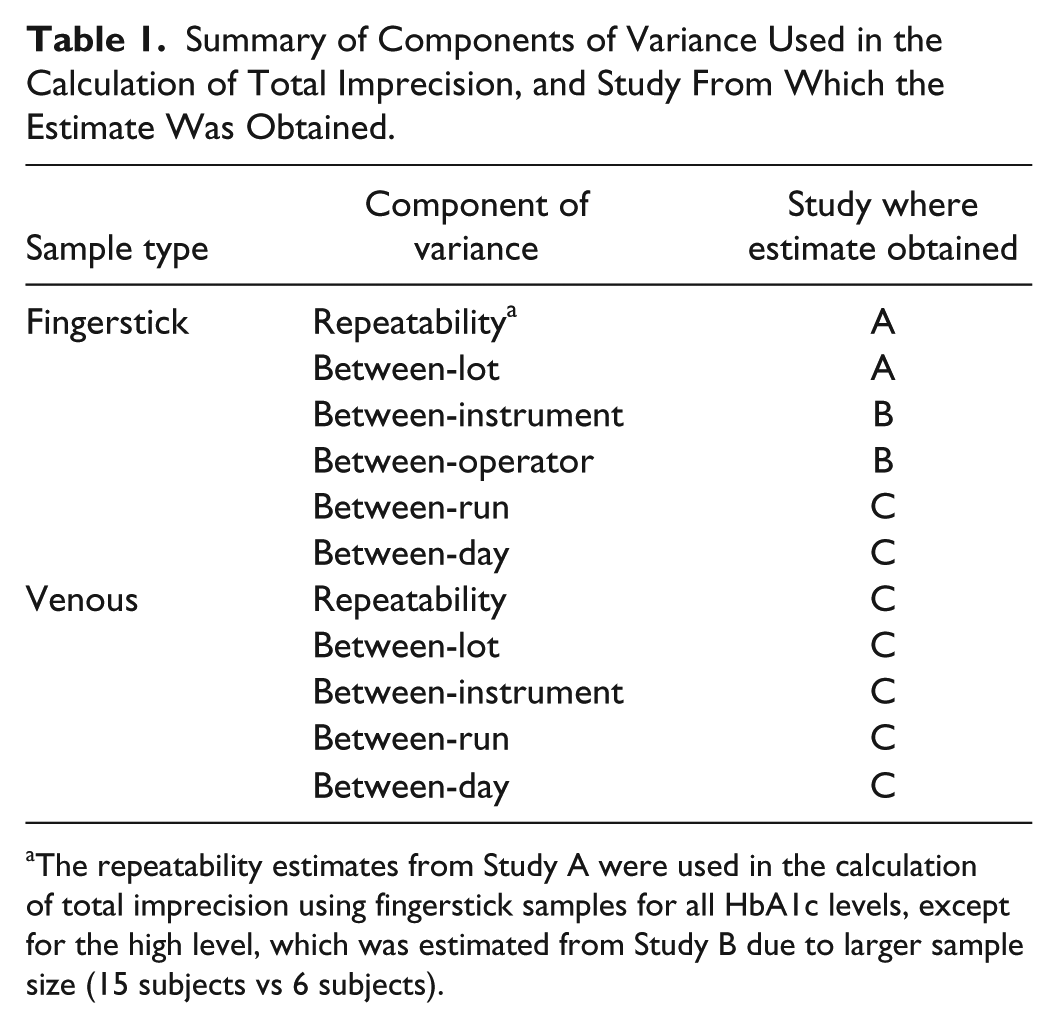
The repeatability estimates from Study A were used in the calculation of total imprecision using fingerstick samples for all HbA1c levels, except for the high level, which was estimated from Study B due to larger sample size (15 subjects vs 6 subjects).
The total CVs, together with the bias estimates from study A, were used to estimate the total error of the POC test at HbA1c values of 5.0% (31.1 mmol/mol), 6.5% (47.5 mmol/mol), 8.0% (63.9 mmol/mol), and 12% (107.7 mmol/mol) using fingerstick and venous whole blood samples. The coefficient of variance, bias, and total error are expressed as a percentage of the mean, where the mean is expressed in NGSP units (%HbA1c).
Results
A total of 62 subjects were enrolled across three sites for the purpose of fingerstick sample testing in Study B. One of the 62 subjects had out-of-range HbA1c values and was excluded from analysis. The remaining 61 subjects each provided six fingerstick samples. The population had an average age of 60 years, was 56% male, and had HbA1c values evenly distributed over the measurement range of the POC test. Estimates of between-instrument, between-operator, and repeatability components of variance from the testing of these fingerstick samples are shown in Table 2. Across the assay range, the between-instrument imprecision did not exceed 0.47% CV, and the between-operator imprecision did not exceed 0.21% CV. While repeatability was the largest component of variance, it did not exceed 1.39% CV.
POC Test Components of Variance Using Fingerstick Whole Blood Samples Estimated in Study B.
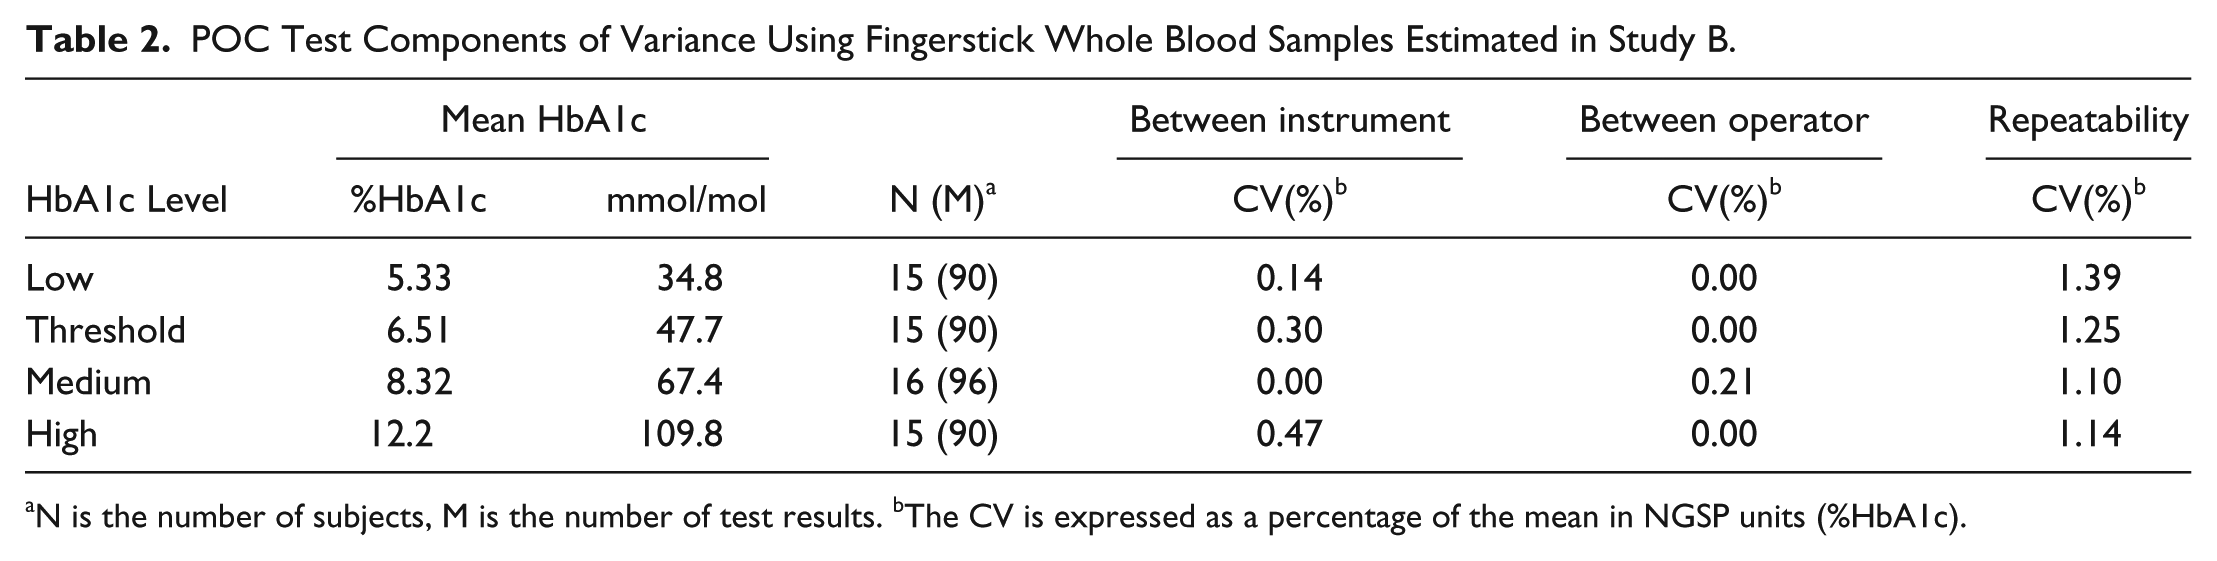
N is the number of subjects, M is the number of test results. bThe CV is expressed as a percentage of the mean in NGSP units (%HbA1c).
These estimates of fingerstick repeatability were slightly smaller than but consistent with those calculated from previous studies. Table 3 describes the repeatability and between-lot components of variance that were calculated using prior duplicate fingerstick measurements in Study A. 5
POC Test Components of Variance Using Fingerstick Whole Blood Samples Estimated in Study A. 5
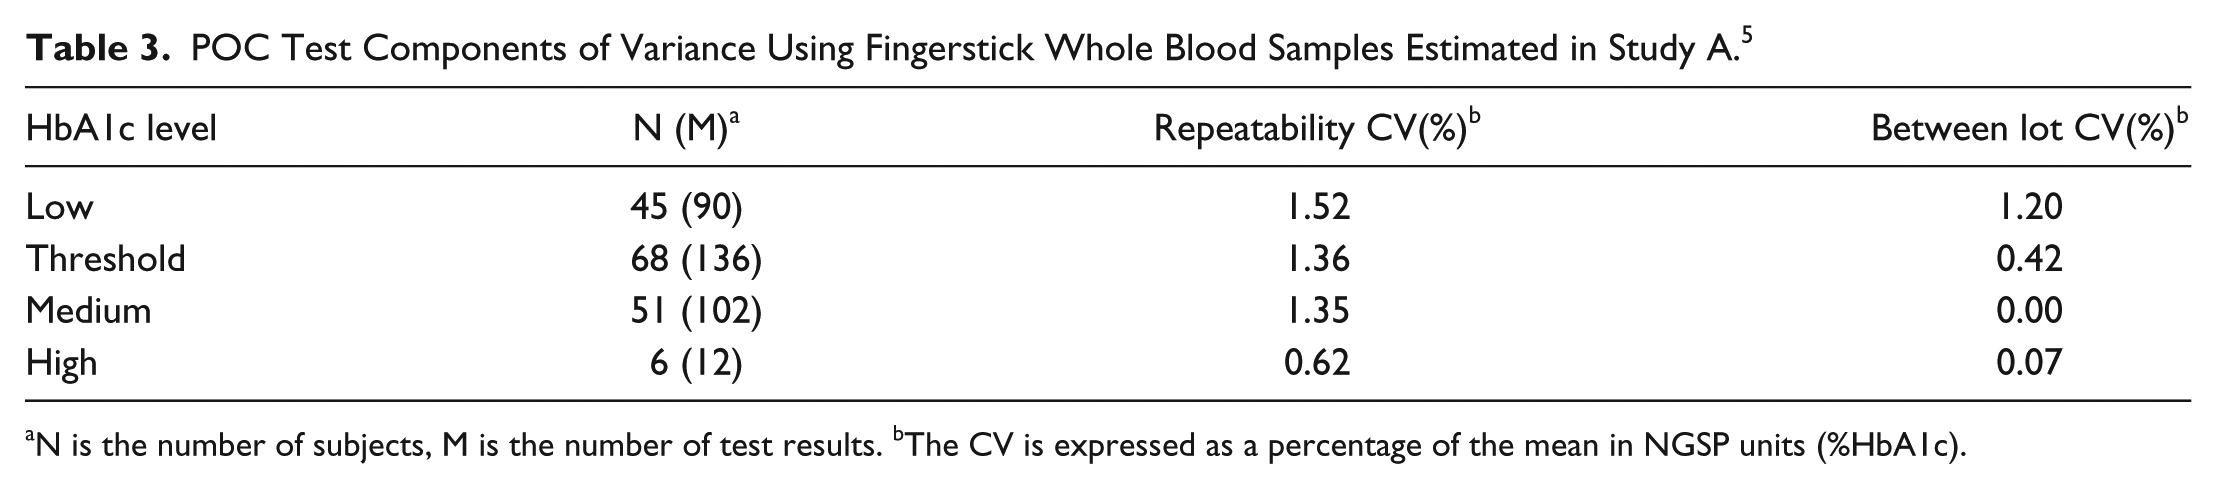
N is the number of subjects, M is the number of test results. bThe CV is expressed as a percentage of the mean in NGSP units (%HbA1c).
In Study C, four venous whole blood samples, representing low, threshold, medium, and high HbA1c levels, were tested on the POC test over 20 days. A grand total of 720 measurements for each HbA1c level resulted from testing these samples on each of three cartridge lots and each of three instruments with two runs per day and two measurements per run. Estimates of the components of variance and total %CV for these venous sample results are shown in Table 4. As was the case with fingerstick samples in Study A and Study B, the repeatability was the single largest component of variance for the POC test when using venous whole blood samples.
POC Test Components of Variance Using Venous Whole Blood Samples Estimated in Study C.
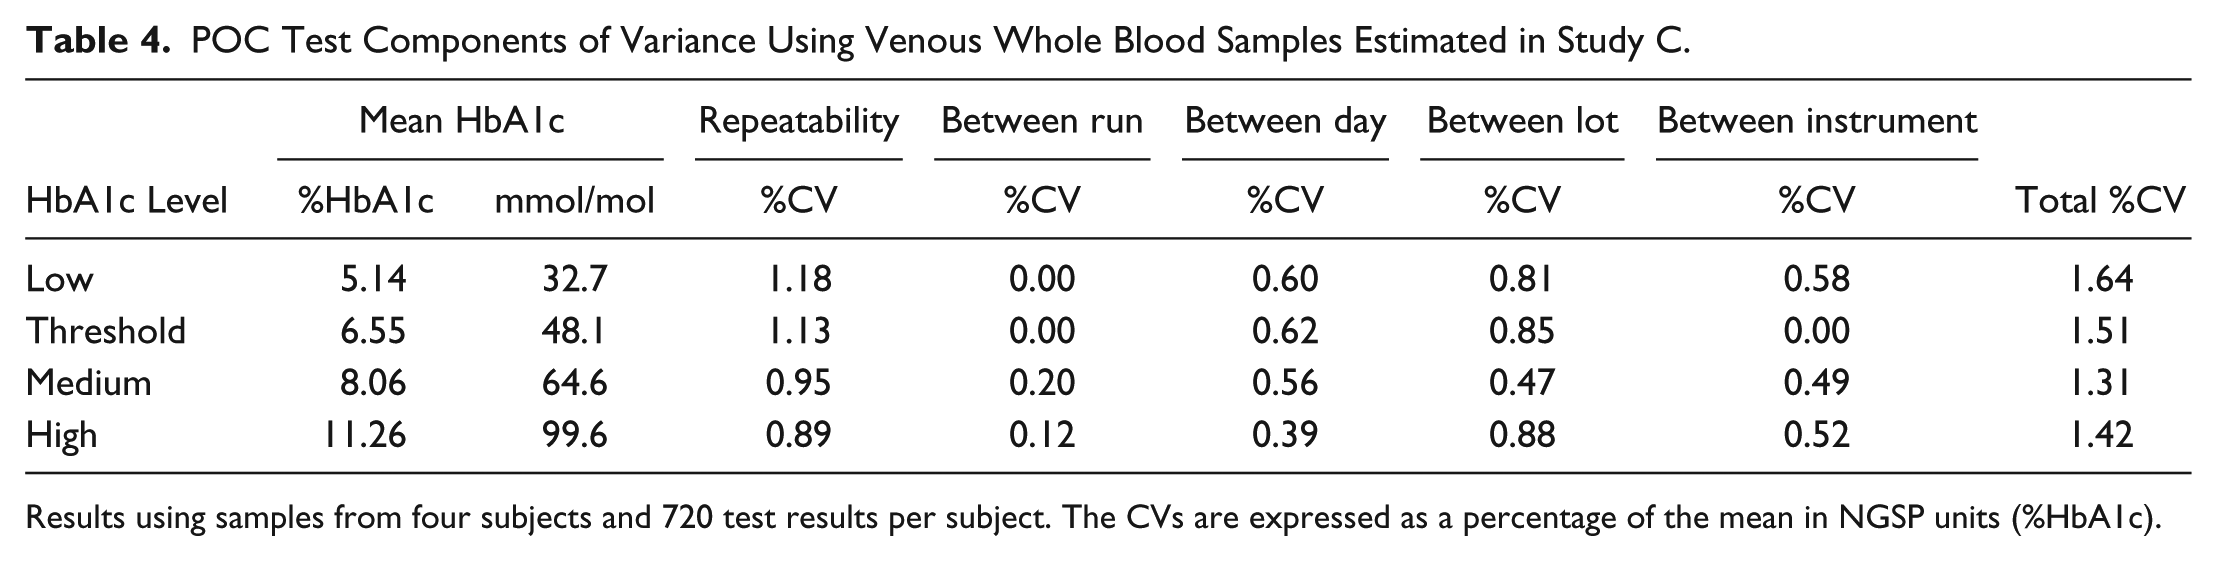
Results using samples from four subjects and 720 test results per subject. The CVs are expressed as a percentage of the mean in NGSP units (%HbA1c).
Using the sums of squares of the relevant components of variance, estimates were made of the total imprecision of the POC test when testing fingerstick samples (Table 5). The total error of the POC test was then estimated according to the equation:
Total Imprecision of the POC Test Using Fingerstick Samples.
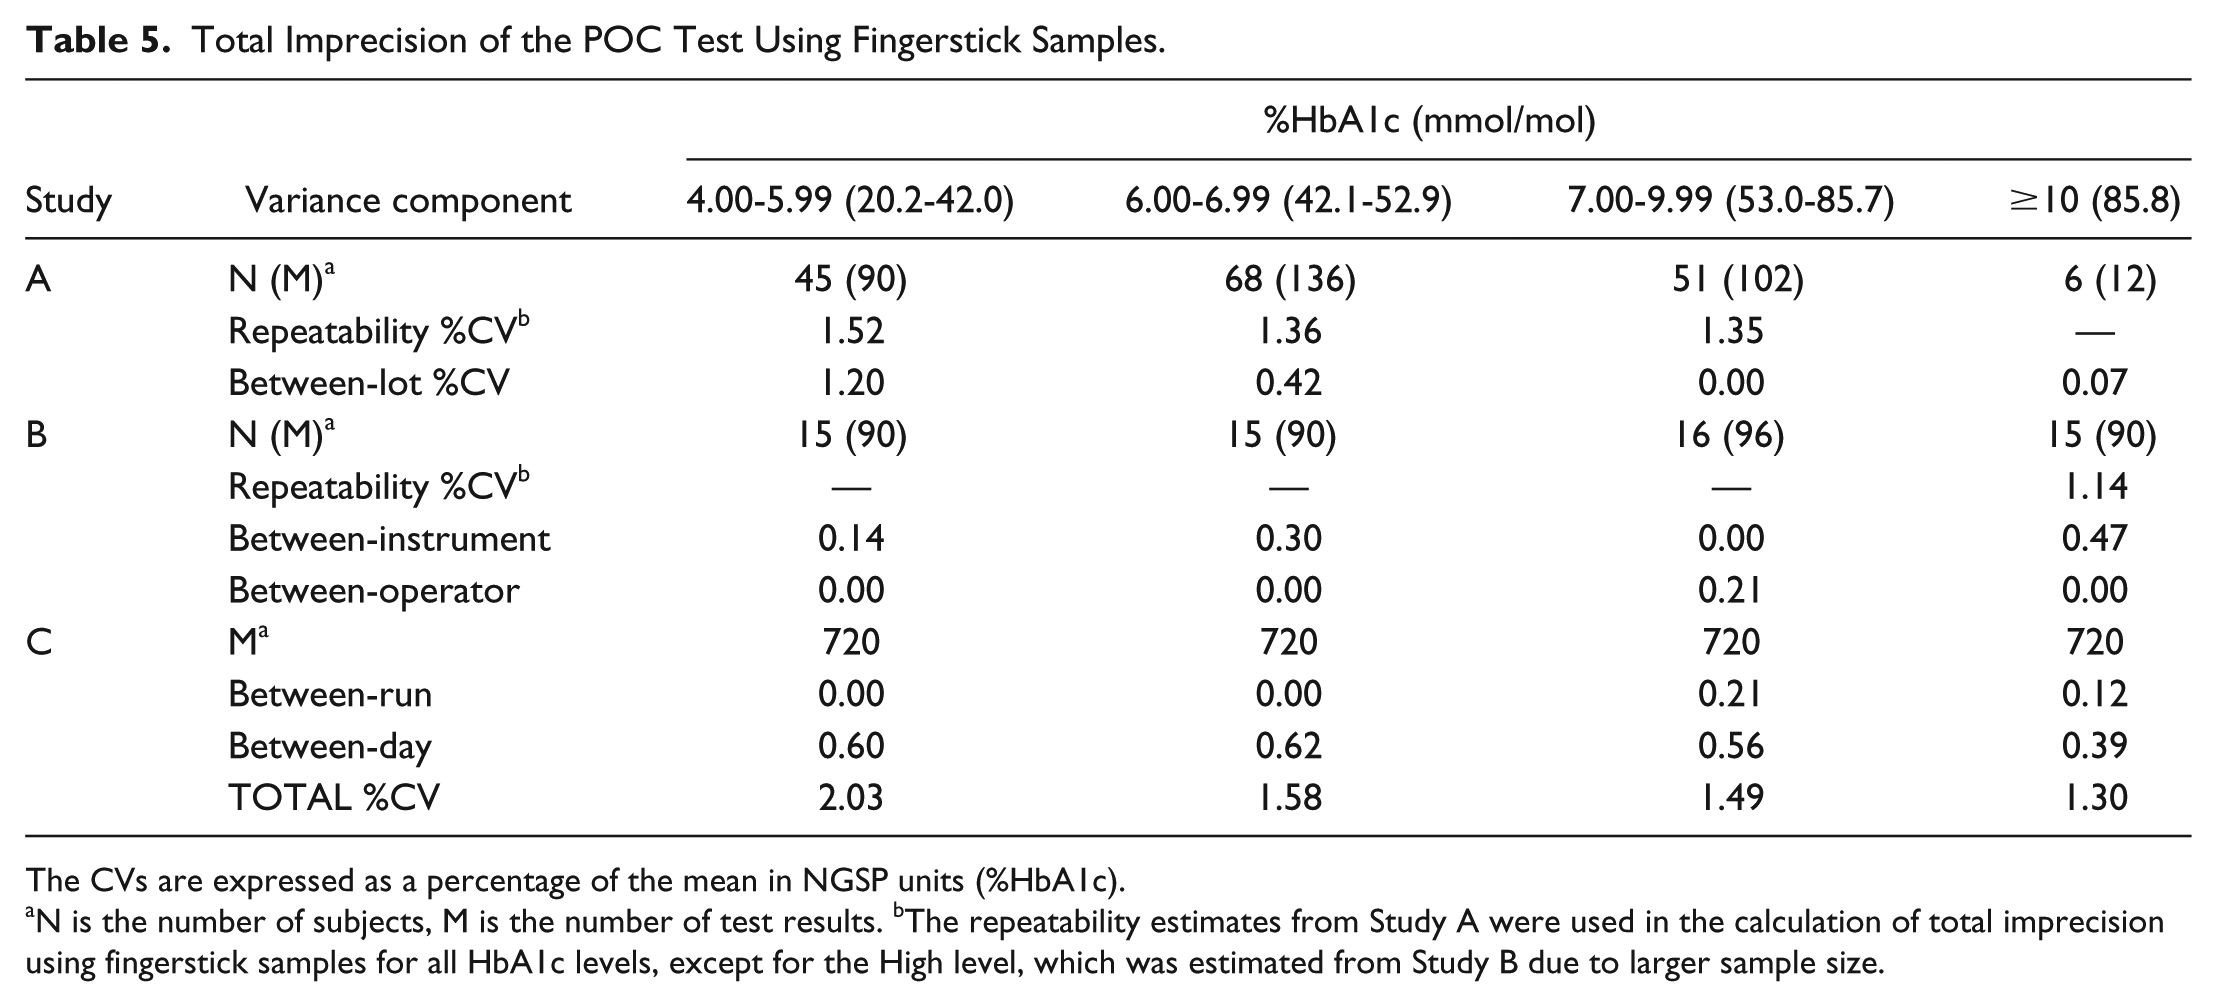
The CVs are expressed as a percentage of the mean in NGSP units (%HbA1c).
N is the number of subjects, M is the number of test results. bThe repeatability estimates from Study A were used in the calculation of total imprecision using fingerstick samples for all HbA1c levels, except for the High level, which was estimated from Study B due to larger sample size.
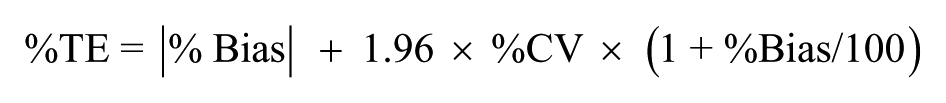
Across the assay range, the total imprecision using fingerstick samples was 2.03% CV or less, and the total error did not exceed 4.75% (Table 6). When using venous blood samples the total CV was 1.64% or less, and the total error was no greater than 3.80%.
Total Imprecision, Bias, and Total Error Estimates for POC Test.
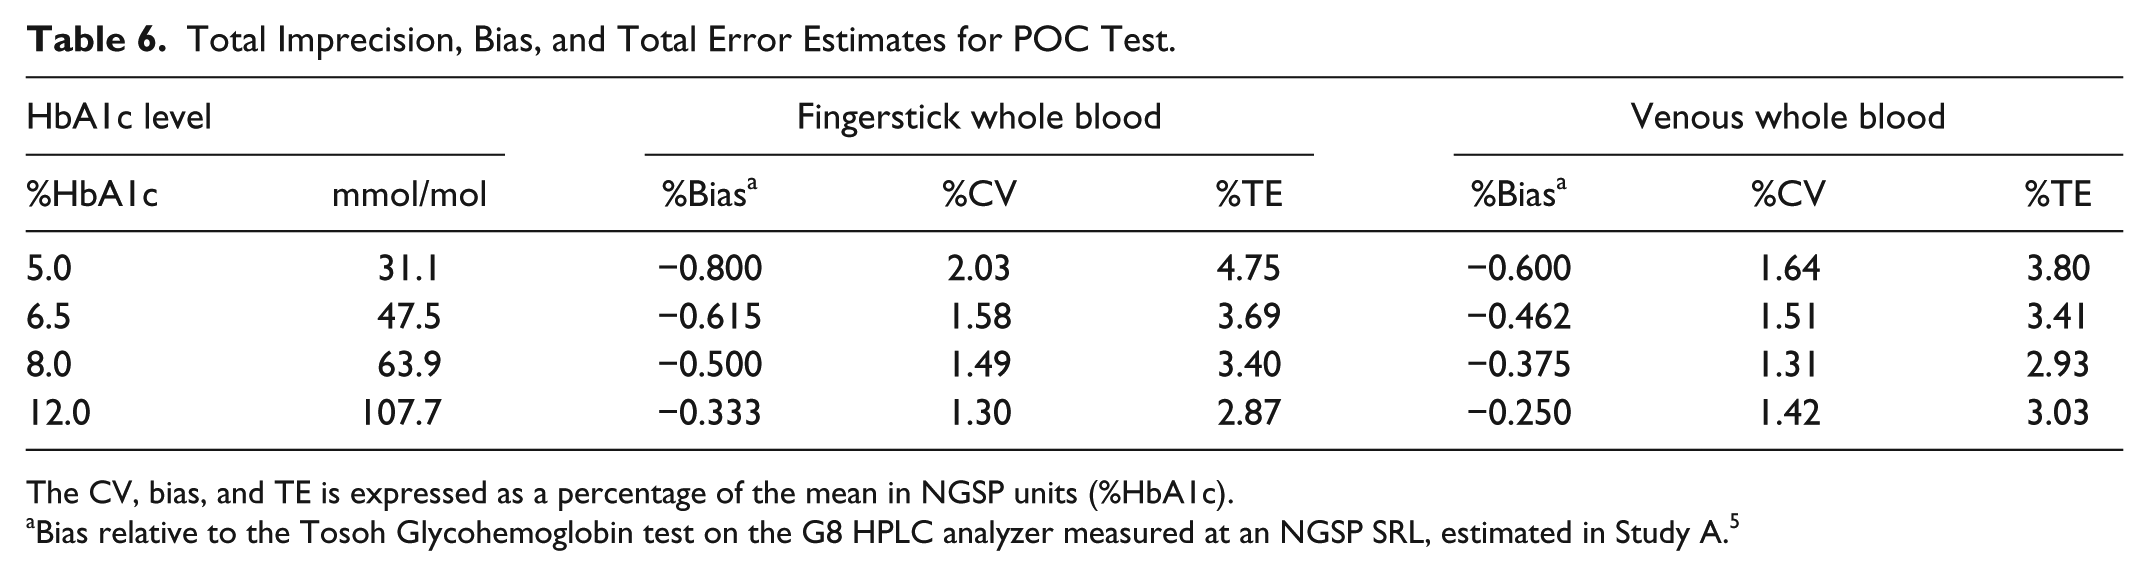
The CV, bias, and TE is expressed as a percentage of the mean in NGSP units (%HbA1c).
Bias relative to the Tosoh Glycohemoglobin test on the G8 HPLC analyzer measured at an NGSP SRL, estimated in Study A. 5
Discussion
The results indicate that the POC test evaluated here is highly precise across the measuring range of the assay when using fingerstick and venous whole blood samples. The estimated imprecision is well within the <3% CV recommended by the National Academy of Clinical Biochemistry guidelines for single-method, interlaboratory (between laboratories) HbA1c imprecision. 10 The total error of the POC test, regardless of sample type and HbA1c level, is well below the criterion of ≤6% total error specified in the FDA special controls for HbA1c test systems (21 CFR 862.1373) 11 and required for NGSP certification. 12 Around the diagnostic cut point of 6.5% HbA1c (47.5 mmol/mol), the total imprecision of the POC test was less than 2% CV, and the total error was less than 4%.
To our knowledge, there are currently no published studies evaluating the total imprecision and total error of POC HbA1c tests using fingerstick samples, however our results using venous whole blood samples are similar to those from the most recent College of American Pathologists (CAP) Survey, which shows the performance of this POC test is comparable to that of many laboratory methods that are routinely used in the diagnosis of diabetes. 13 These results are consistent with previous evaluations, where the POC test evaluated here demonstrated a high degree of accuracy and precision compared to routine laboratory methods 14 and other POC methods.15,16
The POC test evaluated here has not yet been granted a CLIA waived categorization, and therefore additional investigation of its performance in the hands of self-trained, nonlaboratory professionals is warranted. POC HbA1c devices can offer benefits by providing patient results within minutes, facilitating immediate dialogue between the care provider and patient, and expanding the reach of HbA1c testing to underserved areas where people with undiagnosed diabetes might be identified.
Footnotes
Acknowledgements
The authors would like to thank David Stokar for his validation of the ANOVA results and Marta Clendenin for her assistance in preparing this article.
Abbreviations
ANOVA, analysis of variance; CAP, College of American Pathologists; CLSI, Clinical and Laboratory Standards Institute; CV, coefficient of variation; DCCT, Diabetes Control and Complications Trial; IFCC, International Federation of Clinical Chemistry and Laboratory Medicine; IRB, institutional review board; POC, point of care; RMS, root mean square; SD, standard deviation; SRL, Secondary Reference Laboratory.
Declaration of Conflicting Interests
The author(s) declared the following potential conflicts of interest with respect to the research, authorship, and/or publication of this article: WDA, KK, MHS, KSF, and RCSG are employees of the study sponsor, Abbott Rapid Diagnostics, a division of Abbott Laboratories.
Funding
The author(s) disclosed receipt of the following financial support for the research, authorship, and/or publication of this article: Funding was provided by the study sponsor, Abbott Rapid Diagnostics, a division of Abbott Laboratories.