
Abstract
Background:
It is widely known that diabetes can induce stiffness and adversely affect joint mobility even in young patients with type 1 diabetes mellitus (T1D). The aim of this study was to identify a mathematical model of diabetes mellitus long-term effects on young T1D patients.
Methods:
Ankle joint mobility (AJM) was evaluated using an inclinometer in 48 patients and 146 healthy, sex- BMI-, and age-matched controls. Assuming time invariance and linear superposition of the effects of hyperglycemia, the influence of T1D on AJM was formalized as an impulse response putting into relationship past supernormal HbA1c concentrations with the ankle total range of motion. The proposed model was identified by means of a nonlinear evolutionary optimization algorithm.
Results:
AJM was significantly reduced in young T1D patients (P < .001). AJM in both plantar and dorsiflexion was significantly lower in subjects with diabetes than in controls (P < .001). The identified impulse response indicates that impaired metabolic control requires 3 months to bring out its maximum effect on the reduction of AJM, while the following long-lasting decay phase with the expected AJM recovery times, normally depends on the slow turnover of collagen. HbA1c concentration levels above 7.2% are sufficient to produce a reduction of ankle ROM.
Conclusions:
In young patients with T1D the lack of glycemic control over time affects AJM. HbA1c levels can serve as a relevant prognostic factor for assessing the progression of LJM in subjects with diabetes.
The number of young type 1 diabetes mellitus (T1D) patients is progressively increasing worldwide and recent studies have identified it as one of the most common endocrine disorders affecting childhood. 1 Despite the presence of significant regional differences throughout the world, it has been reported that T1D affects 7-12% of the whole population which, in turn, will represent about 640 million people in 2040. 2
Over the years, patients with diabetes may develop chronic complications that are closely correlated with glucose abnormalities along with relative insulin deficiency.3,4 Among these, it is well known that diabetes can induce stiffness and joint alterations in young patients recently diagnosed T1D.5-11 In particular, limited joint mobility (LJM), that is, the reduction of joint range of motion (ROM) usually associated with movement stiffness, in patients of different ages, can affect the joints of the whole body.6-15
In young T1D patients, starting from mid-1970s of the past century, many studies investigated and described LJM, its causes, its prevalence, in addition to its role in monitoring longstanding diabetes complications, that is, the vascular ones and in particular the microvascular alterations (retinopathy, nephropathy, and neuropathy).5-8,15-18 More recently, a number of studies investigated LJM in young T1D patients at the level of distal joints of the lower limb to evaluate its correlations with microvascular disease, the quality of gait, posture and the risk of developing deformities.12-15
Still now, even if all the possible factors and their role in the development of LJM in T1D are not yet fully known, it is deemed that a reduced glycemic control contributes to the progression of joints stiffening.6,7,11,16,17
The main factor causing LJM is thought to be an excess of nonenzymatic glycosylation of collagen that produces advanced glycation end products (AGEs), which in turn lead to increased collagen cross-linking and thus induce mechanical stiffness.7,8,11,17
Therefore, from the disease onset, patients with diabetes show some factors leading to LJM and a progressive stiffening of periarticular structures develops over time, specifically in the distal joints of the limbs.7,8,11,17
Recently, we published preliminary studies with large sample size of patients on the role of certain factors that, in addition to the glycemic control maintained over time, can affect ankle joint mobility (AJM). In particular, we investigated the role of the sport practiced and the own social networks of each young patients.19,20
The results of these studies show that the sport practice does not modify the difference of AJM between patients and healthy controls with the exception of soccer players that significantly reduce the AJM only in controls.19,20
Among all joints, the ankle ROM is one of the most investigated in patients with diabetes.6,9,12-15,21-26 AJM assessment in addition to be useful for monitoring patients’ condition, and preventing or treating ankle joint stiffness in T1D patients could also contribute avoiding possible negative effects on both a proper gait biomechanics and the posture necessary to achieve a correct lifestyle and motor development.12-15,19,27 Moreover, AJM could provide useful information on further impairments that could also affect young patients with T1D.
In this sense, the presence of significant joint stiffness and consequent ROM reduction could lead to an overuse condition, tissue and joint damage,7,19,25,27,28 as well as it might be implicated in the development of deformity and Achilles tendon alterations jointly with the contracture of gastrocnemius-soleus complex.22-26,29
Starting from this state of art, it is necessary to go ahead in studying that relationship to better understand the effects of diabetes on joint mobility of young patients with T1DM. Hence, in this study we formulated and identified a model that can relate the degree and duration of impaired metabolic control, as identified with elevated levels of glycosylated hemoglobin (HbA1c), with the reduction of AJM in young T1D patients. The aim of this study was to identify a mathematical model of diabetes mellitus long-term effects on AJM in young T1D patients.
Materials and Methods
Patients attending Meyer Children’s Hospital in Florence, Italy, were consecutively enrolled for the evaluation of AJM in plantar and dorsiflexion by means of an inclinometer (Fabrication Enterprises Inc, White Plains, NY, USA), following the procedure reported in previous articles.13,19,30
A total of 48 patients with T1D were evaluated and compared with 146 healthy age-, BMI-, and sex-matched controls. The main characteristics of the study participants are shown in Table 1. Patients with orthopedic and/or surgical foot complications were excluded. Data on age, sex, lower limb-dominance, weight, height, body mass index (BMI, expressed as body weight in kilograms divided by height in meters squared, kg/m2), diabetes duration, and presence of neuropathy were collected. The physical examination included foot inspection and evaluation of deformities. HbA1c was measured at baseline by high-performance liquid chromatography. The measured mobility was associated with previous measurements of glycosylated hemoglobin, collected from the patient’s health record, as required by the clinical protocol, that is, measured every three months from the time of disease diagnosis.
T1D Patients and Controls Characteristics With Dorsal, Plantar, and Total AJM.
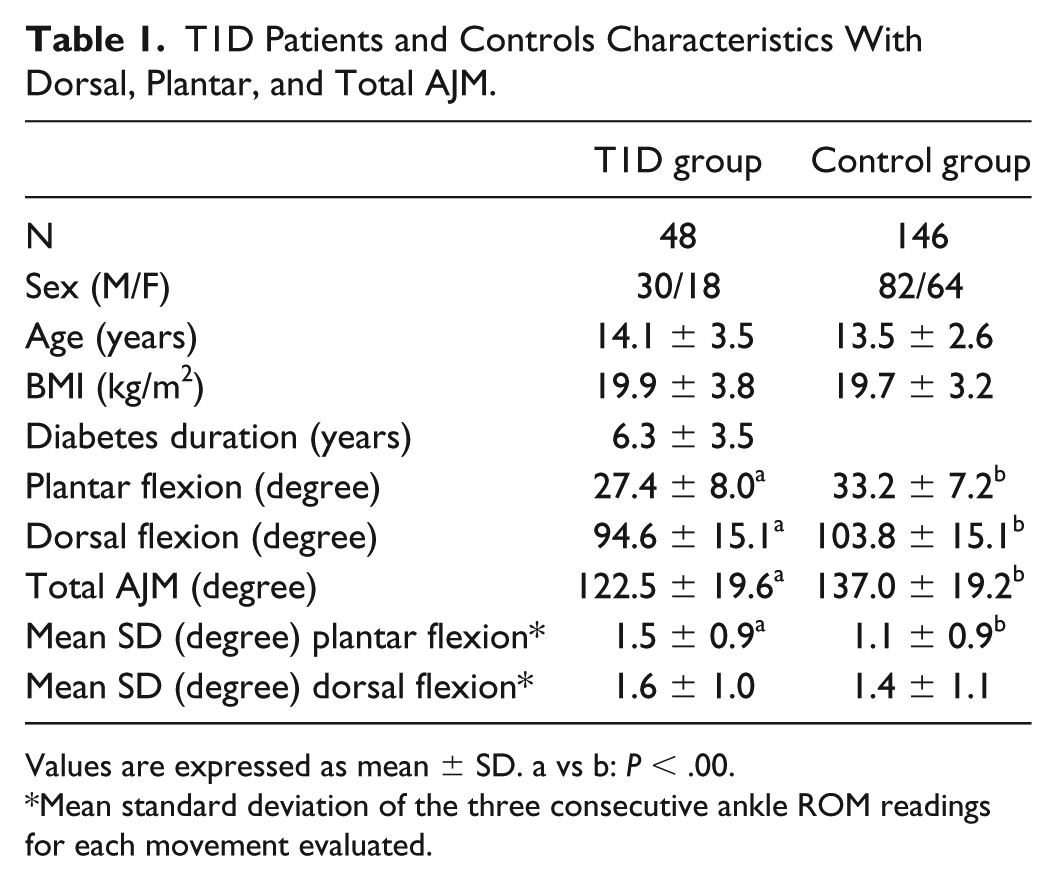
Values are expressed as mean
Mean standard deviation of the three consecutive ankle ROM readings for each movement evaluated.
All participants and parents (or caregivers) of the young subjects were informed on the study’s purpose and its experimental procedures before collecting the written informed consent for the enrollment in the study. The protocol and the consent forms were approved by the Pediatrics Ethics Committee of Meyer Children’s Hospital in Florence (protocol numbers 161/2016 on 29/09/2016). The study was performed in accordance with the Helsinki Declaration.
Determination of Ankle Joint Mobility
Ankle ROM was evaluated with the patient lying supine, with the foot in the position it naturally takes on the sagittal plane with the subtalar joint in neutral position and the feet extending over the edge of the hospital bed. The knee, corresponding to the evaluated ankle, was extended and positioned over a rigid support, 5 cm high. 31
The peak of plantar and dorsiflexion ROM was determined after marking the fifth metatarsal bone with a dermographic pen and positioning the inclinometer along the diaphysis of the bone, with one extremity positioned on the distal condyle. All measurements were performed by the same observer, who recorded the mean of three consecutive ROM readings.13,19
Model Formulation
In this study the impaired metabolic control was identified with supernormal HbA1c concentrations. Its contribution to the progressive reduction of ankle ROM in T1D subjects was assumed to be linear and time-invariant. This hypothesis allowed the pathophysiological mechanisms to be completely modeled by an impulse response function, thus limiting the number of free parameters to be identified and improving the estimation accuracy.
As performed in a preliminary study,21,32 the analytic expression selected for this study implies some latency before the impaired metabolic control leads to a reduction in ankle mobility, moreover based on the assumption that the original mobility may be fully recovered if the glycemic control is reestablished and maintained for sufficient time, in accordance with the current knowledge on the progression of LJM in DM. Specifically, we adopted a biexponential impulse response

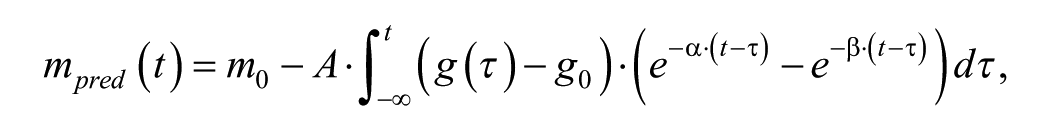
where
Model Identification: Genetic Algorithm
A genetic algorithm was applied to identify the vector of model parameters corresponding to the optimal agreement between ankle ROM measurements and model-based mobility predictions. The general concept underlying this technique originates from the process which drives biological evolution: 33 from a randomly initialized population, the algorithm selects the best candidate solutions as parents on the basis of their fitness, a function representing the quality of the solution; parents then seed the future generation either by recombination with other selected candidates (cross-over) or through unary random changes (mutation); this selection/variation mechanism is reiterated over successive generations making the population of solutions globally evolve toward higher fitness levels, thus converging to the optimal model.
In this study, the fitness objective function

where
In our implementation, the genetic algorithm operated on a population of 200 parameter vectors. At each iteration, 60% of the next generation was generated by scattered cross-over, that is, the offspring was variated by randomly selecting the elements from two parent solutions; 39% was produced via mutation, by randomly altering individual vectors, whereas the remaining best 1% (ie, 2 individuals) was directly propagated to the next generation as elite candidates. To prevent the algorithm from being quickly trapped into local minima of the fitness function, a tournament strategy was applied for parent selection, picking the fittest individual among 4 players (ie, 2% of the population size) chosen at random from the entire population.
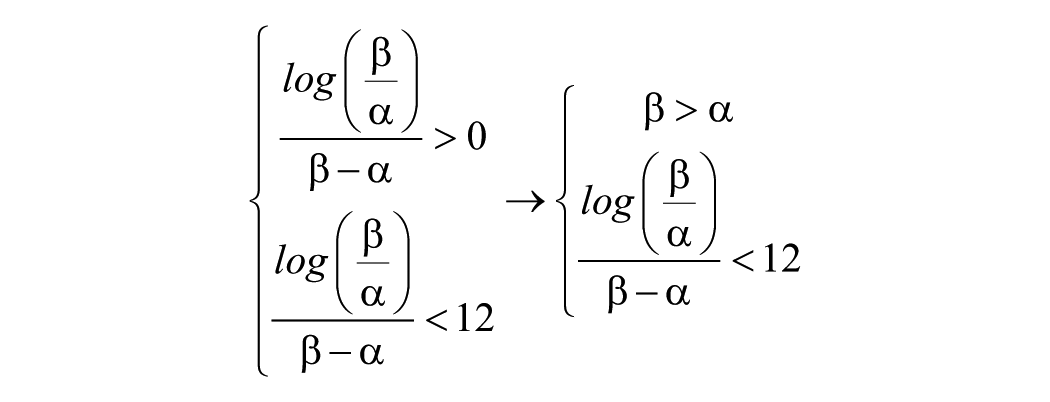
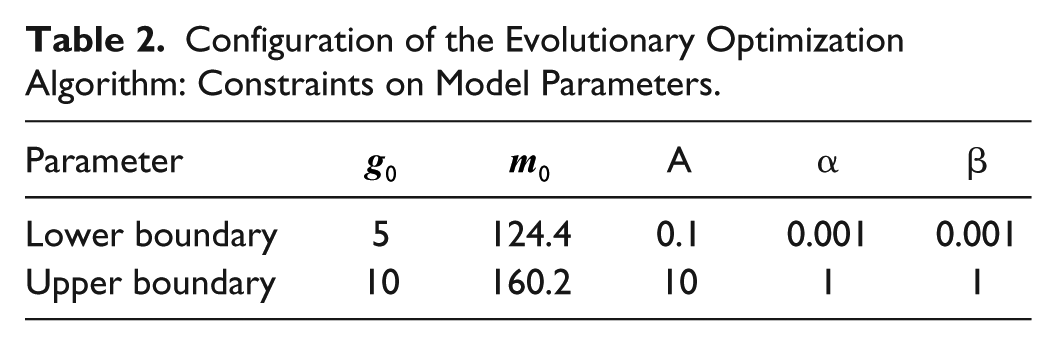
The model parameters were carefully constrained so as to improve the stability and the convergence time of the algorithm; lower and upper boundaries are reported in Table 2. Furthermore, the impulse response was fixed to exhibit a maximum within a 12-month time interval. Since

the following relations must hold:
Configuration of the Evolutionary Optimization Algorithm: Constraints on Model Parameters.
Statistical Analysis
Subject data are reported as the mean ± standard deviation (SD) or percentage, as appropriate. ROM values are expressed in degree and reported as the mean ± SD. Comparisons between groups were performed by ANOVA, using the Bonferroni correction for multiple comparisons. Frequencies were compared using the chi-square method. Multiple regression analysis was carried out using the AJM as dependent variable and all variables that appeared to be significantly correlated with joint mobility as confounding factors for univariate analysis. A two-tailed P value less than .05 was regarded as statistically significant. All calculations were performed using the SPSS system for Windows Version 25.0 (SPSS Inc, Chicago, IL, USA).
Results
AJM in both plantar and dorsal flexion was significantly lower in patients than in controls (p<0.001), with an average of 10.6% AJM reduction in T1D patients (Table 1). We did not find a significant correlation between AJM and sex, BMI or age in both T1D and the control group.
The standard deviation of the three consecutive ankle dorsiflexion ROM readings is not different between the compared groups, while the plantar flexion showed a higher SD in T1D patients (P < .001; Table 1).
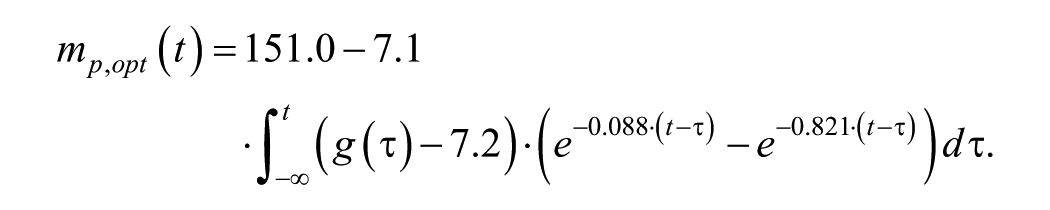
The solution of the constrained optimization problem,

which corresponds to the impulse response showed in Figure 1, and to an overall model of ankle ROM reduction by impaired metabolic control given by:
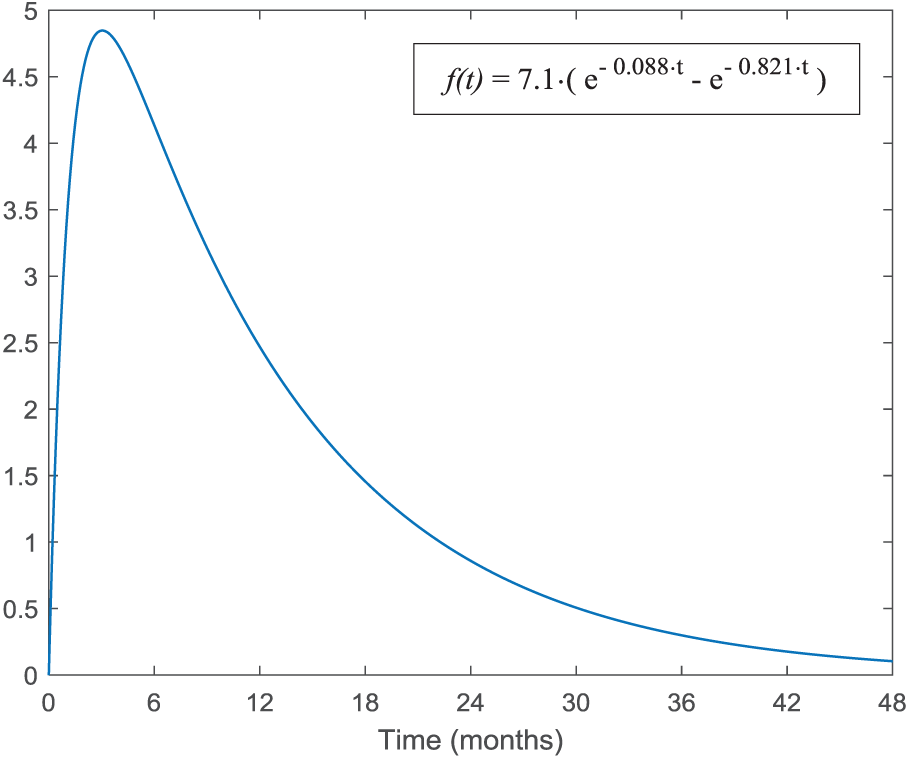
The impulse response identified by the genetic optimization algorithm.
Figure 2 displays the scatter plot between ankle ROM measurements and corresponding model-predicted values. After the removal of 2-sigma outliers (ie, 3 elements out of 48), the model error exhibits a mean value of 2.2° and a standard deviation of 26.9°; besides, the resulting Spearman’s correlation coefficient is 0.328, associated with a regression line having a slope of 0.706.
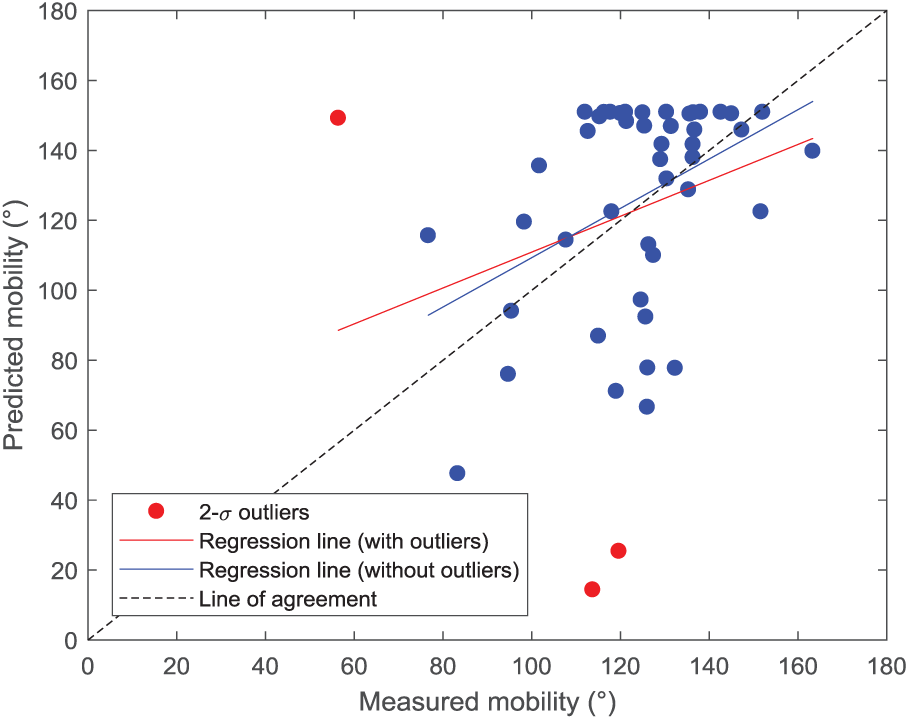
Scatter plot between total AJM measurements and corresponding model-based predictions. Outlier cases are shown in red.
Discussion
Diabetes affects the skin and periarticular structures with clinical effects through mechanisms directly correlated to the altered glucose metabolism.5,7,11,22 The study of these effects on young subjects with T1D by AJM assessment is considered worthy of investigation for its usefulness in monitoring a number of the most ominous chronic complications such as microvascular ones,5-7,12,17 and for its possible long-term effects on the anatomical and functional condition of the foot and lower limb (tissues, movement and posture quality).14,15,24,25,29
The assessment of HbA1c levels is commonly held in diabetes clinical practice to evaluate the metabolic control maintained by the patient.
The direct measure of the level of glycosylated hemoglobin in red blood cells linked to the glycemic control over the previous 3 months is affected by the red blood cells turnover.34,35 This measurement, however, does not offer a direct means of assessment of the effects of a reduced glycemic control on other tissues, such as the connective tissue, in which collagen is exposed over the long term to diabetes-induced glycemic fluctuations.11,36
In the connective tissue the main mechanical properties are determined by the collagen protein that is subjected to a turnover process which lasts many years.5,7,11 Therefore, in this perspective, the definition of a mathematical model that is able to describe the relationship between glycemic control, as assessed by HbA1c concentrations, and the effects of diabetes on connective periarticular tissue, and hence on AJM, is worthy of attention.
The proposed single input/single output model was assumed to be linear and time invariant, and was thus represented through an impulse response function, which directly links diabetes-related LJM with past supernormal concentrations of HbA1c. Model identification was performed with HbA1c and ankle ROM data obtained from a sample population of T1D subjects, applying a nonlinear evolutionary optimization algorithm.
The single AJM predictions present a large error, indicating that the proposed linear, time-invariant, single input model could not fully represent the complexity of the underlying physiological system. Nevertheless, the estimated impulse response represents the optimal description of the relation between lack of metabolic control and ROM, in that the solution
This outcome, which resulted from the analysis of a larger sample size, partially amends that reported in previous studies, where the period indicated as significant to define the ankle ROM was 12 months.21,32,37
Conversely, the proposed model is characterized by a prolonged decay phase, representing a slower AJM recovery time even after ideal metabolic control is reestablished. These features are in accordance with the expected pathophysiology and the underlying slow turnover times of collagen.5,7,11 It is also interesting to note that the resulting model suggests that HbA1c concentration levels above 7.2% are sufficient to produce a reduction of ankle ROM.
Conclusion
In summary, this study highlights how T1D is associated with a significant reduction of AJM in young subjects and how, based on the linear data model hereby proposed, the lack of glycemic control over time affects joint mobility. This result also suggests that HbA1c levels may serve as a relevant prognostic factor for assessing the progression of LJM in subjects with diabetes.
Footnotes
Acknowledgements
The authors thank Dr Mary Colonnelli for revising the English content.
Abbreviations
AGEs, advanced glycation end products; AJM, ankle joint mobility; BMI, body mass index; HbA1c, glycosylated hemoglobin; LJM, limited joint mobility; ROM, range of motion; T1D, type 1 diabetes mellitus.
Declaration of Conflicting Interests
The author(s) declared no potential conflicts of interest with respect to the research, authorship, and/or publication of this article.
Funding
The author(s) received no financial support for the research, authorship, and/or publication of this article.