
Abstract
Aims:
We investigated a point of admission metric of glycemia, the Admission Glucose Number (AGN), and its relationship with both high risk inpatient glucose patterns and mortality in hospital inpatients with type 2 diabetes (T2DM).
Methods:
Inpatient capillary blood glucose (CBG) data for patients with T2DM in our health board were identified for a 5-year period and associated with most recent preadmission HbA1c. AGN was calculated as first CBG measured during admission (mmol/L), subtracted from most recent preadmission HbA1c (converted to estimated median glucose mmol/l) within 15 months preadmission. The association between AGN and CBG variability (interquartile range), hypoglycemia free survival (HR) and both inpatient and 100-day mortality (HR) were investigated.
Results:
A total of 21 045 first admissions with available HbA1c data were identified. A positive correlation between AGN and glycemic variability was described (partial correlation coefficient 0.25, P < .001), which was stronger than the correlation of either of AGNs’ individual components: adjusted CBG1 = 0.07 (P < .001), eAG = 0.08 (P < .001). The hazard ratio for time to first recorded CBG < 3 mmol/L for high AGN versus low AGN was 1.74 (95% CI 1.55-1.96), P < .001. A high AGN was associated with increased 100-day mortality (HR 1.26, P = .005), however not with in-hospital mortality (HR = 1.31, P = .08).
Conclusion:
AGN is a simple metric that combines 2 readily available measures associated with adverse outcome in T2DM. AGN may be a useful tool to stratify patients for risk of hypoglycemia and postdischarge death.
What’s New?
AGN is a simple to calculate metric which combines HbA1c and admission glucose.
Our data show that AGN has a positive association with glycemic variability that is stronger than for individual components.
We demonstrate that individuals with a high AGN are at increased risk of hypoglycemia and have a higher 100-day mortality
Unlike previous studies we have not demonstrated an association between AGN and increased in-patient mortality, likely due to our large heterogeneous patient population, representative of T2DM admitted to hospital
AGN could be a useful tool for risk stratification and identification of those at risk of suboptimal glycemic control on admission to hospital
Introduction
Diabetes mellitus is a common condition which is increasing in prevalence with an estimated growth to 366 million diagnoses worldwide by 2030. 1 Patients with diabetes mellitus are overrepresented within hospital, accounting for up to 25% of an inpatient population despite accounting for only 5-8% of the general population. 2 While admission to hospital in this patient population may be due to complications of glycemic control, it is often for other medical or surgical conditions. To ensure holistic patient management it is important to consider not only the management of the acute pathology leading to admission, but also the management of preexisting diabetes.
Both inpatient and long-term mortality and length of hospital stay have been unequivocally demonstrated to be increased in patients with diabetes.2-5 This may be partially attributed to suboptimal management of underlying diabetes. 2 Glycemic control can be destabilized by intercurrent illness itself, making the achievement of optimal glycemia even more challenging in the inpatient setting. 4 While hyperglycemia is likely to play a major role in the poor outcomes seen in hospitalized patients with diabetes, there is increasing recognition that iatrogenic hypoglycemia may also be an important factor.3,4,6 Hypoglycemia triggers activation of counterregulatory hormonal systems and is associated with multiple negative effects, including cardiovascular events and death.7-11 More recently, there has been a recognition that fluctuations in glucose are also important over and above low and high absolute levels, with increasing evidence to suggest that high glycemic variability is associated with negative outcomes.5,12
The existence of an increased risk of poor outcome in patient with diabetes who are in hospital, and the knowledge that there are patterns of glucose that seem to be associated with harm, suggests the potential for at least some of the excess risk being modifiable. It would therefore be of potential benefit to be able to stratify patients on presentation to hospital for their risk of glucose characteristics associated with poor outcome. This would allow the targeting of enhanced monitoring and specialist advice focused on patients considered most likely to have hyperglycemia, hypoglycemia, high variability and less favorable outcomes.
HbA1c is a measurement of medium term glucose and is a mainstay of routine management of diabetes. A reduction of HbA1c has been shown to improve complications and mortality in both T1DM and T2DM.13,14 The measurement of HbA1c is recommended in all patient with diabetes and locally has been measured in over 90% of all patient with diabetes in the preceding 15 months.15,16 Capillary blood glucose (CBG) monitoring is a ubiquitous and simple near patient test that is recommended as a mandatory part of the assessment of all admissions with diabetes. 17 It is likely that both these measures will be available at presentation in a large proportion of hospital admissions.
Admission Glucose Number (AGN) is an easy to calculate metric which combines both these readily available glycemic measurements. This describes the distance of initial glucose, at time of admission, from average glucose values for an individual and may be considered a marker of metabolic stress. This has the potential ability to assist in risk stratification, allowing the identification of individuals who have marked changes in their glycemic control from baseline that would not be detected through evaluation of either of these metrics in isolation.
We wished to investigate the relationship between AGN and incidence of both high risk inpatient glucose patterns and mortality.
Methods
Inpatient CBG data for patients with Type 2 Diabetes were identified for a 5-year period within our health board. Mean, standard deviation and coefficient of variation of glucose were generated from CBG data for each admission episode. Duration of admission was calculated using CBG data—any gap of greater than 5 days between CBG measures was taken as representing a discharge with subsequent readmission. Admission duration, described as length of stay (LOS) in days, was calculated as the time between first and last CBG values per admission. HbA1c values for each individual were identified. For each admission, all HbA1c values in a window of 15 months preadmission were examined and the most recent value was used as a measure of usual glycemic control for the individual. This final HbA1c prior to admission was converted from an HbA1c (mmol/mol) to an estimated average glucose (eAG) (mmol/l). Only the first admission within the dataset of duration greater than 1 day for which an HbA1c measurement was present within the preceding 15 months was analyzed. The first recorded CBG of each admission was identified (CBG 1 ), and the AGN was calculated by subtracting CBG 1 from the eAG.
Glucose Variability During Admission
The association between CBG, 1 eAG, AGN, and CBG CV during admission was explored. For those parameters with a U-shaped association, an adjusted value was generated by taking the distance of each observed value from the nadir value of U-shaped association with CBG CV, transforming this U-shaped association to a linear association for subsequent analysis. The partial correlation coefficient for each parameter (adjusted if necessary) and the CV of the subsequent admission, adjusted for number of CBG measures during the admission, was calculated using Spearman rank-order correlation.
Time to First Hypoglycemic Event
A categorical metric was derived from the adjusted AGN, classifying as high if the value was above the median adjusted AGN value, and low if below. Hypoglycemia-free survival was investigated in both these groups postadmission, defining hypoglycemia as both <4 mmol/l and <3 mmol/l. The at-risk population in both analyses was taken as admissions where CBG1 (used to calculate AGN) was above the hypoglycemic threshold of interest. A survival analysis, with hazard ratio (HR) calculated using the cox proportional hazard model was performed, with the addition of a time interaction covariable in order that the analysis fulfilled the proportional hazards assumption. Age was taken as a covariable in this analysis.
Mortality
Using the same categorical metric as above, time to in-hospital mortality was investigated, for admissions up to 30 days in duration. An in-hospital death was defined as one occurring within 5 days of the last measured CBG value, consistent with the above method for defining admission episodes. Additionally, survival postdischarge was investigated to 100 days. Survival analysis, with HR calculated using the cox proportional hazard model, was performed. A test of the proportional hazards assumption was made.
Results
A total of 21 045 first admissions of >1 day with available HbA1c data were identified. Median (IQR) AGN for the total group was 2.2 (1.0-4.1). Characteristics are shown in Table 1.
Characteristics of Admissions and of Those Classified by Initial AGN.
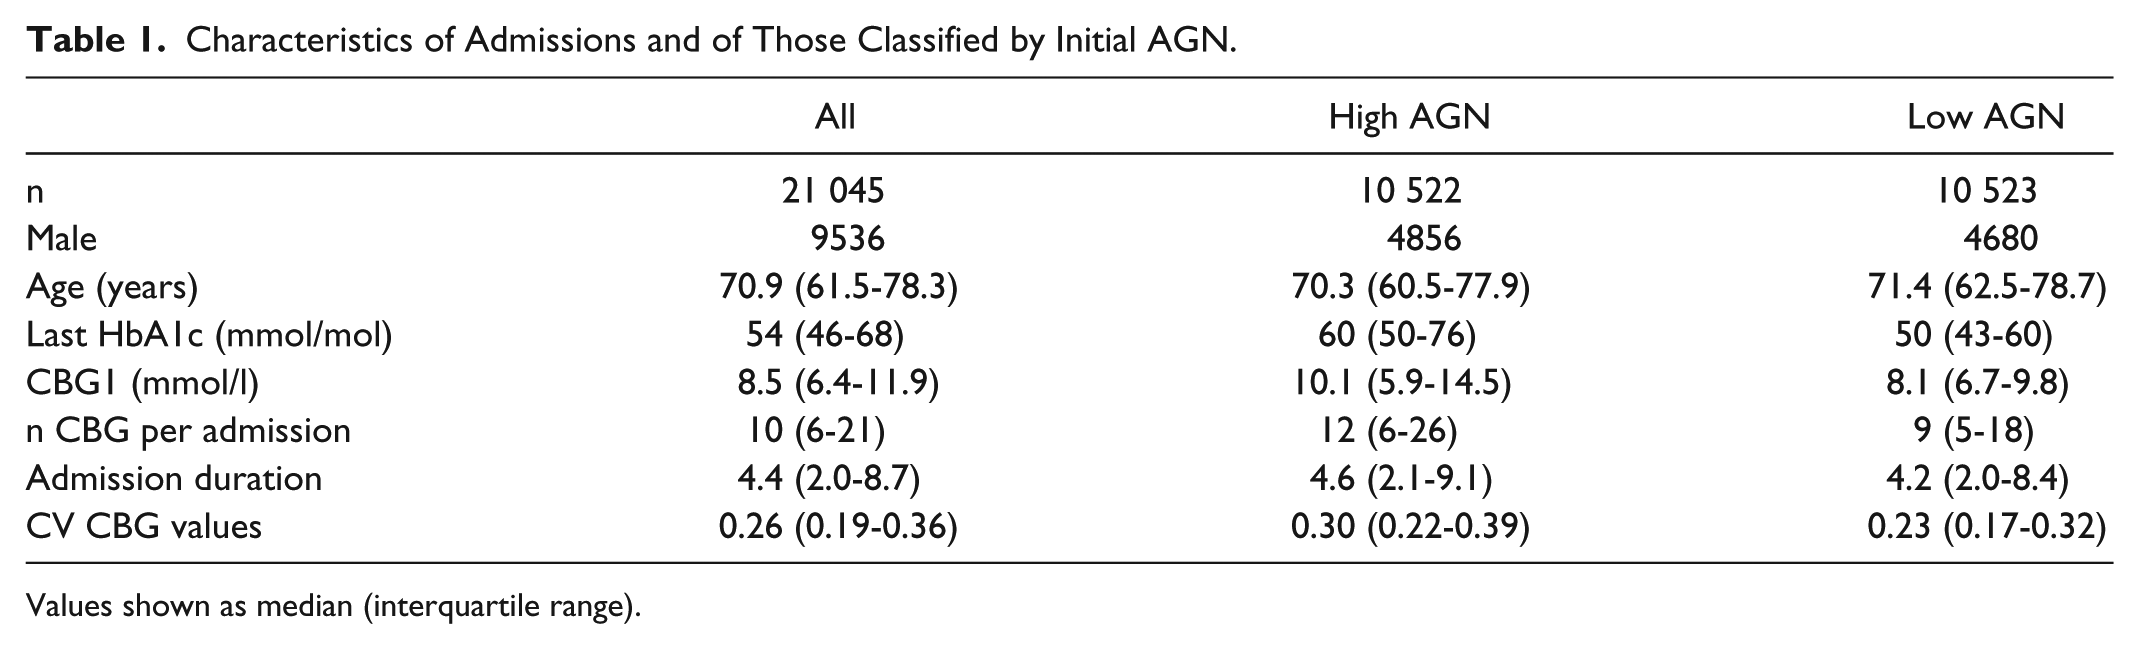
Values shown as median (interquartile range).
Association With Variability
The nadir CBG1 value was 5 mmol/l (when plotted against inpatient CBG CV), and the CBG measure used for calculation was adjusted to represent distance from this value. The nadir value for AGN was 0 (again when plotted against inpatient CBG CV). Figure 1 shows the correlation between adjusted CBG1, eAG and adjusted AGN and glycemic variability (CV) during the subsequent admission. Partial correlation coefficients (adjusted for number of CBG measurements during admission) were adjusted CBG1 0.07 (P < .001), eAG 0.08 (P < .001), adjusted AGN 0.25 (P < .001).
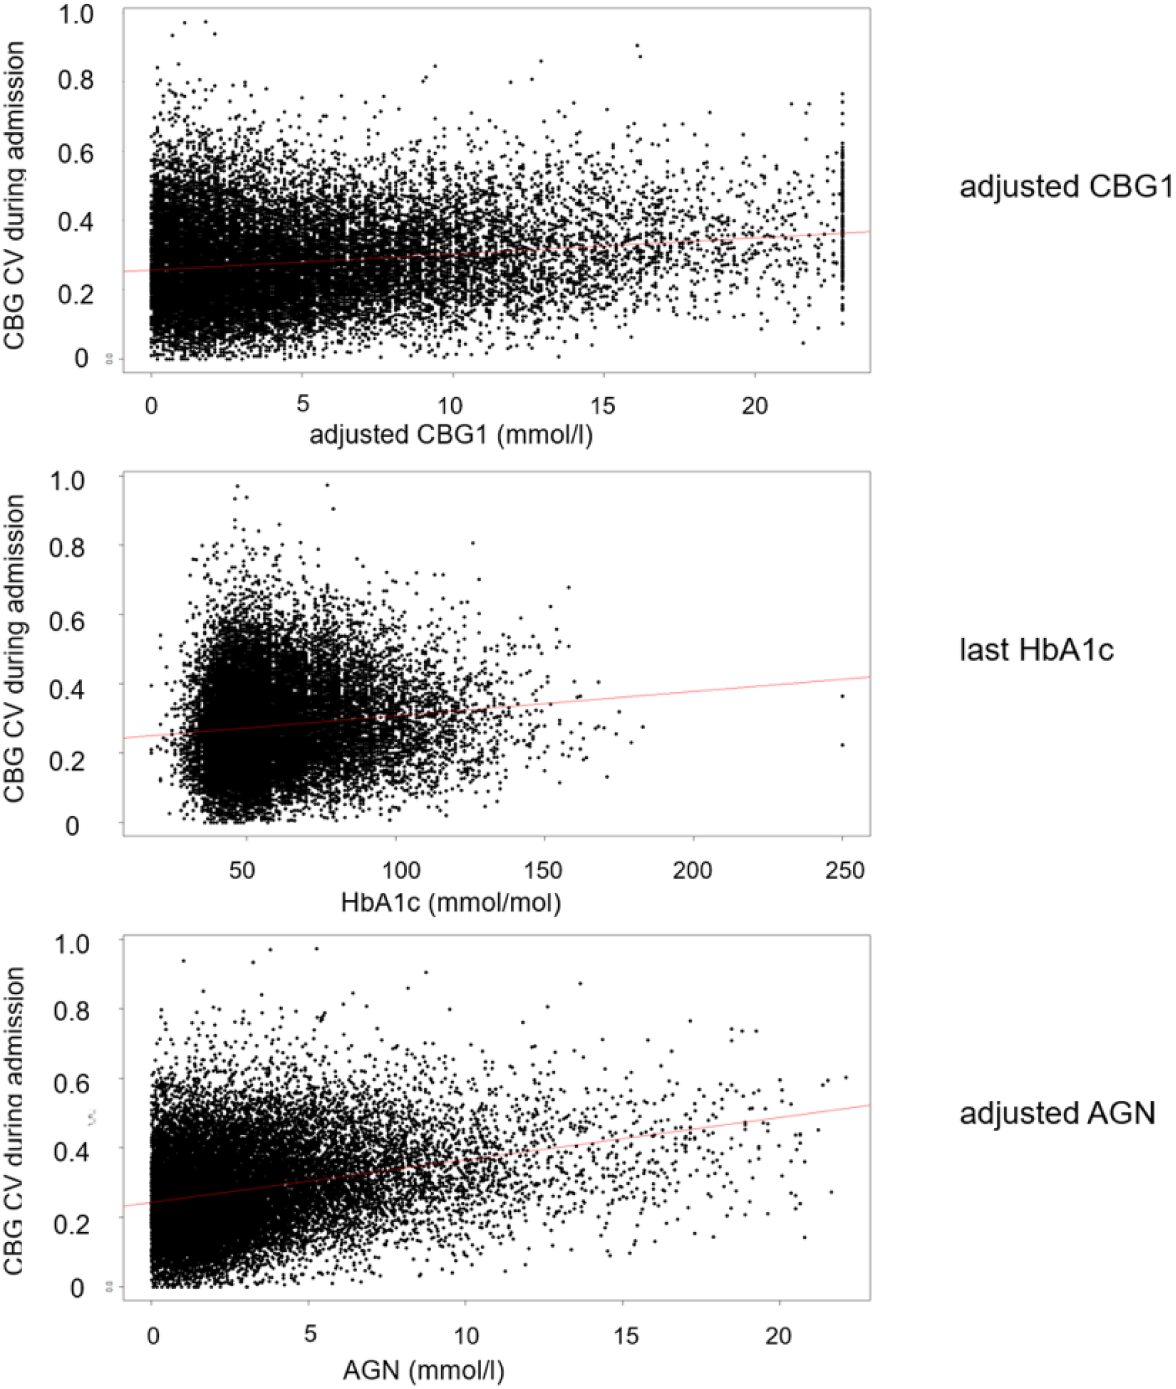
Correlation between parameters of interest and glycemic CV during subsequent admission.
Time to Hypoglycemia (Figure 2)
Survival analysis to first recorded CBG <4 mmol/l. A total of 16 371 individuals were included in the analysis. HR for high AGN vs low AGN 1.41 (95% CI 1.31-1.52), P < .001. P value for global test of proportional hazards assumption .40.
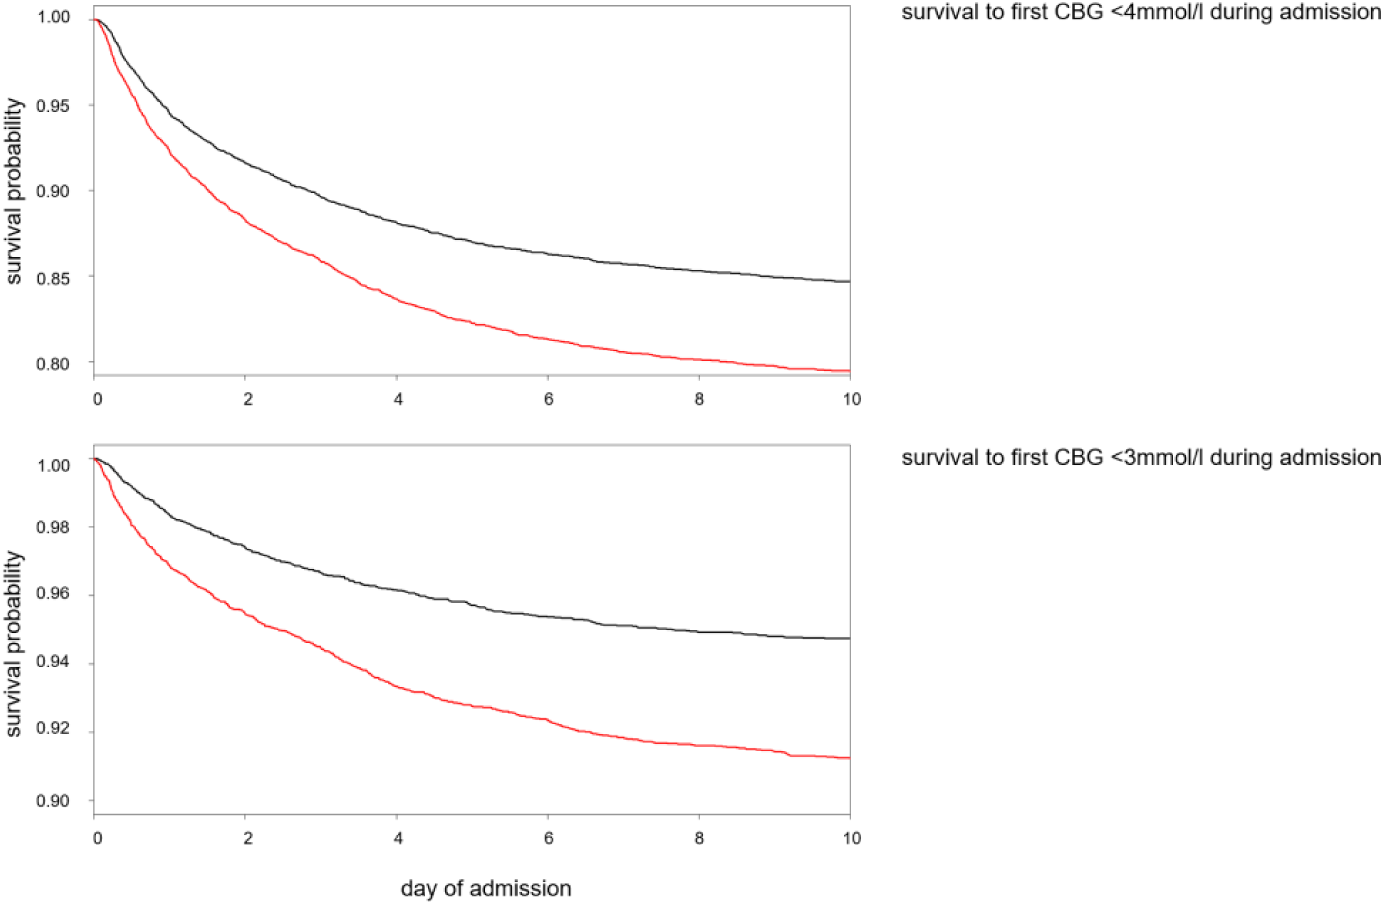
Survival analysis to first hypoglycemic CBG measurement during admission. (Top) Survival to first CBG <4 mmol/l during admission (maximum admission duration 10 days). n at risk 16 371. HR for high AGN vs low AGN 1.41 (95% CI 1.31-1.52), P < .001. Red—high AGN (>2.12). (Bottom) Survival to first CBG <3 mmol/l during admission (maximum admission duration 10 days). n at risk 16 725. HR for high AGN vs low AGN 1.74 (95% CI 1.55-1.96), P < .001. Red—high AGN (>2.17).
Survival analysis to first recorded CBG <3 mmol/l. A total of 16 725 individuals were included in the analysis. HR for high AGN vs low AGN 1.74 (95% CI 1.55-1.96), P < .001. P value for global test of proportional hazards assumption .36
Time to Death (Figure 3)
Survival analysis to in-hospital death. HR for high AGN 1.31 (0.97-1.78), P = .08. Proportional hazard assumption fulfilled, p-value for global test 0.9. Survival analysis from discharge to 100 days postdischarge. HR for high AGN vs low AGN 1.26 (1.07-1.47), P = .005. Proportional hazard assumption fulfilled, P value for global test .3.
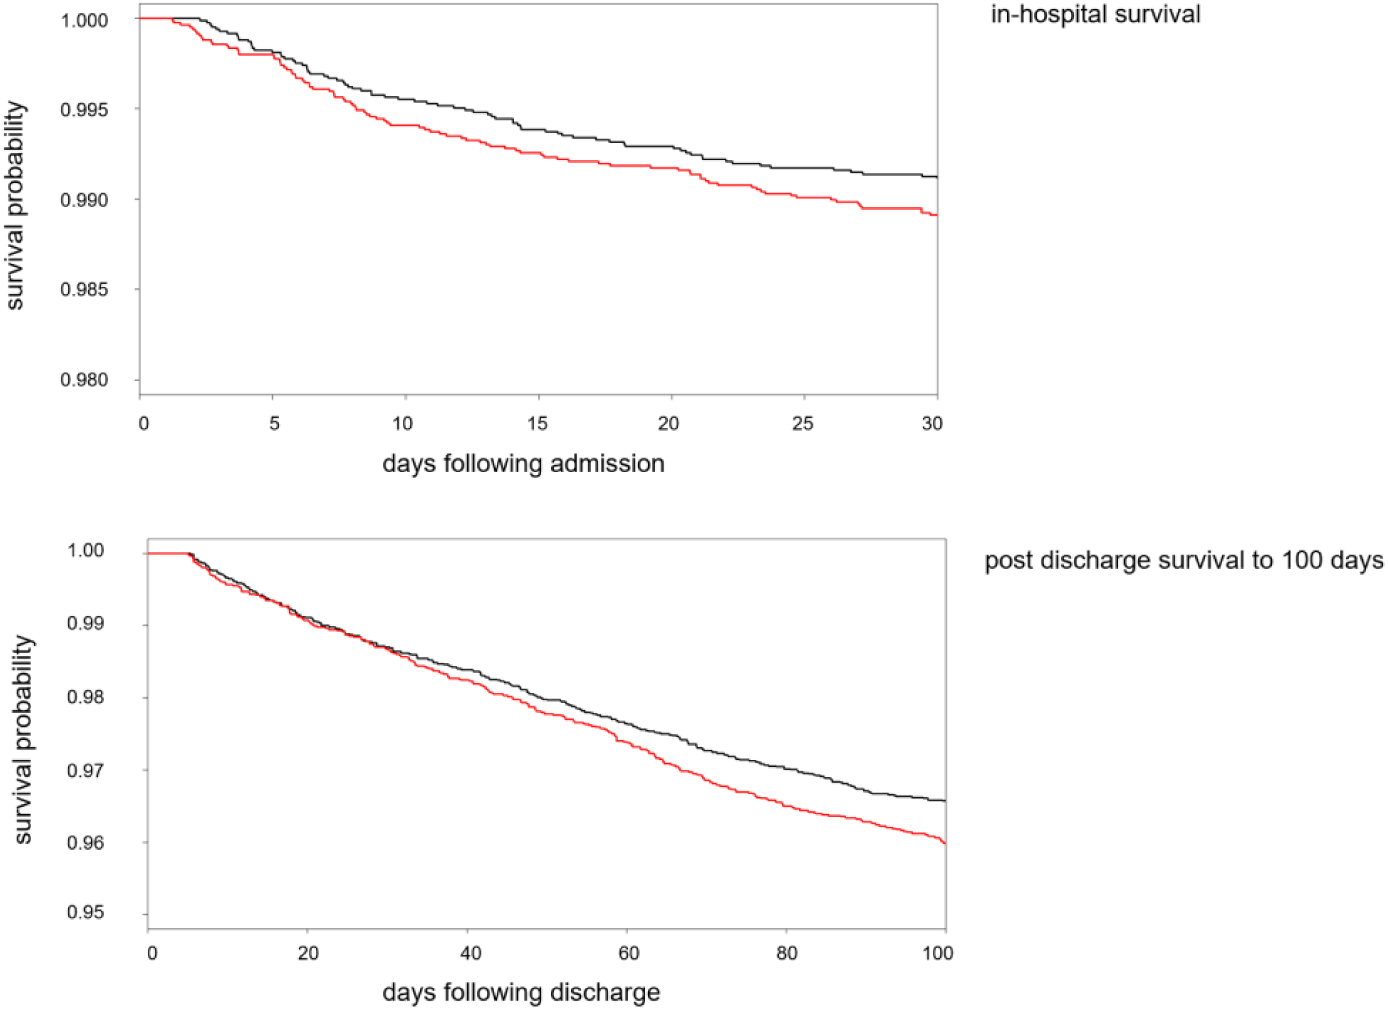
Survival in hospital and to 100 days postdischarge. (Top) In-hospital survival. n at risk 16 934. HR for high AGN 1.31 (0.97-1.78), P = .08. Red—high AGN (>2.2). (Bottom) Postdischarge survival to 100 days. n at risk 16 629. HR for high AGN vs low AGN 1.26 (1.07-1.47), P = .005. Red—high AGN (>2.198).
Conclusion
Diabetes is a common and important comorbidity in patients who attend hospital with recent data from England and Wales showing that 18% of all patients in hospital have diabetes. 18 Identification of individuals at risk of suboptimal glycemic control during admission is therefore potentially important for reducing morbidity and mortality, as well as reducing health care costs.
High glucose variability has been shown to be associated with increased mortality in patients in hospital with T2DM. 5 Several in vitro studies and animal model studies have shown adverse impact of glucose fluctuations. 19 Repeated glucose fluctuations have been linked to inflammatory cytokines, endothelial dysfunction and markers of oxidative stress. 20 Importantly, the potential harms of glucose fluctuations in humans seems to be confirmed by clinical studies.21,22 Hypoglycemia, and in particular severe hypoglycemia, has also been shown to be predicted by high glucose variability.19,23 We have described a positive correlation between AGN and glycemic variability. AGN could be therefore used as a tool for risk stratification by allowing the identification of individuals who are prone to large glucose fluctuations. This relationship is stronger for AGN than for either of its individuals components, CBG1 or previous HbA1c, suggesting that it would be a superior predictive marker at time of admission. As glycemic variability is known to be predictive of hypoglycemia and mortality, AGN will potentially be a superior predictor of these outcomes than either of its individual components.
Among patients with diabetes treated with insulin or sulphonylurea hypoglycemia is common and may be an important barrier to optimal glycemic control.3,24 The UK National Diabetes Inpatient Audit demonstrated that in England and Wales 18.5% of inpatients with diabetes experience at least 1 episode of mild biochemical hypoglycemia (>3.0 to <4.0 mmol/l)l with 7.0% having severe biochemical hypoglycemia (<3.0 mmol/l) while an inpatient. 18 We have previously shown that 26.2% of all admissions in patients with diabetes within our own population were associated with hypoglycemia. 25 In hospital hypoglycemia is clearly associated with adverse patient outcomes such as increased length of stay and long term mortality.3,6,24,26,27
We have shown that individuals with a high AGN are at increased risk of hypoglycemia, when compared to those with a low AGN. This relationship is stronger when using a hypoglycemic threshold of <3 mmol/mol, suggesting that AGN is more discriminative at detecting those at risk of
severe biochemical hypoglycemia. High AGN values can therefore be used for the prediction of individuals likely to experience hypoglycemia as an inpatient, indicating further utility in risk stratification. The clinical importance married to suboptimal treatment of inpatient hypoglycemia makes it an obvious target for approaches that are able to identify those at risk of hypoglycemia. This would allow more intensive monitoring, placement of patients in more diabetes aware clinical settings, and proactive input from specialist teams.
The difference between admission glucose and HbA1c-derived average glucose has previously been termed the glycemic gap, and has been investigated in specific groups of individuals with diabetes.28-31 We have chosen not to adopt the term glycemic gap, preferring AGN instead to avoid any potential confusion with the previously established term, glycation gap, which describes the difference between measured HbA1c and the value predicted by regression on fructosamine. 32
Previous research has demonstrated associations between a high glycemic gap and a variety of adverse outcomes in patients with both diabetes and other pathologies, including pyogenic liver abscess, myocardial infarction and community acquired pneumonia. An elevated glycemic gap, defined as glycemic gap >4.4 mmol/L, was found to be associated with an increased risk of both ICU and hospital mortality within individuals with diabetes in ICU setting . It was also found that the incorporation of this metric into APACHE-II scoring could improve the scores’ discriminative performance for the prediction of ICU mortality. Similarly, a glycemic gap >2.3 mg/mL was found to be associated with a shorter survival in patients with acute myocardial infarction. This provides evidence that within specific subpopulations, a metric looking at the difference between admission CBG and HbA1c may be useful for risk stratification, including prediction of in-hospital mortality.
We did not find a statistically significant difference in in-hospital mortality rates between individuals with a high AGN when compared to those with a low AGN. This is likely explained by the large heterogeneous patient population examined within our study, comprising of patients with type 2 diabetes mellitus from a number of general adult hospitals. Our findings are more generalizable to the majority of patients with type 2 diabetes who are admitted to hospital, and suggest that within this larger patient group that AGN is not predictive of in hospital mortality.
A high AGN was however associated with a lower chance of postdischarge survival at 100 days in our study. This is an interesting observation which we cannot currently fully explain. It is likely that a high AGN identifies those who are acutely more unwell which is reflected in a sudden change in their glycemic control. Further work will be required to identify the etiology and pathophysiology of death in these patients. If common mechanisms are found we may be able to offer interventions aimed at reducing later mortality at time of admission or discharge, based on admission AGN number. This highlights further utility of AGN in risk stratification.
There is increasing recognition that preadmission HbA1c may be a useful predictor of both poor glycemic control and longer term outcomes in people in hospital with diabetes.33-35 We have previously reported that patients with values at the extremes of HbA1c are more likely to experience hypoglycemia. 36 We also reported that those at the extremes of HbA1c are associated with adverse outcomes of hypoglycemia. It is likely that people with lower admission HbA1c are more prone to hypoglycemia for any given variability while those with higher admission HbA1c will only experience excursions into the hypoglycemic range if accompanied by higher variability. The use of admission HbA1c alone may therefore result in over monitoring of hypoglycemia in individuals with higher HbA1c. A marker which also takes into account glycemic variability would better able us to identify those with high HbA1c who are at risk of hypoglycemia. As we have demonstrated a stronger correlation between AGN and glycemic variability, than for HbA1c, we suggest that AGN would be a superior marker for risk stratification than HbA1c alone.
High admission capillary blood glucose is a well-established indicator of longer hospital stay, readmission rates and increased mortality in all hospital inpatients.35,37-39 However, admission CBG has been shown to be more strongly linked with adverse outcome in inpatients without diabetes than inpatients with diabetes.35,38 For a given level of hyperglycemia, mortality is higher in individuals without diabetes. This excess mortality has been attributed to stress hyperglycemia although it is not clear if there is a direct impact of hyperglycemia on disease outcome or if hyperglycemia is a marker of disease severity. It would therefore make sense that a metric which takes into account the variation between normal glycemic control and admission CBG would be a better predictor of risk and adverse outcome in patients with preexisting diabetes, regardless of mechanism. A normal admission CBG may provide false reassurance that an individual is at low risk of adverse events and therefore does not require more intensive monitoring or specialist input. However if this admission CBG represents a significant deviation from preexisting poor glycemic control, then these individuals are also likely to be under metabolic stress, and also to be at increased risk of hypoglycemia. AGN is a metric which allows us to identify patients with preexisting diabetes who have had a significant deviation from their normal glycemic control upon admission to hospital. We have demonstrated that there is a relationship between this and adverse effects such as hypoglycemic rates and 100-day survival, suggesting the a greater utility of AGN over CBG.
The main strength of our study is the inclusion of a large cohort of patients from a grouping of general adult hospitals which is likely to be representative of most unselected mixed medical and surgical hospital settings. This makes our results generalizable to the predominant group of patients who are admitted with diabetes. The most recent HbA1c in the 15 months prior to admission was selected as a measure of usual glycemic control for an individual for pragmatic reasons; this is a value likely to be readily available to an acute physician and therefore makes the AGN an easily calculable number. Although most patients in our study had an HbA1c performed in the 15 months prior to admission it is possible that in other health care settings that HbA1c is less readily available. Admission CBG should also be readily available following advice from the UK National Diabetes Inpatient Audit in 2016 that CBG is performed 4 times a day for unwell patients or those with unstable diabetes. 40 It is important to acknowledge the limitation of the retrospective nature of this study with the recognition that we can only comment on associations rather than causal relationships.
In order to show the utility of AGN, or any other metric of diabetes inpatient risk, it would be helpful to assess the impact on mortality and hypoglycemia rate of intervention targeted by the risk score of interest. Prior to such evidence being available it is still pragmatically sensible to try and use information available on admission to target scarce resources such as specialist diabetes teams to the most vulnerable to harm.
Footnotes
Abbreviations
AGN, Admission Glucose Number; CBG, capillary blood glucose; eAG, estimated average glucose; HR, hazard ratio; T2DM, type 2 diabetes mellitus.
Declaration of Conflicting Interests
The author(s) declared no potential conflicts of interest with respect to the research, authorship, and/or publication of this article.
Funding
The author(s) received no financial support for the research, authorship, and/or publication of this article.