
Abstract
Background:
Electrochemical enzymatic glucose sensors are intended to measure blood or interstitial fluid glucose concentrations. One class of these glucose sensors are continuous glucose monitors (CGMs), indicated for tracking and trending of glucose concentrations in interstitial fluid and as an adjunct to blood glucose testing. Currently approved CGMs employ a glucose oxidase (GOx) electrochemical detection scheme. Potential interfering agents can impact the accuracy of results obtained by glucose sensors, including CGMs.
Methods:
Seven sugars, seven sugar alcohols, and three artificial sweeteners were in vitro screened for interference with amperometric glucose oxidase (GOx) sensors at concentrations greater than physiologic concentrations. Galactose was investigated further at physiologically relevant concentrations using a custom amperometric system. Furthermore, glucose and galactose calibration experiments were conducted to facilitate multiple enzyme kinetic analysis approaches (Michaelis-Menten and Hill equation) to understand the potential source and mechanism of interference from galactose.
Results:
Under in vitro testing, except for galactose, xylose and mannose, all screened compounds exhibited interference bias, expressed in mean absolute relative difference (MARD), of ⩽ 20% even at concentrations significantly higher than normal physiologic concentrations. Galactose exhibited, CGM-dependent, MARD of 47-72% and was subjected to further testing. The highest recorded mean relative difference (MRD) was 6.9 ± 1.3% when testing physiologically relevant galactose concentrations (0.1-10 mg/dL). Enzyme kinetic analysis provided calculations of maximum reaction rates (
Conclusion:
Under the conditions of in vitro screening, 14 of the 17 compounds did not exhibit measuarable interference. Galactose exhibited the highest interference during screening, but did not substantially interfere with CGMs under the conditions of in vitro testing at physiologically relevant concentrations. Enzyme kinetic analysis conducted with galactose supported the notion that (1) the reactivity of GOx enzyme toward nonglucose sugars and (2) the presence of enzymatic impurities (such as galactose oxidase) are two potential sources for sugar interference with GOx glucose sensors, and thus, should be considered during device development.
Keywords
Continuous glucose monitors (CGMs) are implantable medical devices which have advanced diabetes management by allowing for better glycemic control with more frequent data point collection.1,2 Commercial CGMs are indicated for the measuring of glucose concentrations in interstitial fluid (ISF) under the skin. 3 CGMs consist of three main parts: an implantable glucose sensor, a wearable transmitter and a wireless receiver/monitor. The glucose sensors in many commercially available CGM systems are comprised of electrochemical electrode systems, which contain the immobilized glucose oxidase (GOx) enzyme. GOx converts glucose to gluconic acid and hydrogen peroxide. Hydrogen peroxide in turn is oxidized by the electrode system to generate current.4-6 An algorithm in the wireless receiver and/or transmitter converts the current to a glucose concentration value that is displayed on the monitor.7,8 Figure 1 illustrates the basic enzymatic electrochemical glucose sensing scheme of a typical commercially available CGM system, including the chemical reactions involved in producing a signal.
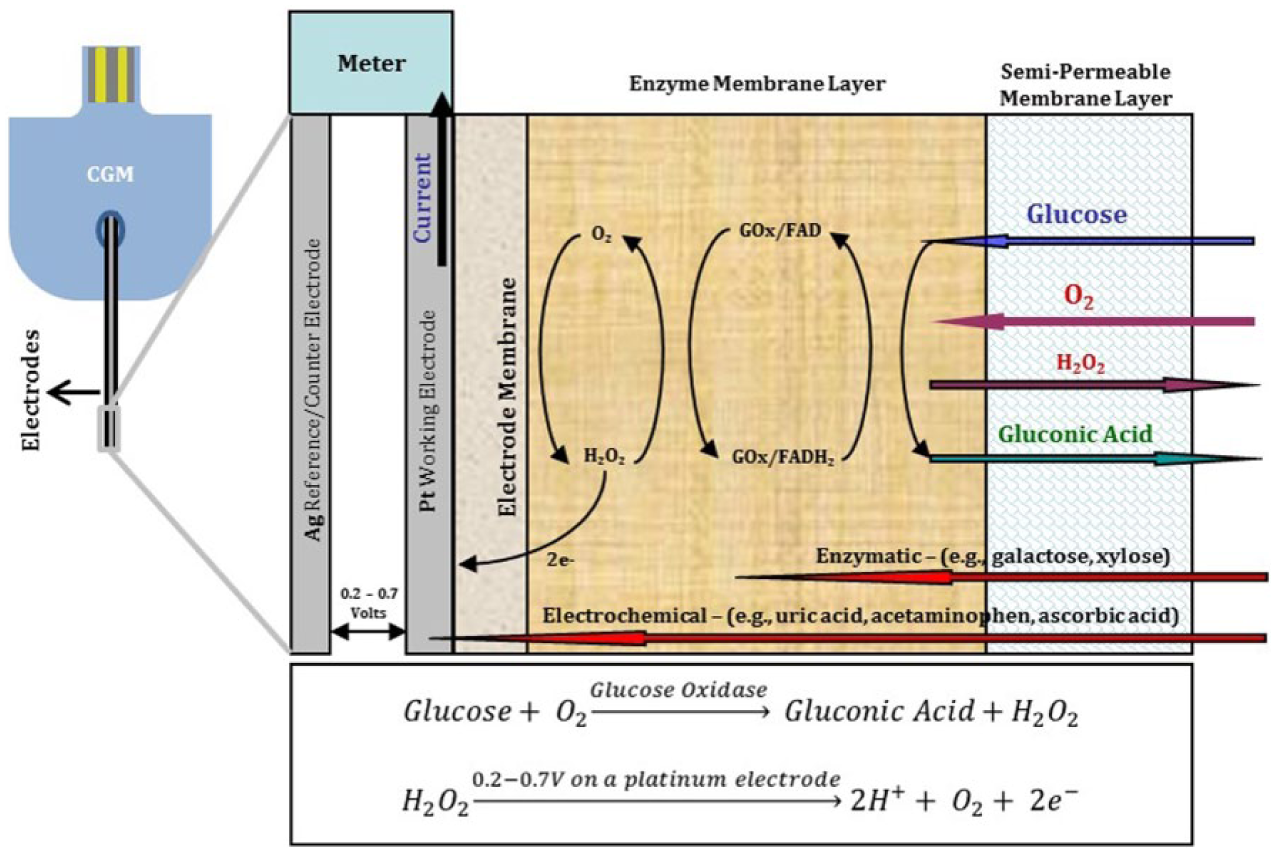
Example of enzymatic electrochemical glucose sensing element in the CGM, and the chemical reactions involved.
Electrochemical sensors based on GOx may be susceptible to two types of interferences: electrochemical and enzymatic. Electrochemical interference can be caused by the electrochemical oxidation of electroactive substances such as drugs, drug metabolites, or endogenous molecules on the working electrode of the CGM, resulting in changes in electrode current independent of glucose concentration changes.9-12 Enzymatic interferences may also result in changes in sensor signal, but occur due to either reaction of nonglucose sugars with GOx enzyme directly or with other enzyme impurities within the GOx sensing layer. Enzymatic interferences are the focus of this study, rather than electrochemical interferences.
Although the GOx enzyme is produced by a variety of different organisms, in CGM systems, the enzyme most commonly originates from the fungus Aspergillus niger. 13 Even though the A. niger GOx enzyme is highly selective for glucose, it exhibits limited reactivity toward other sugars.13-16 In addition, GOx extracted from A. niger may contain other enzyme impurities.17-19
Glucose analogues and substitutes are commonly introduced to the human body, primarily orally through diet (eg, food, supplements, drugs, artificial sweeteners), but also by non-oral pathways like intravenous administration of drugs and transdermal lotions. People with diabetes rely on glucose free substitutes like sucralose, mannitol, aspartame, and stevia, among others, to help with glycemic control. Enzymatic interferences of nonglucose sugars with blood glucose meters that use the glucose dehydrogenase enzyme have been reported, in some cases leading to serious or fatal outcomes.20-22 Given this history, it is important to understand the susceptibility of GOx-based sensors to similar interferences. The goal of this study is to evaluate the effect of nonglucose sugar interference with GOx-based sensors. Commercial CGMs were used to conduct this study, and comparative performance assessments were not the aim of the study. For this reason, the sensors used are not identified in this paper.
Materials and Methods
Interference Screening Experiments Using Commercial Continuous Glucose Monitoring Systems
Three commercially available types of CGM sensors were used to conduct this study. Sensors were inserted in a custom-made flow cell, allowed to equilibrate, and calibrated per the manufacturers’ instructions. The flow cell was filled with 1× Hank’s Balanced Salt Solution (10× HBSS, Gibco®, 14065, ThermoFisher Scientific, Waltham, MA) with 100 mg/dL glucose concentration and 350 mg/L bicarbonate, at pH 7.4 and 37°C; Solutions contained 0.1 g/L of sodium azide to prevent -microbial growth. A high-performance liquid chromatography (HPLC) pump (Waters Corp, Milford, MA) was used to run the solution through the cell at a flow rate of 1 mL/min. All chemicals were acquired from Sigma.
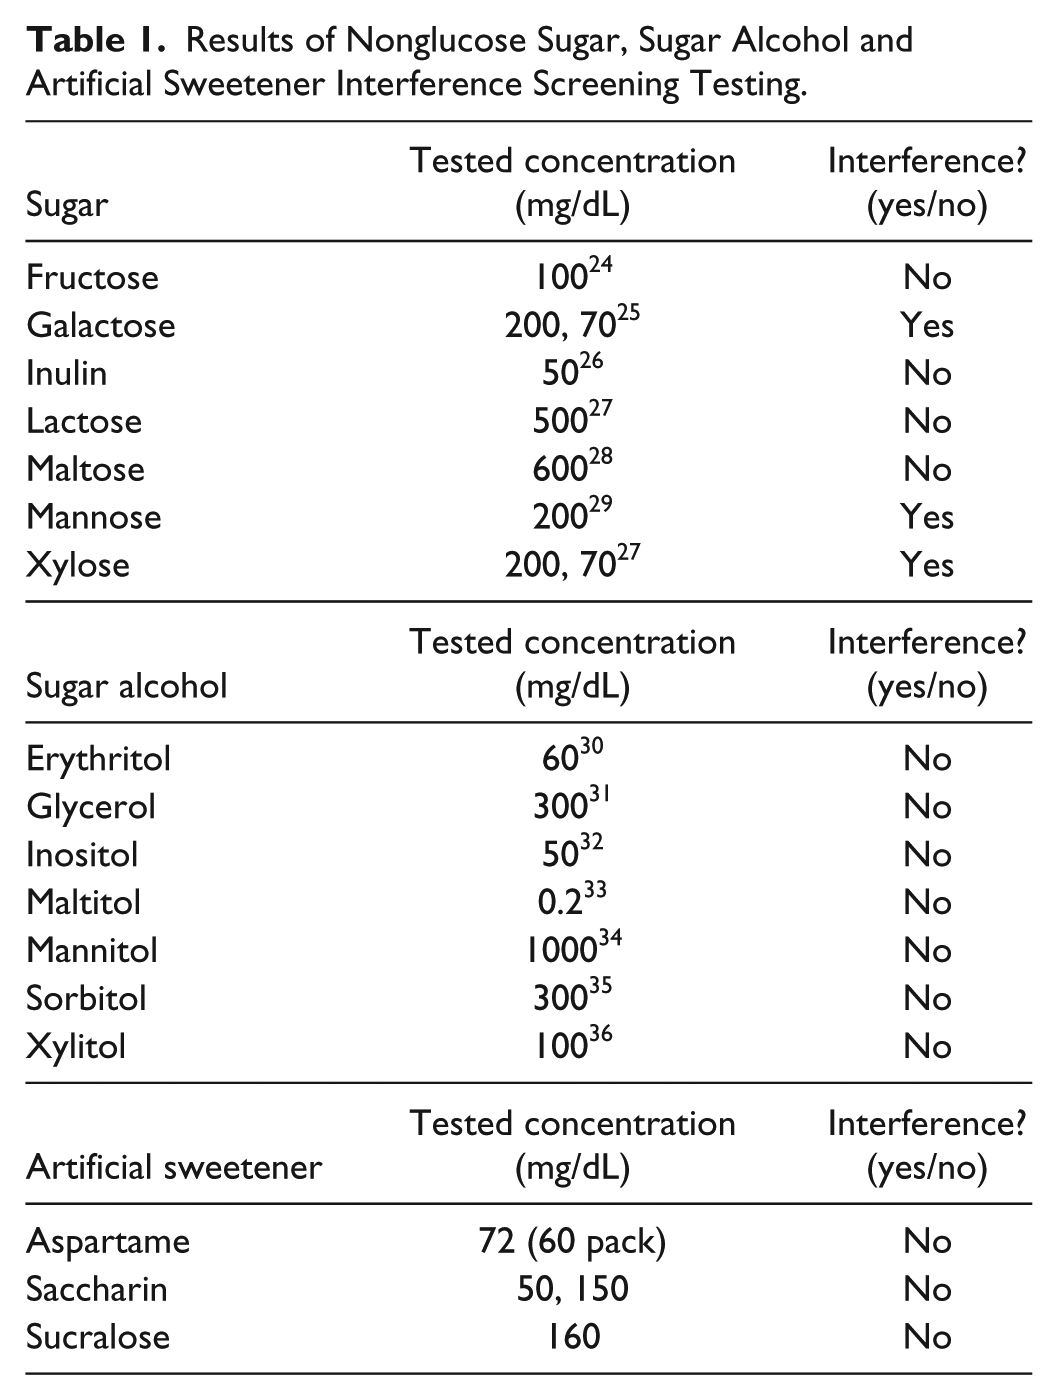
Glucose concentration readings from the CGM receiver in the presence of sugar analyte were compared to baseline readings without sugar analyte to determine interference. A total of seven nonglucose sugars, seven sugar alcohols, and three artificial sweeteners were tested (Sigma Aldrich, at least 98% purity). Given the absence of accepted clinical values for analyte concentrations in ISF, the concentrations of analytes during screening studies were chosen based on a maximum blood concentrations reported for these analytes. According to the two-compartment model that describes the relationship between plasma and interstitial glucose levels, at steady state conditions, interstitial glucose concentration generally correlates with the blood glucose, but with an associated lag time. 23 Table 1 lists nonglucose sugars tested in the initial interference screening. Each compound was screened twice.
Results of Nonglucose Sugar, Sugar Alcohol and Artificial Sweetener Interference Screening Testing.
Interference screening data were analyzed by calculating the mean absolute relative difference (MARD) between the mean baseline glucose concentration CGM reading without interferent (M0) and the mean glucose reading value with interferent present (MI) as: 37
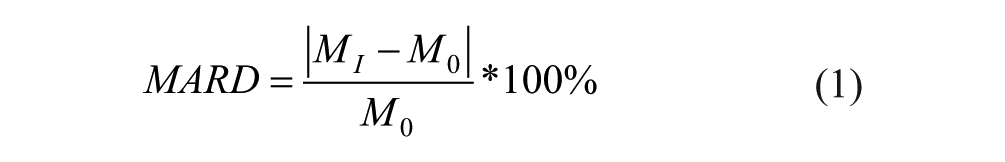
In this study, interference was defined as any change in the detected glucose concentration of more than 20% from a baseline glucose value.
Interference Testing of Galactose at Physiological Levels - via Amperometric Measurements
To test galactose at physiologic concentrations, direct acquisition of the electrical current from a CGM’s sensor was conducted while bypassing the CGM’s algorithm using the device’s built-in circuitry and a benchtop potentiostat. CGM sensors were inserted into the flow cell through a silicone gasket with a drop of silicone sealant applied at the insertion site to prevent leaks. The flow cell was filled with phosphate buffered saline (PBS) solution and the sensors were conditioned in this solution for at least three hours. Custom rapid prototyped sensor connections were fabricated to enable an interface between the sensors and a CHI1005B Electrochemical Analyzer potentiostat (CH Instruments, Inc, Bee Cave, TX). A syringe pump (Harvard Apparatus PhD Ultra) was used for fluid exchanges. Figure 2 shows the schematic of interference testing setup.
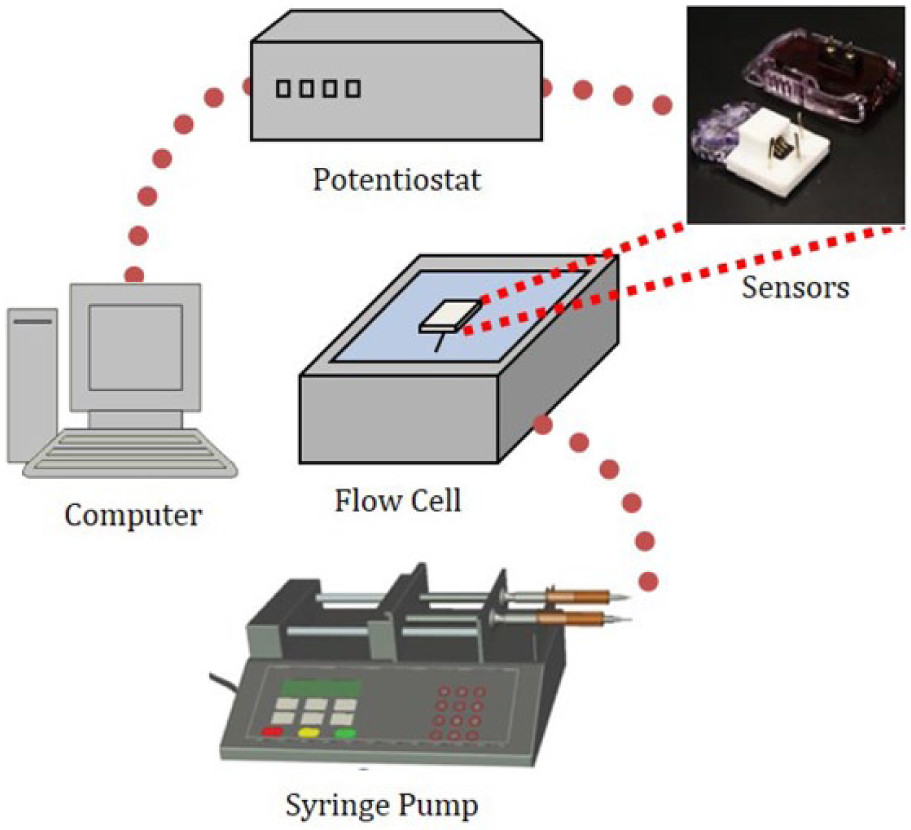
Schematics of the interference testing setup.
Interference tests were run as follows: Glucose-only solution at one of three baseline levels (70, 100, or 250 mg/dL) was infused into the flow cell and the sensors were stabilized at an applied voltage of 0.6 V for at least 40 minutes, with a data point recorded every 0.1 seconds, and a current/voltage sensitivity of 1×10⁻⁸. Some sensors required a 90-minute soak in the glucose solution prior to stabilization, while the other sensors could be stabilized immediately. Baseline current measurements were acquired. After this procedure, the flow cell was flushed with fresh glucose-only solution and again stabilized for 40 minutes. Measurements were conducted at room temperature.
After second stabilization, a glucose + galactose solution was pumped into the flow cell using a syringe containing either 2 mg/dL or 25 mg/dL galactose, for a duration sufficient to achieve galactose concentration targets of 0.1 and 1.0 mg/dL, and 5 and 10 mg/dL, respectively. Each infusion step was conducted with an infusion at 1 mL/min flowrate, 5 minutes of additional stirring, and 5 minutes of signal acquisition. Stirring in the flow cell was conducted during all steps of the process. All fluids run through the flow cell contained 0.1 g/L sodium azide to prevent microbial growth.
Analysis of Amperometric Data
The interference due to galactose was determined by calculating the percentage mean relative difference (MRD) of the current values for glucose solutions with and without interferent. The MRD due to galactose was determined as:

where i0 and ii are the mean initial current following stabilization and the mean current with interferent at each galactose infusion step, respectively. The i0 and ii values were obtained by calculating the means of the current collected in the last minute of each infusion step.
We observed decay in the measured current at each infusion step during glucose baseline measurements. Such current decay during infusion step would artificially reduce ii value and thus affect the interference value. To correct for this current decay, we chose to calculate interference as a difference in means of MRD of current values between baseline (glucose-only) and galactose-spiked solution.
The MRD for the glucose-only infusion experiments were also calculated by a modified version of equation 2, where ii is now a decayed current value,

Difference in means of MRD values with 95% confidence between baseline (glucose-only) and galactose-spiked solution were obtained with the following formulas:
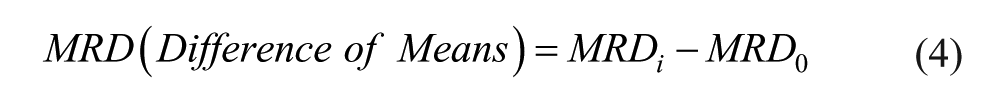
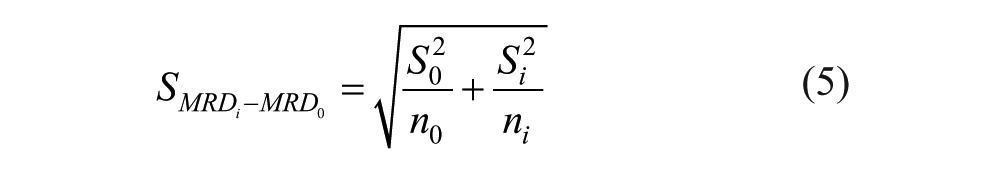
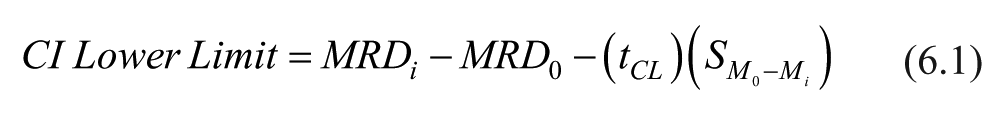
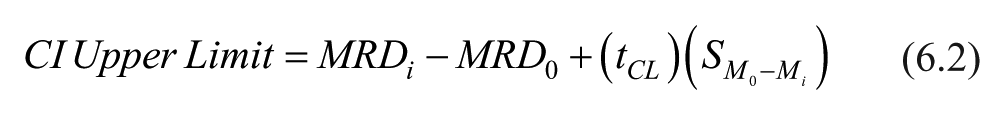
In these formulas,
Galactose Purity
Glucose impurity in the galactose sample was tested using a glucose/hexokinase assay kit (GAHK-20, Sigma Aldrich) with detection limit of 0.05 mg/dL of glucose. Testing was done as per instructions of the assay. Spectrophotometry at 340 nm (Genesys 20, ThermoScientific, Waltham, Massachusetts) was used to quantify glucose content.
Mechanism of Galactose Interference
The mechanism of galactose interference was assessed by performing interference testing and glucose and galactose calibration experiments.
Interference Testing
Interference testing of galactose at 70 mg/dL was evaluated at various concentrations of glucose (70, 100, and 250 mg/dL) using the experimental setup described in section - Interference Testing of Galactose at Physiological Levels via Amperometric Measurements above.
Where,
Calibration Experiments and Enzyme Kinetics Analysis
Glucose calibration experiments were conducted in the presence or absence of galactose, using the setup described in section - Interference Testing of Galactose at Physiological Levels Via Amperometric Measurements, above as follows: Sensors were inserted into the flow cell and allowed to equilibrate in a buffer solution without glucose. After baseline current was reached, an appropriate volume of glucose solution at 400 mg/dL was added incrementally to reach desired concentrations up to a final concentration 400 mg/dL. The current was recorded at each glucose addition step. Galactose calibration was completed in the same manner.
The data from glucose and galactose calibration experiments were analyzed using Michaelis-Menten kinetics. 38 Michaelis-Menten enzyme kinetics analysis is a classic approach to examining enzyme-substrate binding behavior and is represented with the following equation:
In this equation,
While this approach was initially developed to analyze free enzymes in solution, it may be modified and applied to immobilized enzymes used in biosensors. When applied to immobilized enzymes, analysis gives the apparent rather than the true values of
where
Traditionally, the values of Vmax (
Enzyme behaviors do not always follow Michaelis-Menten kinetics and may display sigmoidal distributions rather than hyperbolic. In these cases, linear transformation of the Michaelis-Menten equation is not appropriate. The Hill equation, shown in equation 10, is a means of modeling sigmoidal data.
Equation 10 takes the same form as the Michaelis-Menten equation, but with the addition of the
In this study, the data have been analyzed using Lineweaver-Burk and direct linear plotting as linear translation approaches. Furthermore, they have been assessed with nonlinear regression fits to both the Michaelis-Menten and Hill kinetics equations.
Results and Discussion
Interference Screening
Table 1 shows interference screening results for seven sugars, seven sugar alcohols and three artificial sweeteners with two CGMs at 100 mg/dL glucose. Interference was defined as a change in glucose readings by ⩾20% from the mean baseline value, as calculated by MARD (equation 1).
Under the conditions of the initial screening, most tested compounds did not show interference ⩾ 20% MARD with CGMs’ sensors. The artificial sweeteners were not expected to be enzymatically or electrochemically active, but they were included due to their prevalence as sugar substitutes that may be consumed by CGM users. As expected, the artificial sweeteners did not exhibit an interfering effect during screening. Three of the tested nonglucose sugars, galactose, xylose, and mannose exhibited an interfering effect with CGMs when present at higher than physiological concentrations. Galactose showed the largest interfering effect, followed by mannose and xylose, respectively. The MARD value for 200 mg/dL galactose, mannose, and xylose at 100 mg/dL baseline glucose ranged from 47 to 72%, 37 to 48%, and 19 to 42%, respectively, depending on the type of sensor.
Interference Testing via Direct Amperometric Measurements in Physiological Ranges
Given that the largest interferences at screening concentrations were observed with galactose, the galactose interference at physiologically relevant concentrations was tested via direct amperometric measurements (experiment described in Section Interference Testing of Galactose at Physiological Levels Via Amperometric Measurements above, -).
According to the Interference Testing Clinical Standard, the therapeutic concentration for galactose is reported at ~0.1 mg/dL and the recommended testing concentration for galactose interference is 15 mg/dL. 52 An FDA guidance document for blood glucose monitoring test systems has recommended a similar interference testing range for galactose, with a therapeutic concentration listed at 0.1 mg/dL and a threshold of high toxicity at 10 mg/dL. 53 Following these guidelines, the in vitro interference testing was performed at galactose concentrations between 0.1 and 10 mg/dL, as described in Section Interference Testing of Galactose at Physiological Levels Via Amperometric Measurements, above.
Figure 3 shows the interference of galactose at physiological concentrations with Sensor 1 (Figure 3A) and Sensor 2 (Figure 3B) at 70, 100, and 250 mg/dL of glucose. The difference in current between the baseline glucose and galactose-spiked solution, expressed in MRD values with 95% confidence is plotted as a function of glucose and galactose concentrations. For both sensors, the galactose interference was the largest at 70 mg/dL glucose but was reduced as the baseline glucose concentration increased to 100 or 250 mg/dL.
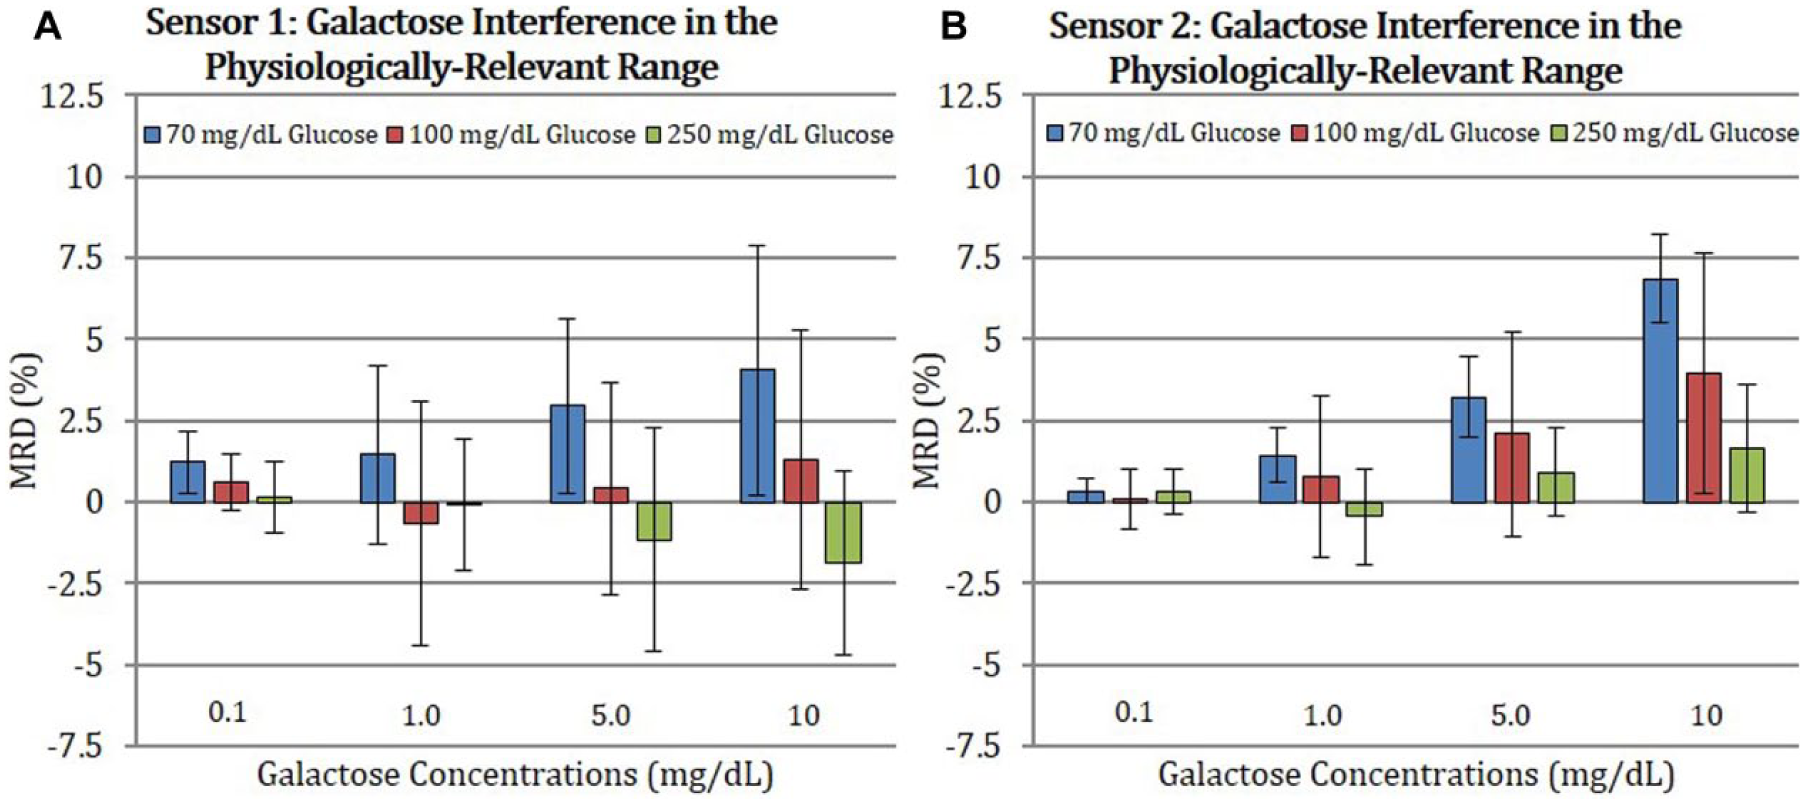
Difference in means between baseline glucose and galactose-spiked solution currents in MRD values for Sensor 1 (A) and Sensor 2 (B) at 70, 100, and 250 mg/dL glucose and physiologic levels of galactose. Error bars indicate 95% CI, n = 3-4.
The interference with Sensor 1 (Figure 3A) was less pronounced as compared to that observed with Sensor 2 (Figure 3B). For Sensor 1, at 70 mg/dL glucose, a positive interference trend was noted with increasing galactose concentrations and MRD point values were ⩽ 4.1% at 10 mg/dL galactose. At 100 mg/dL glucose and 250 mg/dL, MRD point values were less than ±1.3% and ±1.9%, respectively for all tested galactose concentrations.
For Sensor 2, increase in current above the baseline was also observed when galactose concentrations increased from 1.0 to 10 mg/dL (Figure 3B). The highest MRD of 6.9 ± 1.3% was calculated at 10 mg/dL galactose and 70 mg/dL glucose. At 100 mg/dL glucose and 10 mg/dL galactose MRD is 4.0 ± 3.7%. Finally, no significant interference occurred in 250 mg/dL glucose.
In summary, at all glucose concentrations tested under the conditions of this in vitro study, the galactose interference did not exceed the 20% deviation from a baseline value (MRD) when present within the physiologically relevant concentration range of 0.1-10 mg/dL.
Mechanism of Interference
Interference Experiments
Even though the enzymatic interferences of all compounds tested with GOx amperometric CGM sensors are largely negligible, it is important to understand and consider the source and mechanisms contributing to the interfering effects during sensor designs. Since galactose showed the highest interference among all compounds tested, additional tests with high (70 mg/dL) galactose concentration were conducted to understand the mechanism of enzymatic interference (Section -, Galactose Purity ).
Figure 4 shows the results of interference tests conducted by holding the galactose concentration at 70 mg/dL while varying the glucose concentration at 70, 100, or 250 mg/dL. The figure shows plots of the difference in means between baseline glucose and 70 mg/dL galactose-spiked solution, in MRD values, for Sensor 1 and 2 (n = 3 or 4). For Sensor 1, none of the MRD values exceeded 20%. Measurements at 70, 100, and 250 mg/dL glucose indicated MRD of 18.1 ± 10.7%, 6.7 ± 10.6%, and 0.3 ± 4.2%, respectively. While there was a decreasing MRD trend with increasing glucose levels, the latter two values were not statistically different from baseline at α = 0.05. For Sensor 2, measurements at both 70 mg/dL and 100 mg/dL glucose indicated MRD ⩾ 20%, reaching 33.8 ± 4.2% and 22.8 ± 6.2%, respectively. In 250 mg/dL glucose, the MRD deviation point value was lower, at 8.2 ± 2.9%.
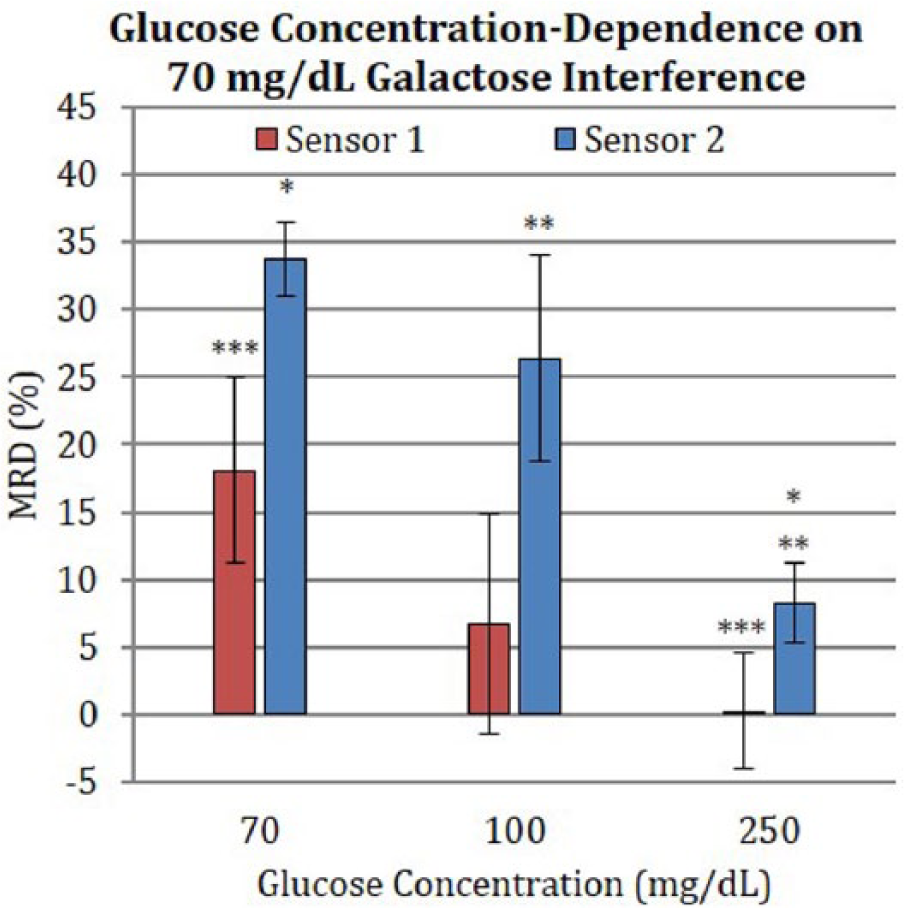
Percentage difference in means of current values between baseline glucose and 70 mg/dL galactose-spiked solution in MRD values for Sensor 1 and Sensor 2. Error bars indicate 95% CI. *, **, ***P < .05, n = 3-4.
The combination of the amperometric and screening data suggests that galactose interference exhibits dose-response behavior; however, the magnitude of interference decreases as the glucose concentration increases.
Figure 5 compares the difference in means for the raw current (
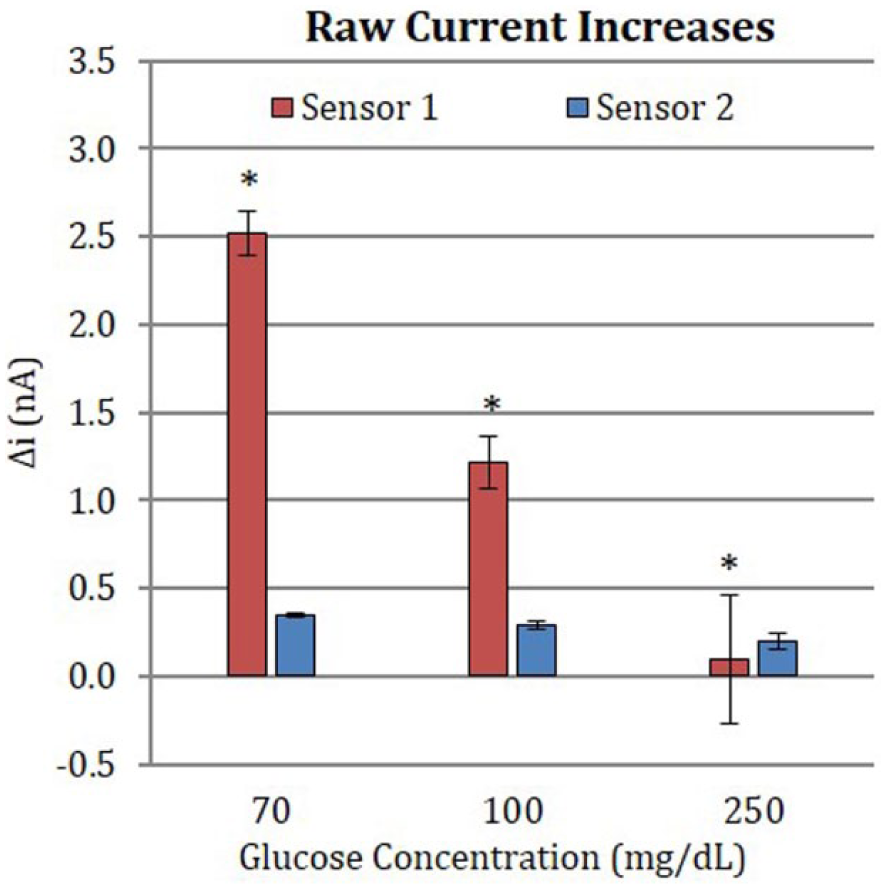
Difference in means for the raw current values between baseline glucose (70, 100, and 250 mg/dL) and 70 mg/dL galactose-spiked solution. Error bars indicate 95% CI. *P < .05, n = 3-4.
Overall, while the MRD decreased with increasing glucose concentration, the difference in raw current response to galactose across the glucose concentration range tested suggests that there may be a difference in the underlying interfering mechanism(s) between the sensor types. For Sensor 1, the magnitude of the raw current produced in response to galactose noticeably decreases as the glucose concentration increases. If galactose is reacting directly with GOx, this behavior would be expected, as increasing amounts of glucose would lead to a greater likelihood of glucose molecules out-competing galactose for interaction with GOx. As the concentration of glucose increases, the raw current produced from galactose interaction with GOx would decline. It would be expected that at high glucose concentration or when enzyme saturation threshold is reached, the addition of galactose would not cause any current increase. At the tested glucose concentration range the enzyme would not be expected to be saturated, as is demonstrated by changes in MRD in Figure 4.
Conversely, for Sensor 2, there is only a slight qualitative decline in the raw current as glucose concentration increases. These data suggest that interference may not only be influenced by galactose/glucose competition for GOx-binding, but may also result from reaction of galactose with galactose oxidase (GalOx) impurity.
Calibration Experiments and Enzyme Kinetics Analysis
In addition to the interference tests discussed above, calibration experiments with glucose and galactose were conducted to elucidate the enzyme kinetic behavior of the CGMs. Figure 6 shows examples of current increase as a function of glucose or galactose concentrations during the calibration experiments. As expected, data clearly demonstrates the greater reaction rate of GOx sensors to glucose than galactose. These data were utilized to estimate the kinetic parameters of the sensors.
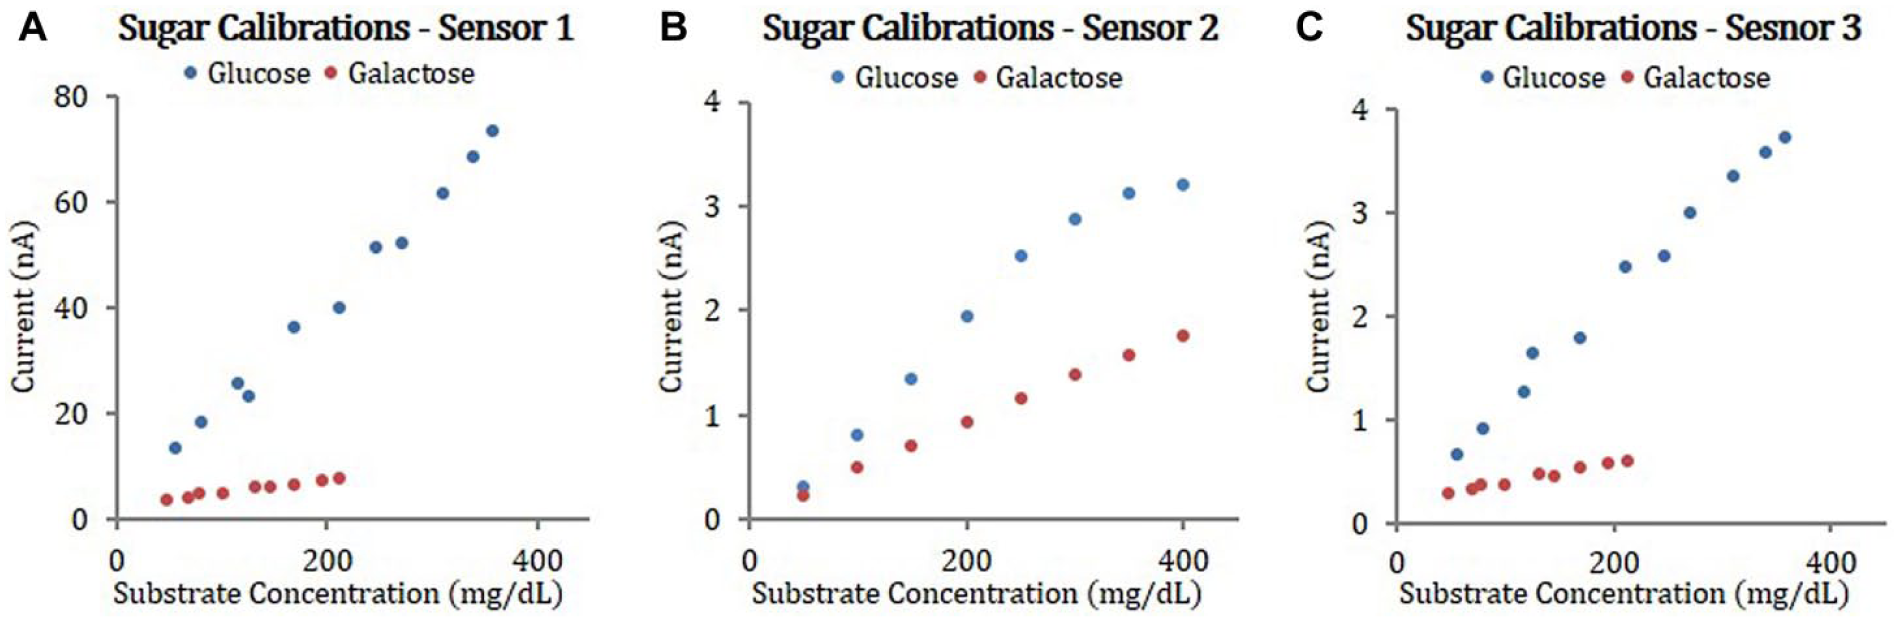
Examples of current increase as function of glucose or galactose concentrations during the calibration experiments with Sensor 1 (A), Sensor 2 (B), and Sensor 3 (C).
Figure 7 shows the effect of glucose concentration on reaction rate (measured in current), in a glucose calibration experiment for Sensor 2. Michaelis-Menten enzyme kinetics constants were obtained by fitting data with the linear and nonlinear Michaelis-Menten enzyme kinetic models. Figure 7A shows the linear Lineweaver-Burk double reciprocal plot of the data. It should be noted that this trend line provides a nonsensical negative y-intercept for the data, translating to negative
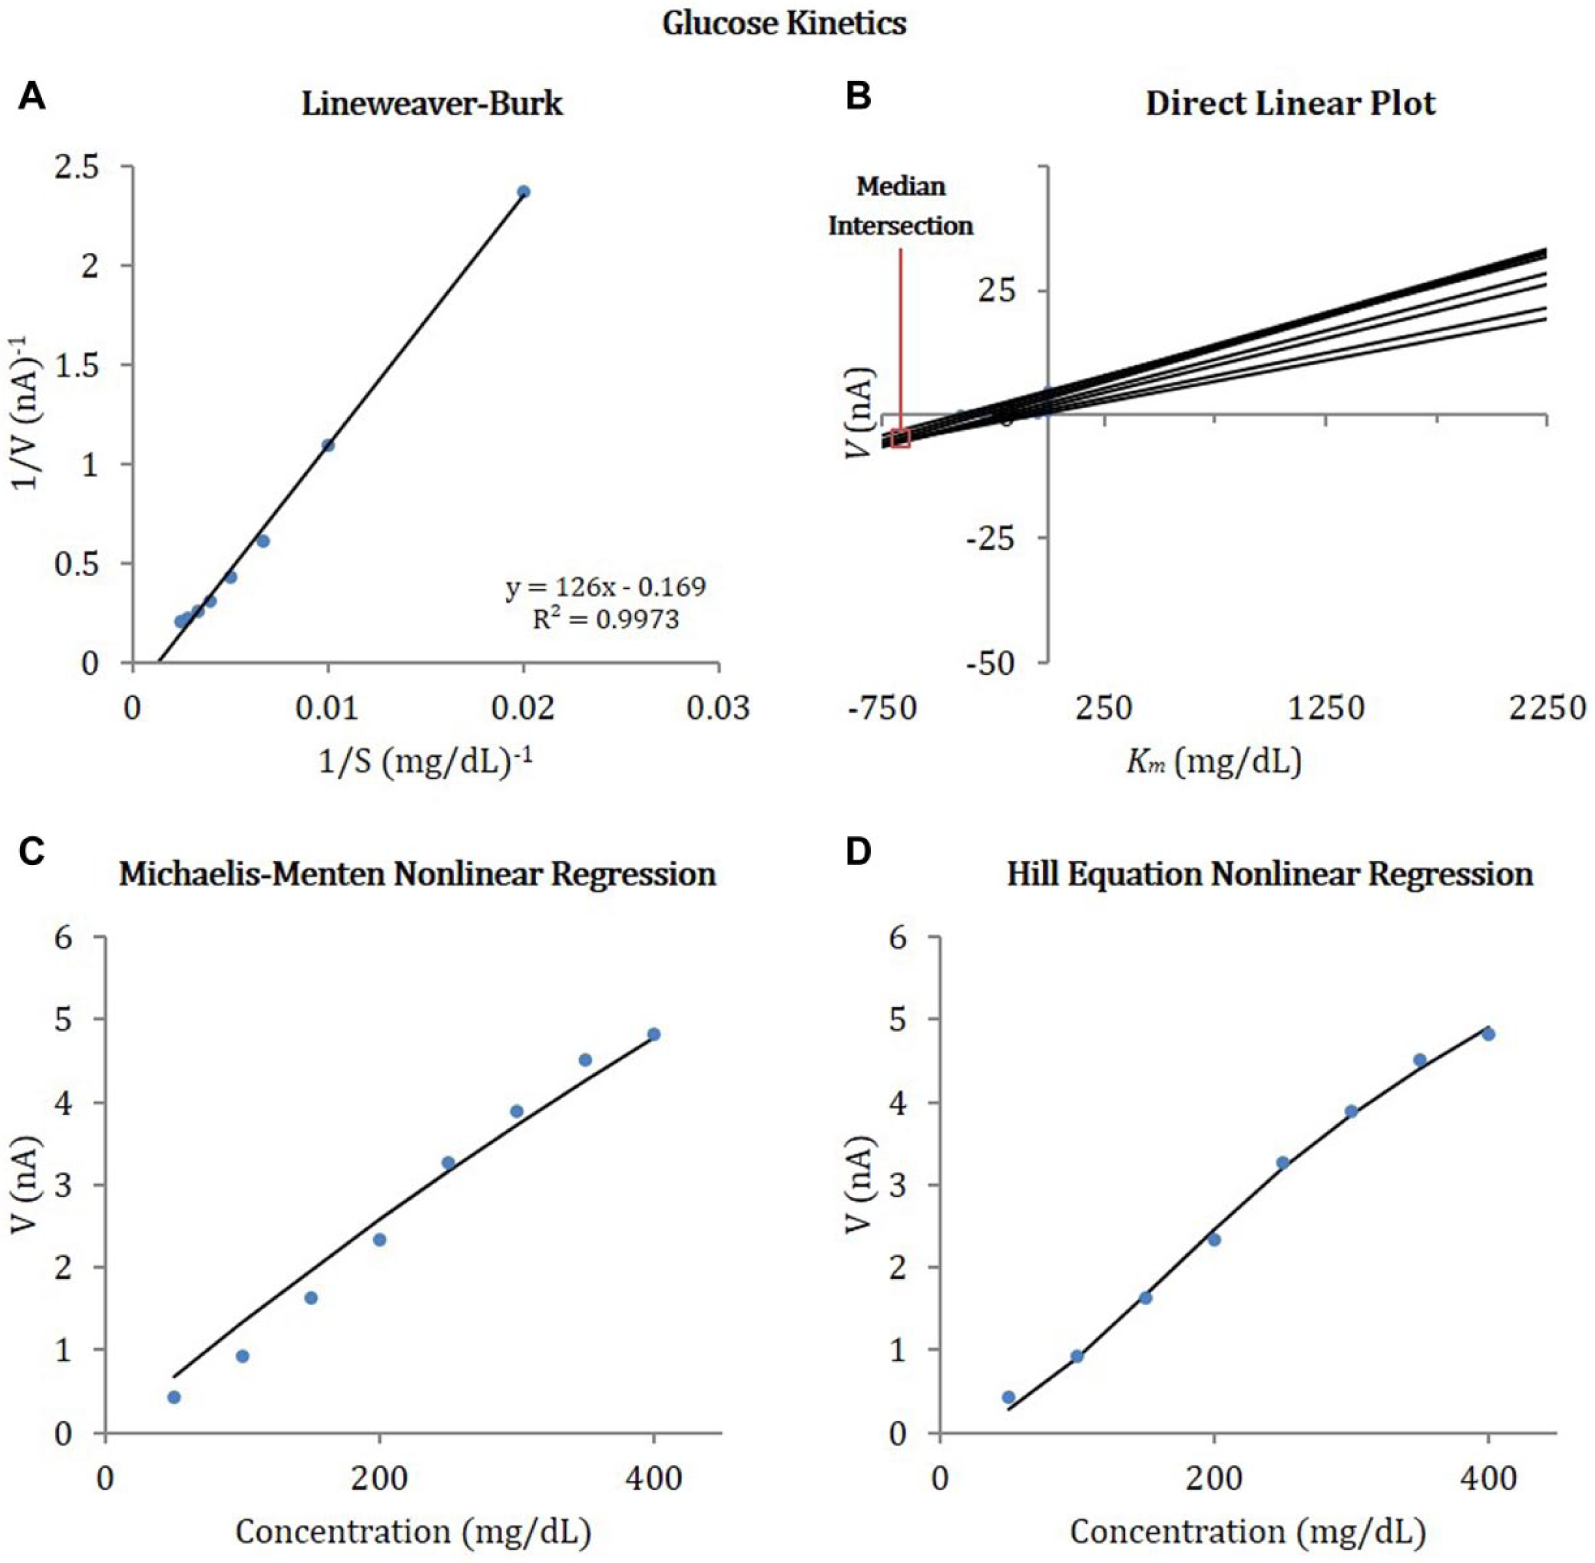
Effect of glucose concentration on reaction rate (measured as current) obtained from glucose calibration experiments with Sensor 2. Enzyme kinetics constants were obtained by fitting data to the linear and nonlinear enzyme kinetic models: (A) Lineweaver-Burk double reciprocal linear plot, (B) direct linear plot, (C) nonlinear regression, and (D) Hill equation nonlinear regression.
The Apparent Enzyme Kinetic Constants Determined Using Linear and Nonlinear Models.
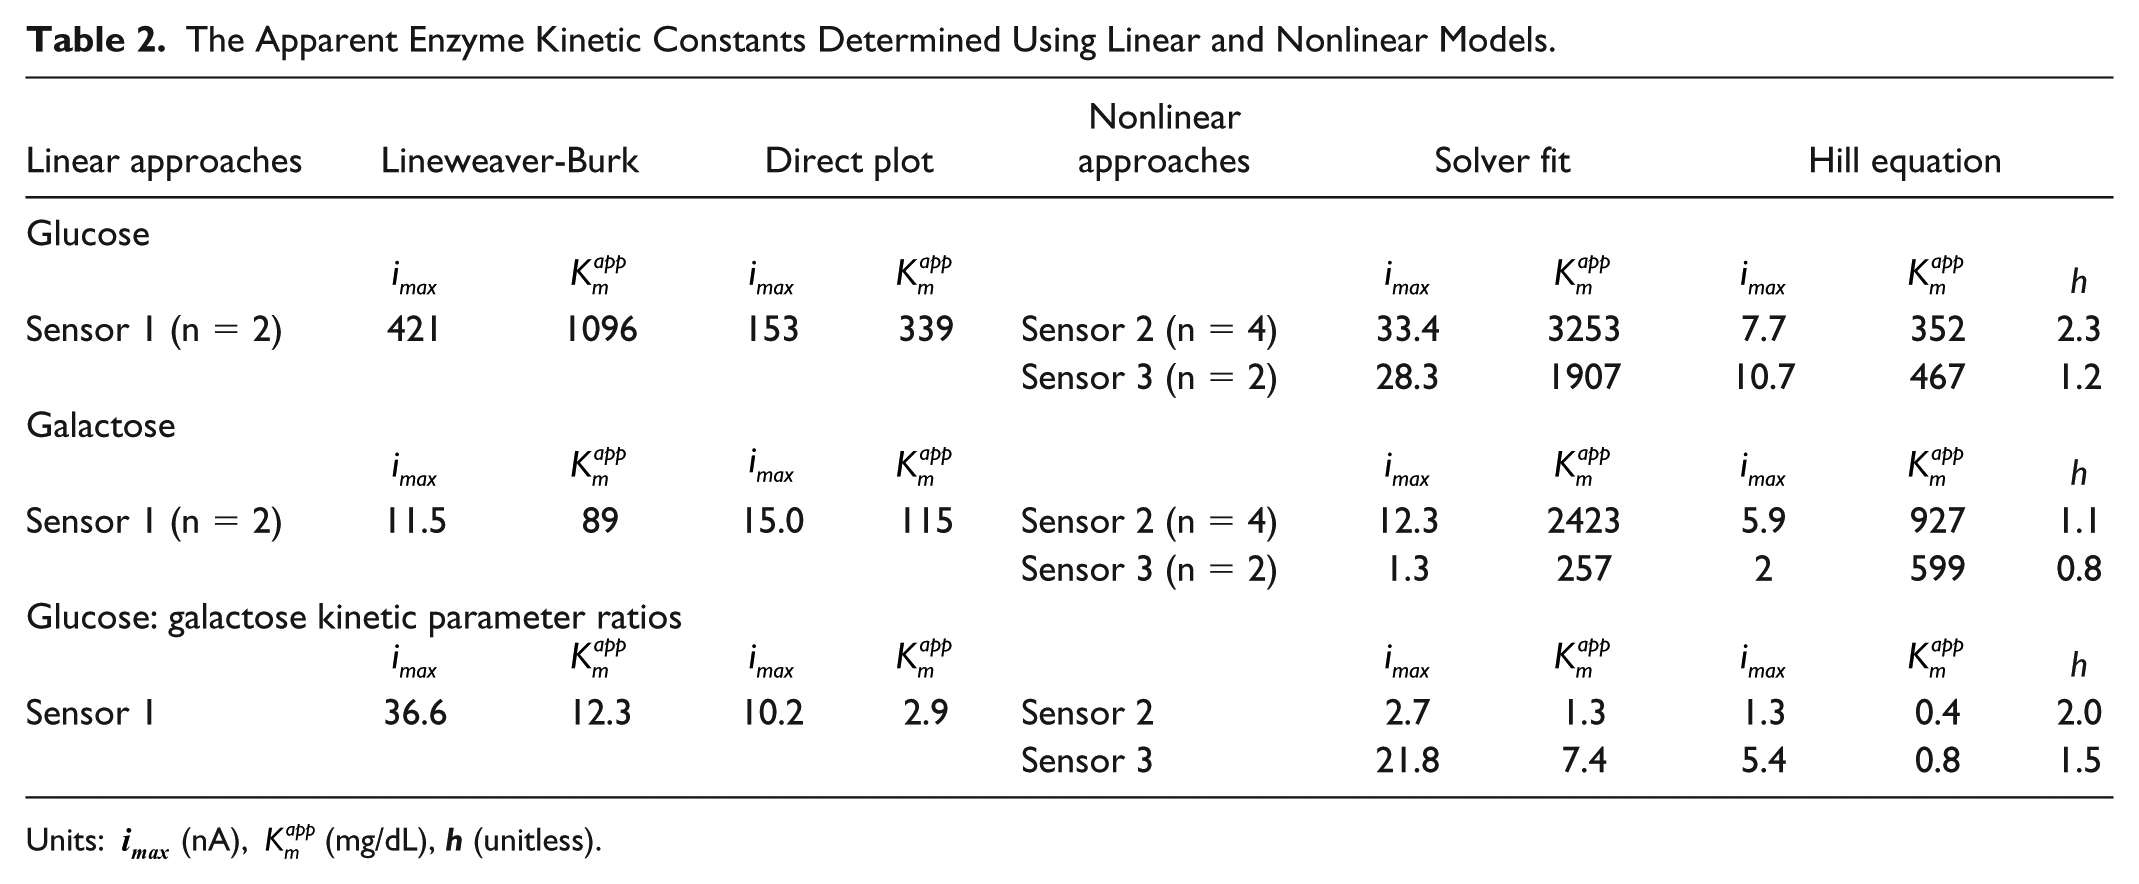
Units:
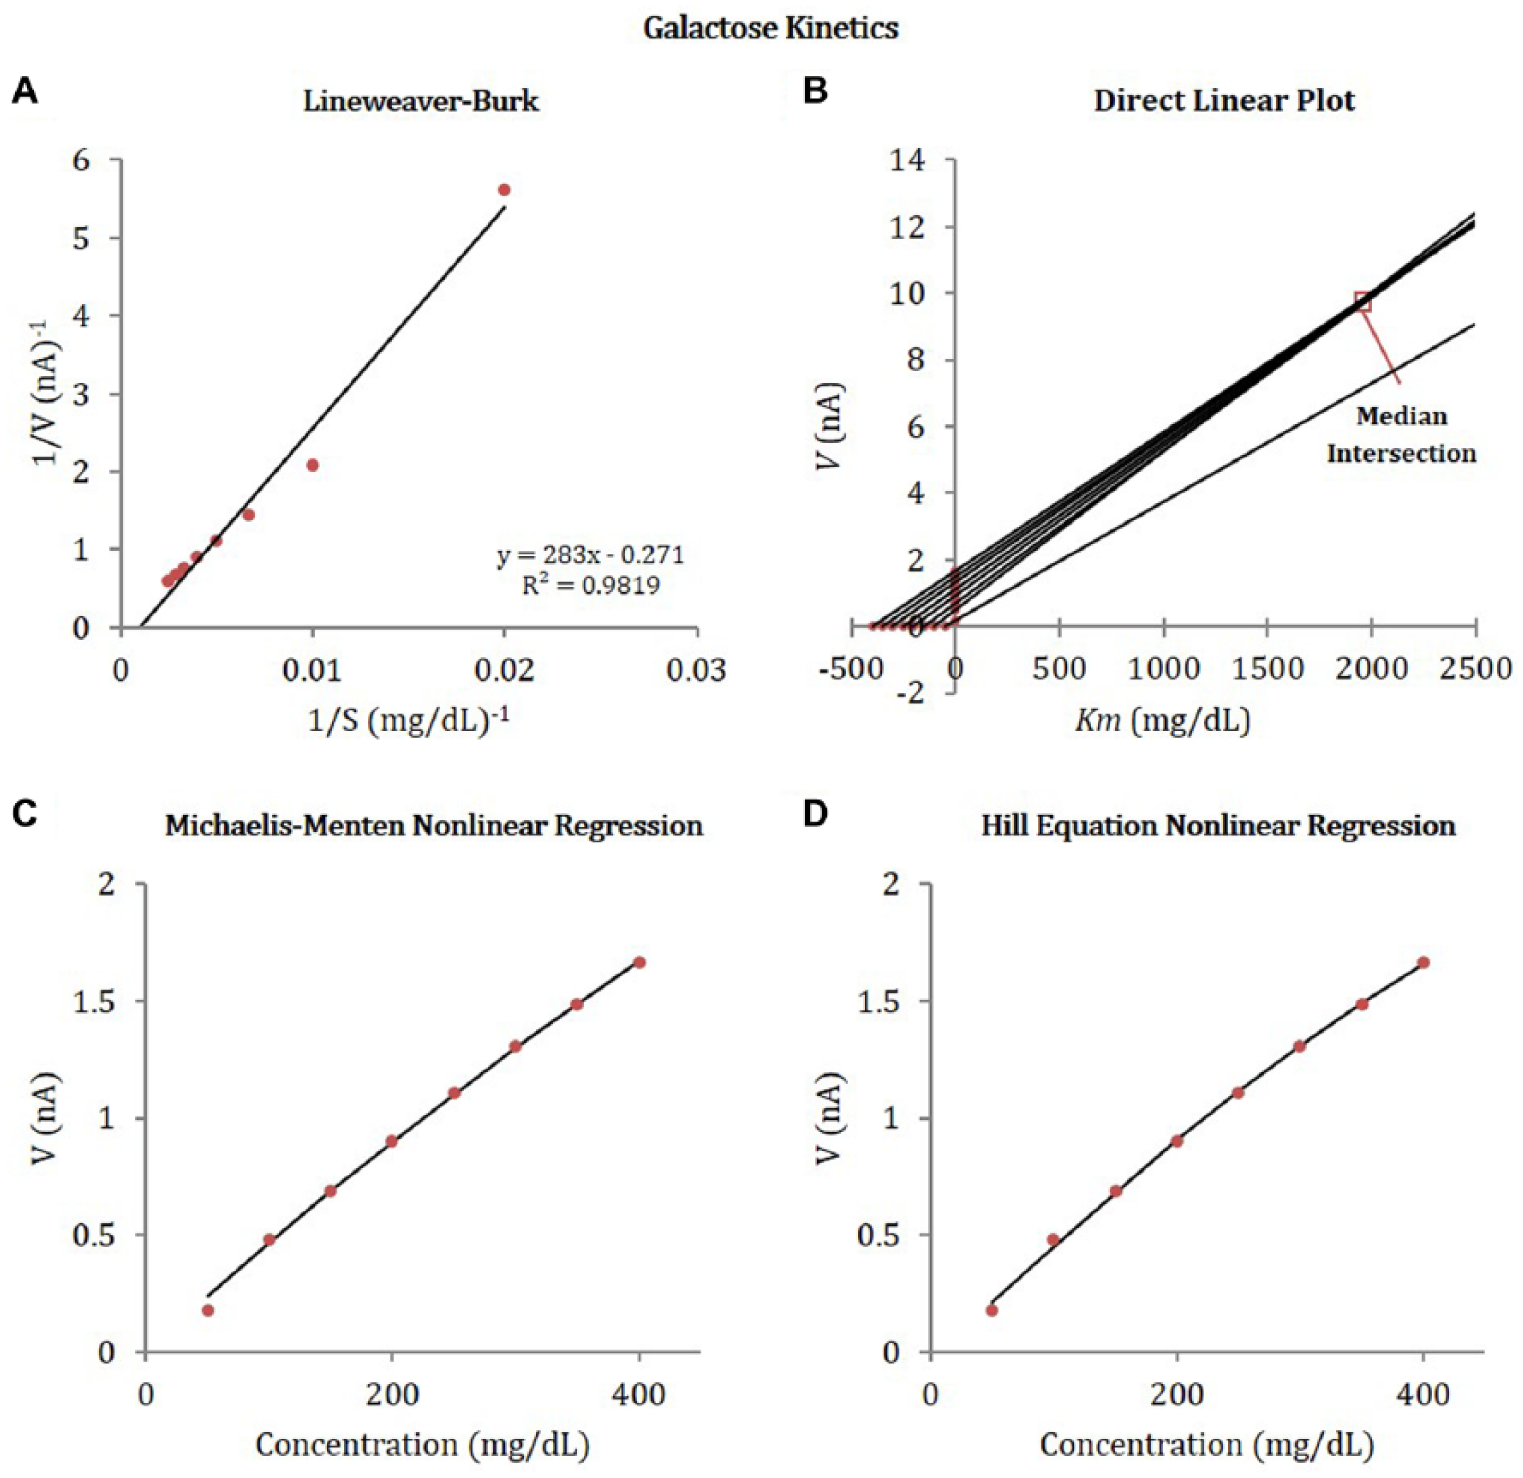
Effect of galactose concentration on reaction rate (measured as current) obtained from galactose calibration experiments with Sensor 2. Enzyme kinetics constants were obtained by fitting data to the linear and nonlinear enzyme kinetic models: (A) Lineweaver-Burk double reciprocal linear plot, (B) direct linear plot, (C) nonlinear regression, and (D) Hill equation nonlinear regression.
We observed that linear fits obtained using Lineweaver-Burk plots provides better fits for Sensor 1 data, which has a greater electrode surface area and a larger linear range for glucose concentration. The greater surface area of the electrode for Sensor 1 likely corresponds to a greater quantity of GOx involved in the reaction; however, lack of exact dimensions for any of the sensor electrodes precludes normalizing current to surface area or assessing the GOx-immobilization density. Presumably, a larger amount of enzyme results in greater raw current, and wider linear range, however this may not be the case if diffusion is more limited. The nonlinear analyses provide better fits for Sensors 2 and 3, which have smaller surface areas and smaller linear ranges. The enzyme kinetics data for Sensors 2 and 3 follow a more sigmoidal pattern than the hyperbolic pattern suggested by the Michaelis-Menten kinetics, which is justification for inclusion of the Hill equation. Inconclusive data with the Lineweaver-Burk plot or other linear transformations may also be related to limitations in applying such analyses to enzyme kinetic studies of sensors with immobilized enzymes or diffusion-limited kinetics.39,40,53,54
The comparison of kinetic data, specifically the ratio of apparent
Implications of Different Mechanisms of Sugar Interference for Sensor Design
We hypothesized three potential mechanisms for the sugar interference: (1) the presence of glucose impurity within nonglucose sugar sample, (2) the reactivity of GOx toward nonglucose sugars, and (3) the presence of enzymatic impurities, such as galactose oxidase (GalOx) within the GOx enzyme sensing layer. Each potential mechanism was explored to explain galactose interferences.
Glucose Contamination in Galactose. Contamination of the galactose samples with glucose has a potential to create a positive interference effect. The purity of the galactose was tested in a glucose-hexokinase assay. The assay did not provide evidence for the presence of quantifiable amount of glucose contamination in the galactose samples (ie, the amount of glucose impurity in galactose sample was below the detection range of this assay, ie, < 0.05 mg/dL). Furthermore, the lot specific certificate of analysis (Lot 011M00202V) reports 100% purity for this Lot based on HPLC analysis. The results of the glucose-hexokinase assay and manufacturing HPLC purity testing suggest that the observed interferences are not due to presence of residual glucose in galactose sample, but are due to galactose.
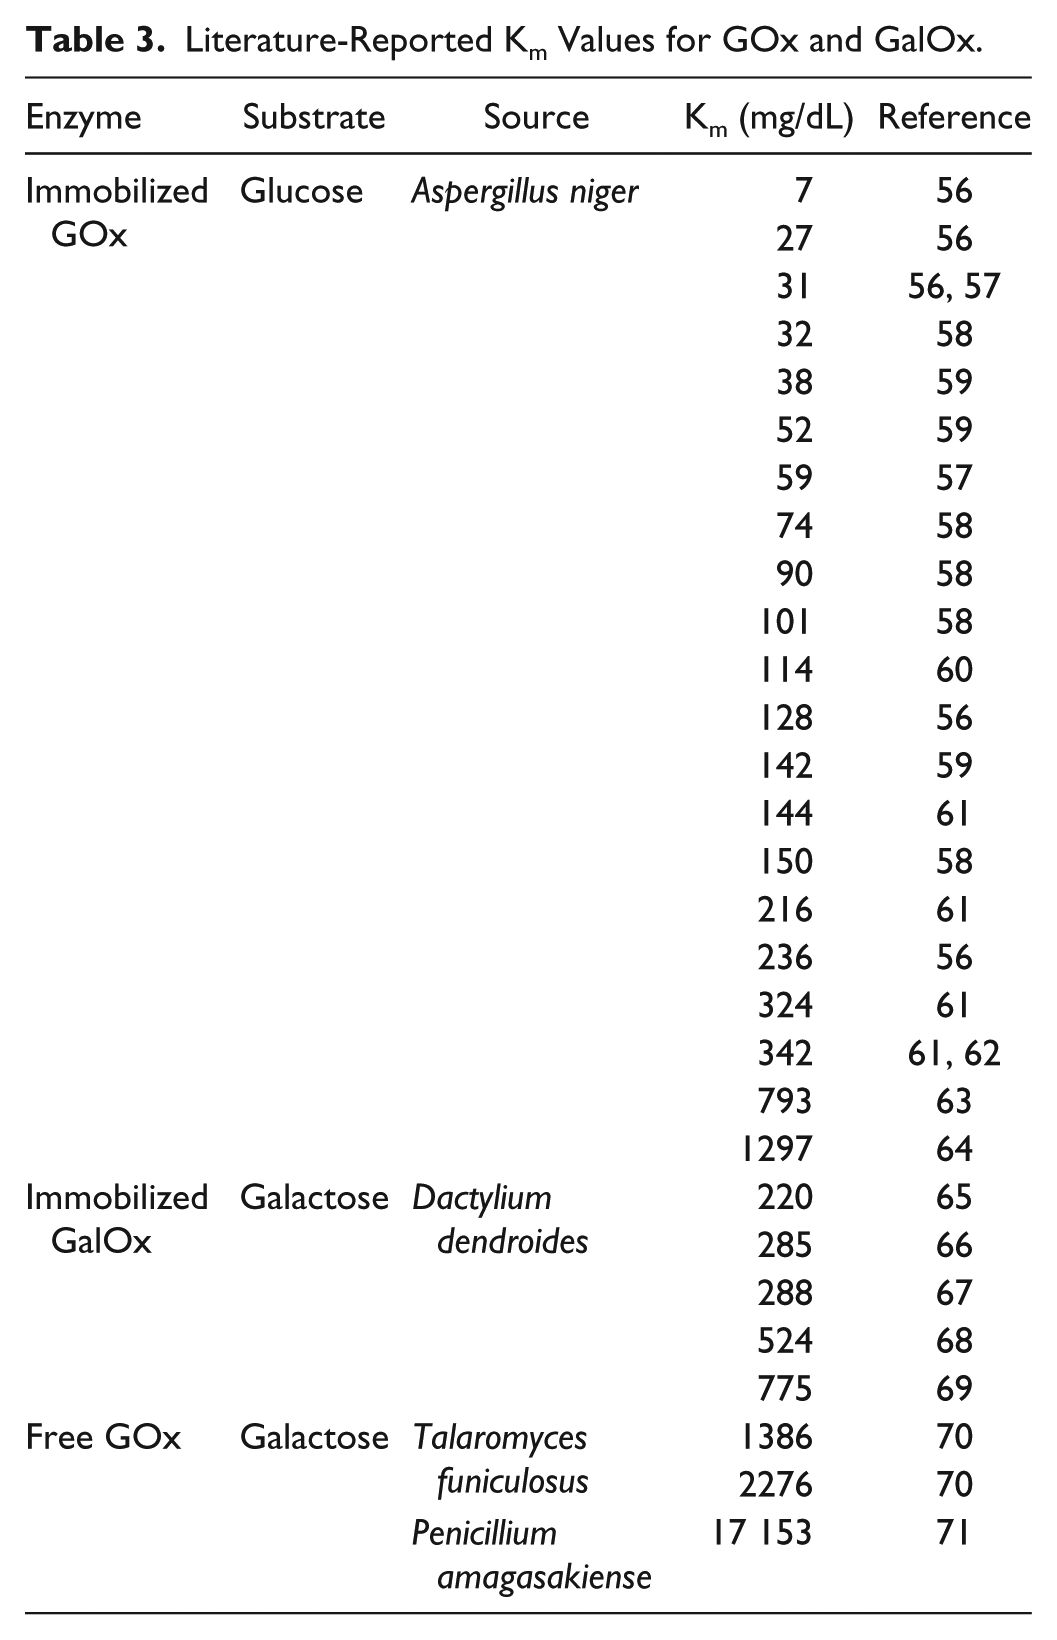
Reactivity of Glucose Oxidase to Galactose. Reactivity of GOx toward galactose and other nonglucose sugars has been studied. However, the reports comparing the rates for GOx reactivity toward glucose and galactose are diverse.13,15,55 One such study reports that free GOx oxidizes glucose by 270-600 times faster than galactose. 15 Another study reports that an immobilized form of GOx follows Michaelis-Menten behavior in enzyme-limited experiments and exhibits catalysis efficiency (kcat/KM) that is 61 times greater for glucose as compared to galactose. 55 Additional studies that report Km values for galactose interaction with GOx indicate higher Km values (lower binding affinity) compared to glucose-GOx interactions (Table 3). While GOx has a much greater affinity for glucose than galactose, it is plausible that some reactivity of GOx toward galactose can occur within the GOx-based sensors, adding to the current measured by the CGMs. The current contribution from galactose would have proportionally greater interference impact at lower rather than higher concentrations of glucose. The interference trends noted in this study fit this concept (ie, greater galactose concentrations coincide with greater measured signal, and the interference is more pronounced at lower glucose concentrations).
Literature-Reported Km Values for GOx and GalOx.
When examining kinetic data, the big difference in the max rate constant (
Interferences with Sensors 2 and 3 are likely influenced by a diffusion limitation mechanism and GOx reactivity with galactose. However, the comparison of kinetic data, specifically the ratio of apparent
Contamination of Glucose Oxidase - with Other Enzymes. A third potential contributing factor to interference may be GalOx impurities in the GOx sensing layer used in the CGMs. GOx stocks acquired from commercial sources are largely pure, but vendors do report lot-specific contamination by enzymes such as α-amylase, saccharase, maltase, glycogenase, invertase, protease, and galactose oxidase.17-19 The possible presence of GalOx creates the potential for an increase in interfering signal with increasing galactose concentration. The oxidation of D-galactose by GalOx in the presence of O2 results in production of D-galacto-hexodialdose and hydrogen peroxide (H2O2). Since this reaction produces additional H2O2 which could be then further oxidized at the electrode, an increase in the measured current from the sensors can be expected, which is in agreement with the data acquired during this study.
Table 3 reports the Michaelis constant
In addition, it is interesting to note the changes in the h parameter of the sensors’ data fit by the Hill equation. The h term in the Hill equation, known as the Hill coefficient, is a measure of binding cooperativity that takes into account allosteric effects of substrate binding with the enzyme.
77
When h > 1, there is positive cooperativity in the allosteric binding effects. If h = 1, there is neither positive nor negative cooperativity and the enzyme behaves in a manner analogous to Michaelis-Menten kinetics. When h < 1, there is negative cooperativity, where binding of a substrate molecule has a deleterious impact on the binding of additional molecules. While h is not necessarily indicative of the exact number of binding sites of an enzyme, and has been criticized for its simplistic representation of multiple substrate binding to an enzyme, it may give a minimum value to the number of binding sites.
77
Hill coefficients for Sensors 2 and 3, suggest that there is a higher level of cooperativity for the enzymes when binding glucose compared to galactose. The decrease in binding cooperativity in the presence of galactose or when only galactose is present suggest that there is either a dampening of cooperativity when GOx binds galactose rather than glucose, or perhaps the presence of GalOx. GOx is a dimeric protein, with two active binding sites on the molecule. This corresponds particularly well with the h = 2.3 for sensor 2. GalOx, conversely, has single active catalytic site. The h value of 1.1 in the presence of galactose, in the context of the relatively high
Conclusion and Future Considerations
Seven nonglucose sugars, seven sugar alcohols, and three artificial sweeteners were tested in vitro for interferences with amperometric GOx-based CGM sensors. Under the conditions of testing, interferences of <20% were observed, except with very high, nonphysiological concentrations of galactose, mannose and xylose; galactose showed the highest levels of interference.
At physiologically relevant concentrations (0.1-10 mg/dL), the galactose interference was largely negligible. A maximum deviation from baseline, MRD of ⩽6.9 ± 1.3%, was observed at 70 mg/dL glucose and 10 mg/dL galactose. The interference response was found to be proportional to galactose dose. Interference appeared to diminish as glucose concentration increased from hypoglycemic- to euglycemic- to hyperglycemic-relevant concentrations, suggesting that interferences may have proportionately greater impact at lower rather than higher glucose levels. The potential for greater interferences at the low glucose concentrations should be considered during sensor design and testing.
Enzyme kinetic analysis suggests that the observed galactose interferences are impacted by the sensor design and membrane resistance to analyte diffusion, and may be attributed to either GOx reactivity toward galactose, and/or to the presence of GalOx impurities within the GOx enzyme layer. GOx reactivity and purity should be taken into consideration when designing GOx-based sensors for glucose detection. Additional research into immobilized forms of GOx would be beneficial to provide insight into the relative reactivity of immobilized enzyme toward other sugars. Much of the available enzyme cross-reactivity literature examines the free-enzyme rather than its immobilized forms that are utilized by many enzyme-based sensor technologies. Additional studies to quantify the impact of diffusion on interferences would also be helpful.
Furthermore, these data have been acquired from in vitro testing protocols. Since in vitro data do not always correlate with in vivo activity, in vivo studies would ultimately determine the clinical significance of any interferences.
Footnotes
Acknowledgements
The authors would like to thank Randy Bidinger and Bruce Fleharty for their help building the flow-cell; Bruce Schneider and Michael Gu for valuable discussions; Alex Nguyen and Roger Narayan and for assistance with 3D printing; DBCMS management for support.
Abbreviations
A. niger, Aspergillus niger; CGMs, continuous glucose monitors; CI, confidence interval; GalOx, galactose oxidase; GOx, glucose oxidase; HBSS, Hank’s balanced salt solution; HPLC, high-performance liquid chromatography; ISF, interstitial fluid; MARD, mean absolute relative difference; MRD, mean relative difference; PBS, phosphate buffered saline.
Disclaimer
The findings and conclusions in this article have not been formally disseminated by the Food and Drug Administration and should not be construed to represent any agency determination or policy. The mention of commercial products, their sources, or their use in connection with material reported herein is not to be construed as either an actual or implied endorsement of such products by Department of Health and Human Services.
Declaration of Conflicting Interests
The author(s) declared the following potential conflicts of interest with respect to the research, authorship, and/or publication of this article: At the time of research, DS was an ORISE Fellow at CDRH/FDA, but is currently an employee at Dexcom, Inc.
Funding
The author(s) disclosed receipt of the following financial support for the research, authorship, and/or publication of this article: This project was supported by an appointment to the Research Participation Program at the Center for Devices and Radiological Health administered by the Oak Ridge Institute for Science and Education through an interagency agreement between the US Department of Energy and the US Food and Drug Administration. Additionally, this project was supported by funding provided by the US FDA Critical Path Initiative administered through CDRH/OSEL/DBCMS.