
Abstract
Background:
Diabetes treatment is intended to maintain near-normal glycemic levels. Self-monitoring of blood glucose (SMBG) allows patients to track their BG levels compared with glycemic targets and is associated with improved health outcomes. Because of the importance of SMBG, it is essential that results are accurate to prevent errors in nutritional intake and drug dosing. This study presents a new methodology to evaluate the accuracy of BG monitoring systems (BGMSs).
Methods:
Sensitivity analyses were performed using real and simulated BGMS data to compute probabilities that, for any BG value, the BGMS result would be within prescribed error bounds and confidence limits compared with laboratory reference values. Multiple BG value ranges were used.
Results:
Probability curves were created using data from 3 simulated BGMSs and anonymized data from 3 real-world BGMSs. Accuracy probability curves from capillary fingertip blood samples (actual clinical data) showed that all 3 real-world BGMSs met EN ISO 15197:2015 accuracy criteria, since 99.63%, 99.63%, and 99.81% of results from the 3 BGMSs were within ±15 mg/dL or ±15% of reference for BG <100 mg/dL and ≥100 mg/dL, respectively. However, there was identifiable variability between BGMSs if BG was <70 mg/dL; one BGMS showed further reductions in accuracy if BG was <50 mg/dL.
Conclusions:
Probability curves highlight the importance of BGMS accuracy to help achieve optimal glycemic control while avoiding hypoglycemia or hyperglycemia. This may be especially significant in very low BG ranges where small errors in BGMS measurements can have substantial impacts on patient-related outcomes, including hypoglycemia risk.
For people with type 1 or type 2 diabetes, current injectable treatments (including insulin) and/or oral medications are administered with the goal of maintaining near-normal levels of glycemia. This is important for reducing short- and long-term diabetes complications and mortality.1,2 One of the most common short-term complications, hypoglycemia, has been identified as the primary barrier to safe attainment of good glycemic control3,4; maintaining strict glycemic control without increasing the risk for hypoglycemia can be a lifelong challenge.
Self-monitoring of blood glucose (SMBG) is an integral component of effective diabetes therapy.5,6 This approach allows people with diabetes to evaluate their own responses to prescribed therapy and to track their ability to achieve glycemic targets, 5 and it is associated with improved outcomes in this population.6-8
Because of the importance of SMBG, it is essential that results from such monitoring are accurate to prevent errors in nutritional intake and drug dosing. 9 To that end, in most regions of the world, blood glucose monitoring systems (BGMSs) are required to meet specific accuracy guidelines. Current guidelines include the International Organization for Standardization (ISO) in Europe and Canada 10 and the US Food and Drug Administration (FDA) in the United States. 9 European Norm (EN) ISO 15197:2015, also known as ISO 15197:2013, accuracy criteria define a BGMS to be accurate if ≥95% of results fall within ±15 mg/dL of a reference laboratory result when blood glucose concentrations are <100 mg/dL or within ±15% of the reference when blood glucose concentrations are ≥100 mg/dL. 10 An updated FDA guidance published in October 2016 recommended that 95% of all BGMS results should be within ±15%, and 99% of all BGMS results should be within ±20% of the reference laboratory method across the entire claimed measuring range of the BGMS. 9 These more stringent guidelines recognized the limitations of evaluating blood glucose samples at the extreme ends of the measuring range, especially in the low range where very few samples are available. Recognizing the clinical importance of the accuracy of blood glucose measurements for hypo- and hyperglycemic blood samples, both European and US authorities have requested that accuracy data be reported separately for low, normal, and high blood glucose ranges.9,10
Although ISO standards continue to improve over time, a need remains to evaluate analytical performance in the critically important hypoglycemic range, since performance in detecting low blood glucose levels is important for the detection and management of hypoglycemia. The current investigation was undertaken to assess a new methodology to allow a closer examination of BGMS accuracy. This evaluation assessed performance and identified subtle differences between BGMSs not only in different blood glucose ranges but also at specific blood glucose concentrations across the entire range.
Methods
Simulated Blood Glucose Monitor Sensitivity Analyses
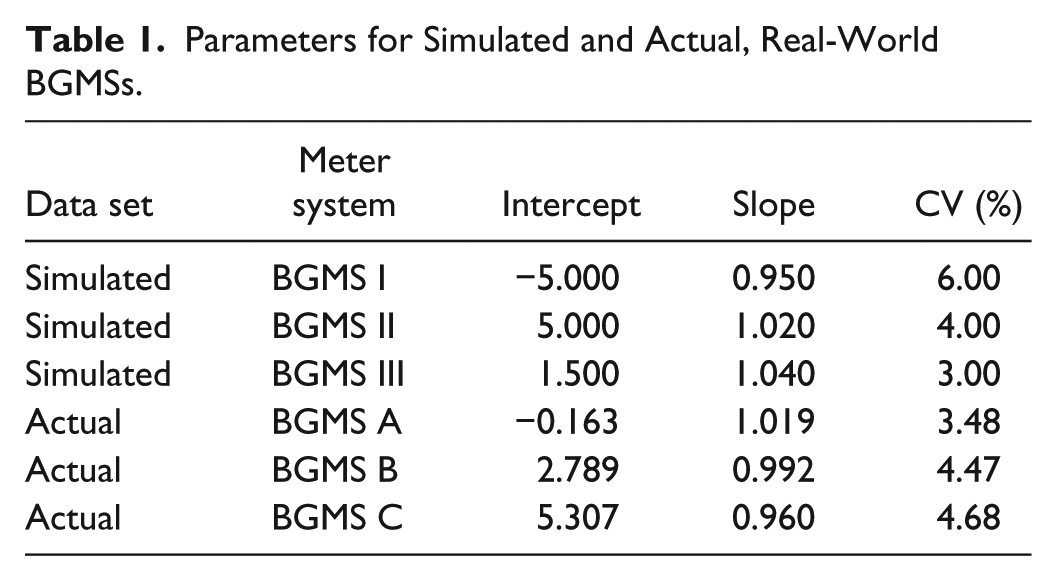
The methodology we have developed was applied to sensitivity analyses based on simulated BGMS data. Three individual BGMSs were simulated: an “underperforming” unit (BGMS I), an adequately performing unit (BGMS II), and an “overperforming” unit (BGMS III). These simulated BGMS data sets were used to provide outputs across 3 ranges of blood glucose concentrations based on recently published recommendations for the use of ambulatory blood glucose profiles in clinical practice: low (30-70 mg/dL), normal (70-180 mg/dL), and high (180-600 mg/dL) blood glucose concentrations. 11 The parameters used to simulate each BGMS were as follows: BGMS I, intercept = −5.00 (β0), slope = 0.950 (β1), CV = 6% (100%c); BGMS II, intercept = 5.00, slope = 1.020, CV = 4%; BGMS III, intercept = 1.50, slope = 1.040, CV = 3% (Table 1). A sample of N = 1000 laboratory method results (comparator) were simulated from a gamma distribution having shape parameter = 4.4 and scale parameter = 36.8. The primary outputs were probabilities that each meter would yield an error (100%r) of ±5%, ±10%, ±15%, and ±20% over multiple specific blood glucose values within each blood glucose range based on aggregate statistics (ie, not for specific blood glucose values). The probability that percentage relative error, RD, falls within ±100%r was computed using the equations, together with the standard normal distribution:
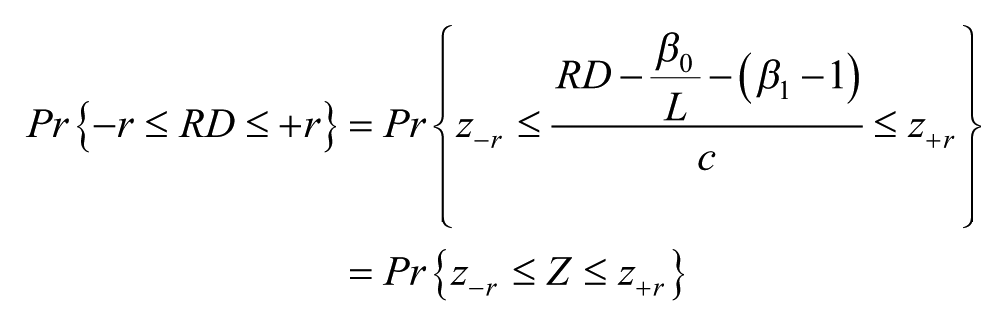


That is, z−r and z+r are z-scores corresponding to −r and +r, respectively.
Parameters for Simulated and Actual, Real-World BGMSs.
Real-World Blood Glucose Monitor Sensitivity Analyses
To investigate the sensitivities of BGMSs used in practice, actual clinical blood glucose data from a previous study that compared the accuracy of multiple BGMSs were used; these blood glucose data were obtained from capillary fingertip blood.12,13 Using these results, regression models were fit to blood glucose data and graphed with BGMS results on the y-axis and reference blood glucose results on the x-axis. Three different real-world BGMSs were assessed, anonymized as “BGMS A,” “BGMS B,” and “BGMS C” (Table 1). A weighted least squares method was used to account for the proportional nature of standard deviations (ie, the standard deviation was proportional to the laboratory value of the blood glucose concentration). Regression coefficients, together with statistical estimates of coefficients of variation, were used to compute the probability that, for any given blood glucose value, the BGMS result would be within ±15% of the laboratory value, and 95% lower confidence limits on these probabilities were computed. Furthermore, 95% and 99% ranges were calculated at different specific blood glucose levels in low (54.0 mg/dL), normal (72.1, 90.1, 126.1, and 162.1 mg/dL), and high (270.2, 405.4, and 540.5 mg/dL) blood glucose ranges.
Results
Accuracy Probability Curves Using Data From Simulated BGMSs
To establish baseline results across prespecified conditions, we created probability curves across a range of blood glucose levels, accuracy criteria, and BGMS performance capabilities. Three ranges of blood glucose levels were imputed; specifically, low (30-70 mg/dL), normal (70-180 mg/dL), and high (180-600 mg/dL), based on recently published recommendations. 11 For each of these ranges, 3 simulated BGMSs were modeled: an “underperforming” unit (BGMS I), an “adequately” performing unit (BGMS II), and an “overperforming” unit (BGMS III). Table 2 shows the resulting probabilities of each simulated BGMS achieving accuracy within ±5%, ±10%, ±15%, and ±20% of laboratory derived values across the specified ranges of blood glucose levels. These results provide the expected outcomes for an underperforming unit (BGMS I; Figure 1A), which would not meet EN ISO 15197:2015 (ISO 15197:2013) requirements; an adequately performing unit (BGMS II; Figure 1B), which would achieve EN ISO 15197:2015 (ISO 15197:2013) requirements; and an overperforming unit (BGMS III; Figure 1C), which would exceed EN ISO 15197:2015 (ISO 15197:2013) requirements. In addition, the proportions of results within specified error rates compared with laboratory reference values for each simulated BGMS and blood glucose range are presented in Table 2.
Percentages of Simulated BGMS Results Within Specified Error Rates Compared With Laboratory Reference Measurements.
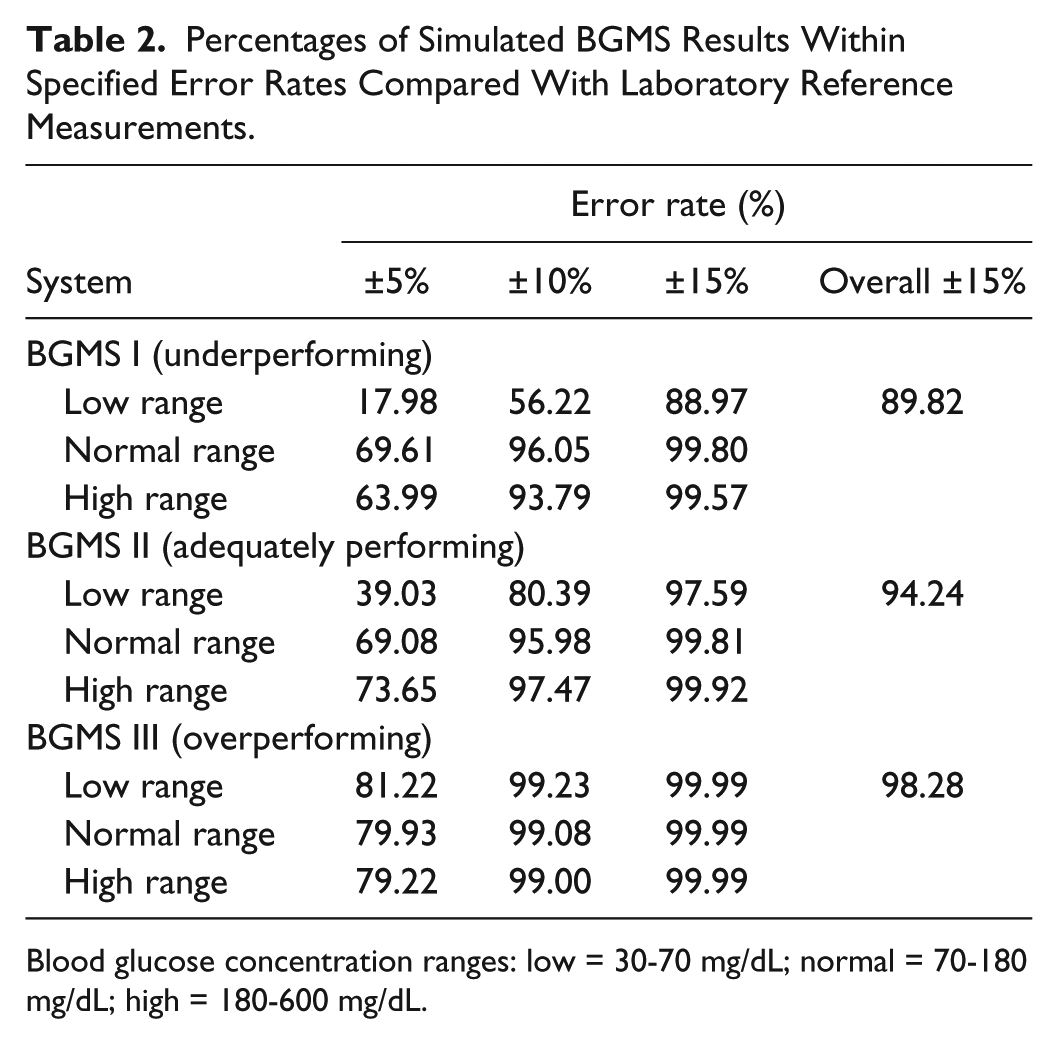
Blood glucose concentration ranges: low = 30-70 mg/dL; normal = 70-180 mg/dL; high = 180-600 mg/dL.
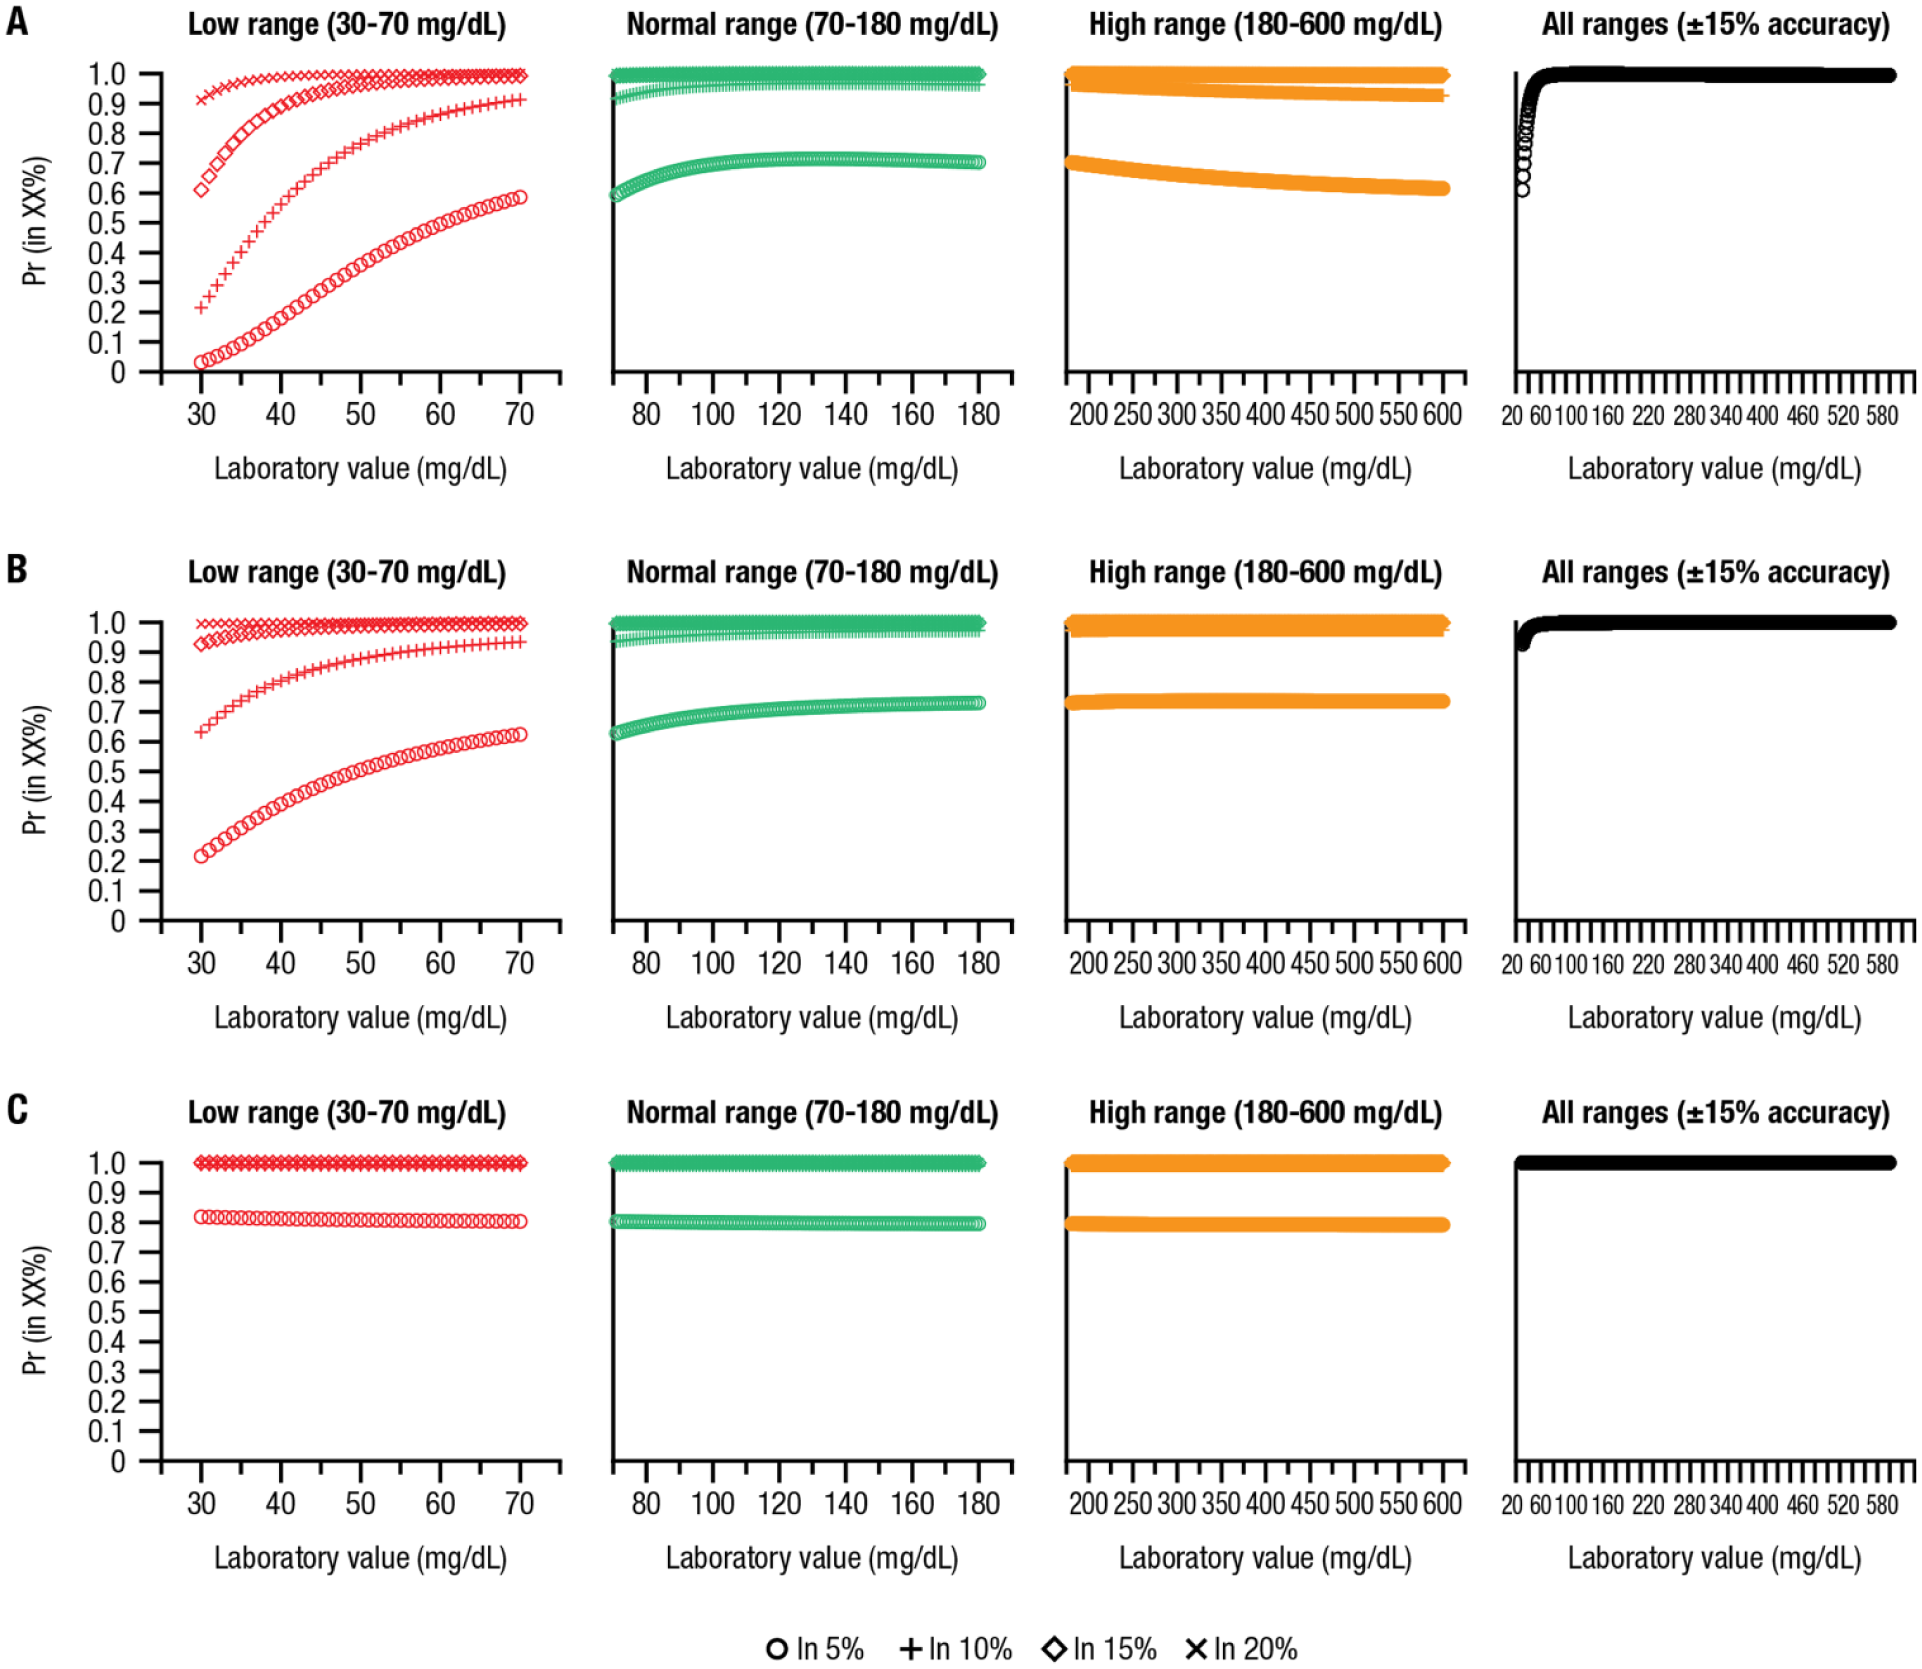
Curves showing probabilities of simulated BGMSs achieving accuracy within ±5%, ±10%, ±15%, and ±20% error rates compared with laboratory-derived values at low, normal, and high blood glucose ranges and of achieving ±15% accuracy across all ranges with (A) BGMS I (underperforming), (B) BGMS II (adequately performing), and (C) BGMS III (overperforming).
Accuracy Probability Curves Using Data From Real-World BGMSs
Using results from actual capillary fingertip blood glucose samples, accuracy probability curves and 95% lower confidence limits were generated for 3 different real-world BGMSs, anonymized as BGMS A, BGMS B, and BGMS C. The resulting curves show that all 3 real-world BGMSs met EN ISO 15197:2015 (ISO 15197:2013) accuracy criteria (ie, ≥95% of results). Specifically, 99.63% of results from BGMS A, 99.63% of results from BGMS B, and 99.81% of results from BGMS C are within EN ISO 15197:2015 (ISO 15197:2013) accuracy criteria. However, there was detectable variability between BGMSs (Figure 2). BGMS A (Figure 2A) showed the highest accuracy, as all values fell above the 95% probability line, indicating accuracy across the entire blood glucose range, while results from BGMS B (Figure 2B) and BGMS C (Figure 2C) showed reduced accuracy at low blood glucose ranges (<70 mg/dL). Furthermore, although 99.81% of results from BGMS C fell within EN ISO 15197:2015 (ISO 15197:2013) accuracy criteria, the accuracy was noticeably reduced for this BGMS at blood glucose values <50 mg/dL (Figure 2C).
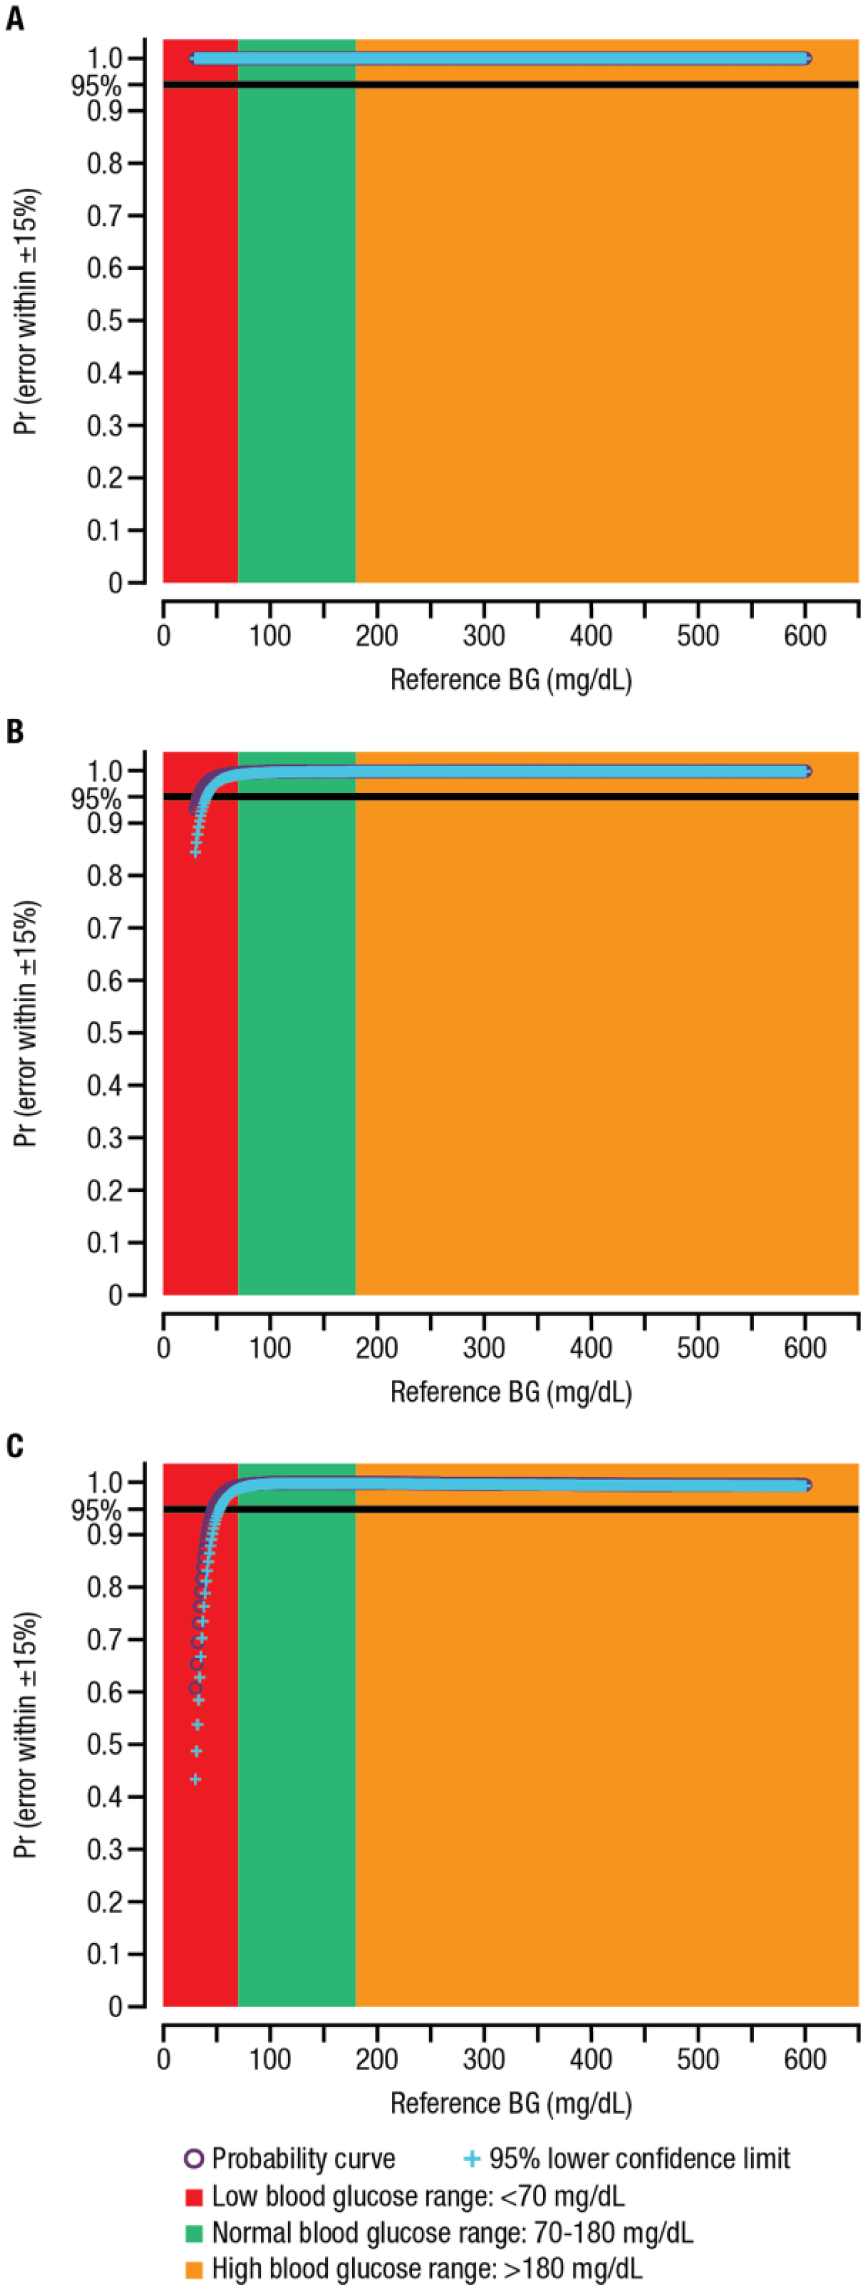
Probability curves for real-world BGMSs: (A) BGMS A, whereby 99.63% of results are within EN ISO 15197:2015 accuracy criteria; (B) BGMS B, whereby 99.63% of results are within EN ISO 15197:2015 accuracy criteria; and (C) BGMS C, whereby 99.81% of results are within EN ISO 15197:2015 accuracy criteria.a
Accuracy at Specific Blood Glucose Levels in Lower, Normal, and Higher Blood Glucose Ranges
We also assessed the proportion of blood glucose measurements that fall within 95% and 99% ranges at different specified blood glucose levels. Results for the 3 real-world BGMSs are summarized for the following blood glucose levels: 54.0 mg/dL (low) is summarized in Table 3; 72.1, 90.1, 126.1, and 162.1 mg/dL (normal) are summarized in Table 4; and 270.2, 405.4, and 540.5 mg/dL (high) are summarized in Table 5. Results for BGMS A and BGMS B revealed that the range of blood glucose values within the 95% and 99% ranges was always consistent with EN ISO 15197:2015 (ISO 15197:2013) accuracy criteria. For BGMS C, the range of blood glucose values within the 95% and 99% ranges was almost always compatible with EN ISO 15197:2015 (ISO 15197:2013) accuracy criteria, with the exception of the 99% lower limit of the 540.5-mg/dL sample, where the lower limit provided by the BGMS (459.1 mg/dL) was slightly out of the range of the EN ISO 15197:2015 (ISO 15197:2013) lower limit, which was 459.4 mg/dL.
Expected Ranges of Blood Glucose Values Derived From Regression Models of Real-World BGMSs (Low Blood Glucose Range).
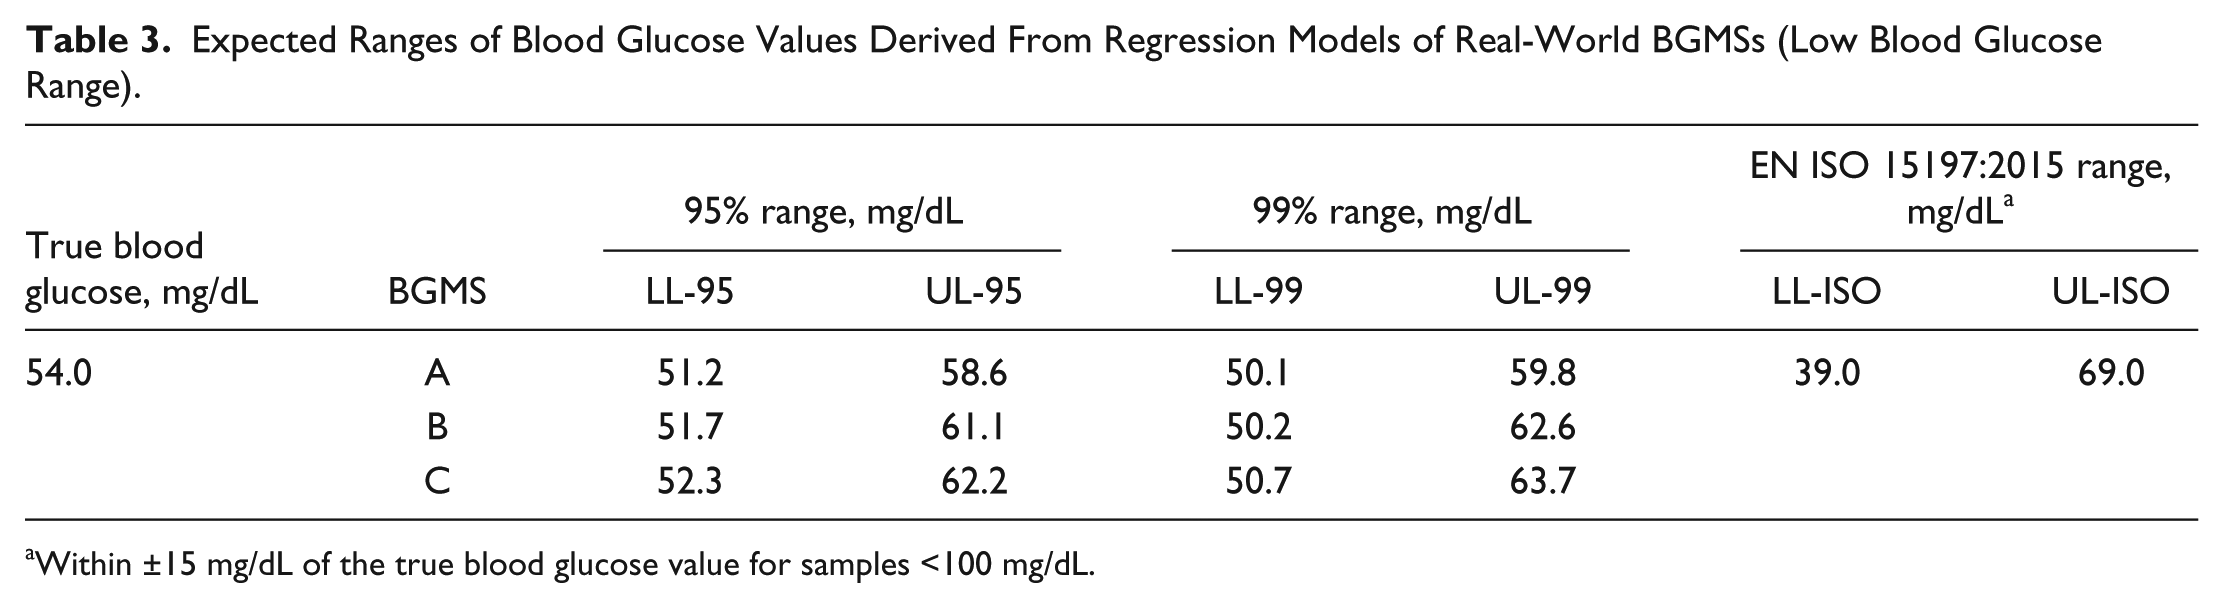
Within ±15 mg/dL of the true blood glucose value for samples <100 mg/dL.
Expected Ranges of Blood Glucose Values Derived From Regression Models of Real-World BGMSs (Normal Blood Glucose Range).
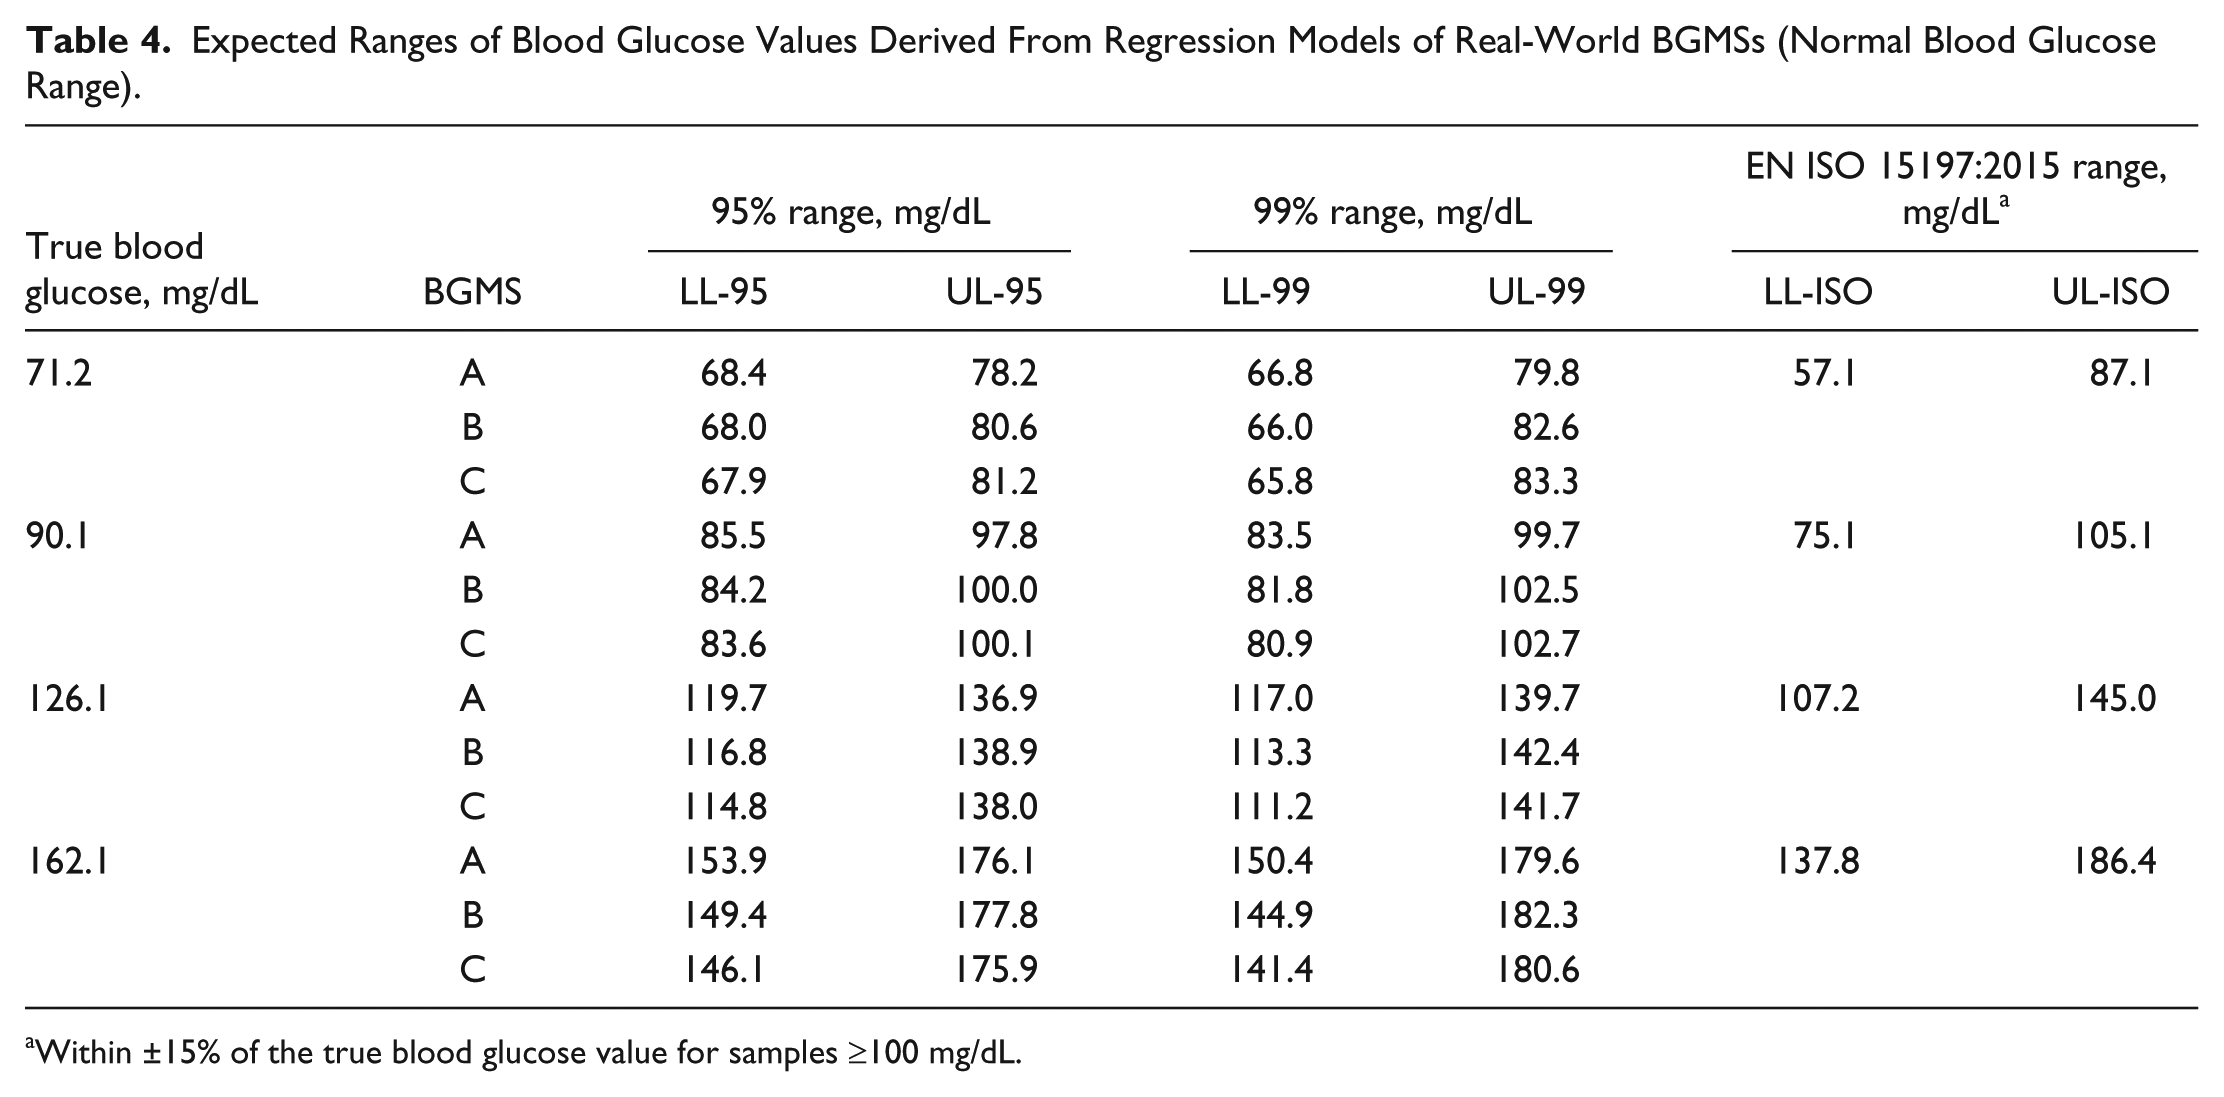
Within ±15% of the true blood glucose value for samples ≥100 mg/dL.
Expected Ranges of Blood Glucose Values Derived From Regression Models of Real-World BGMSs (High Blood Glucose Range).
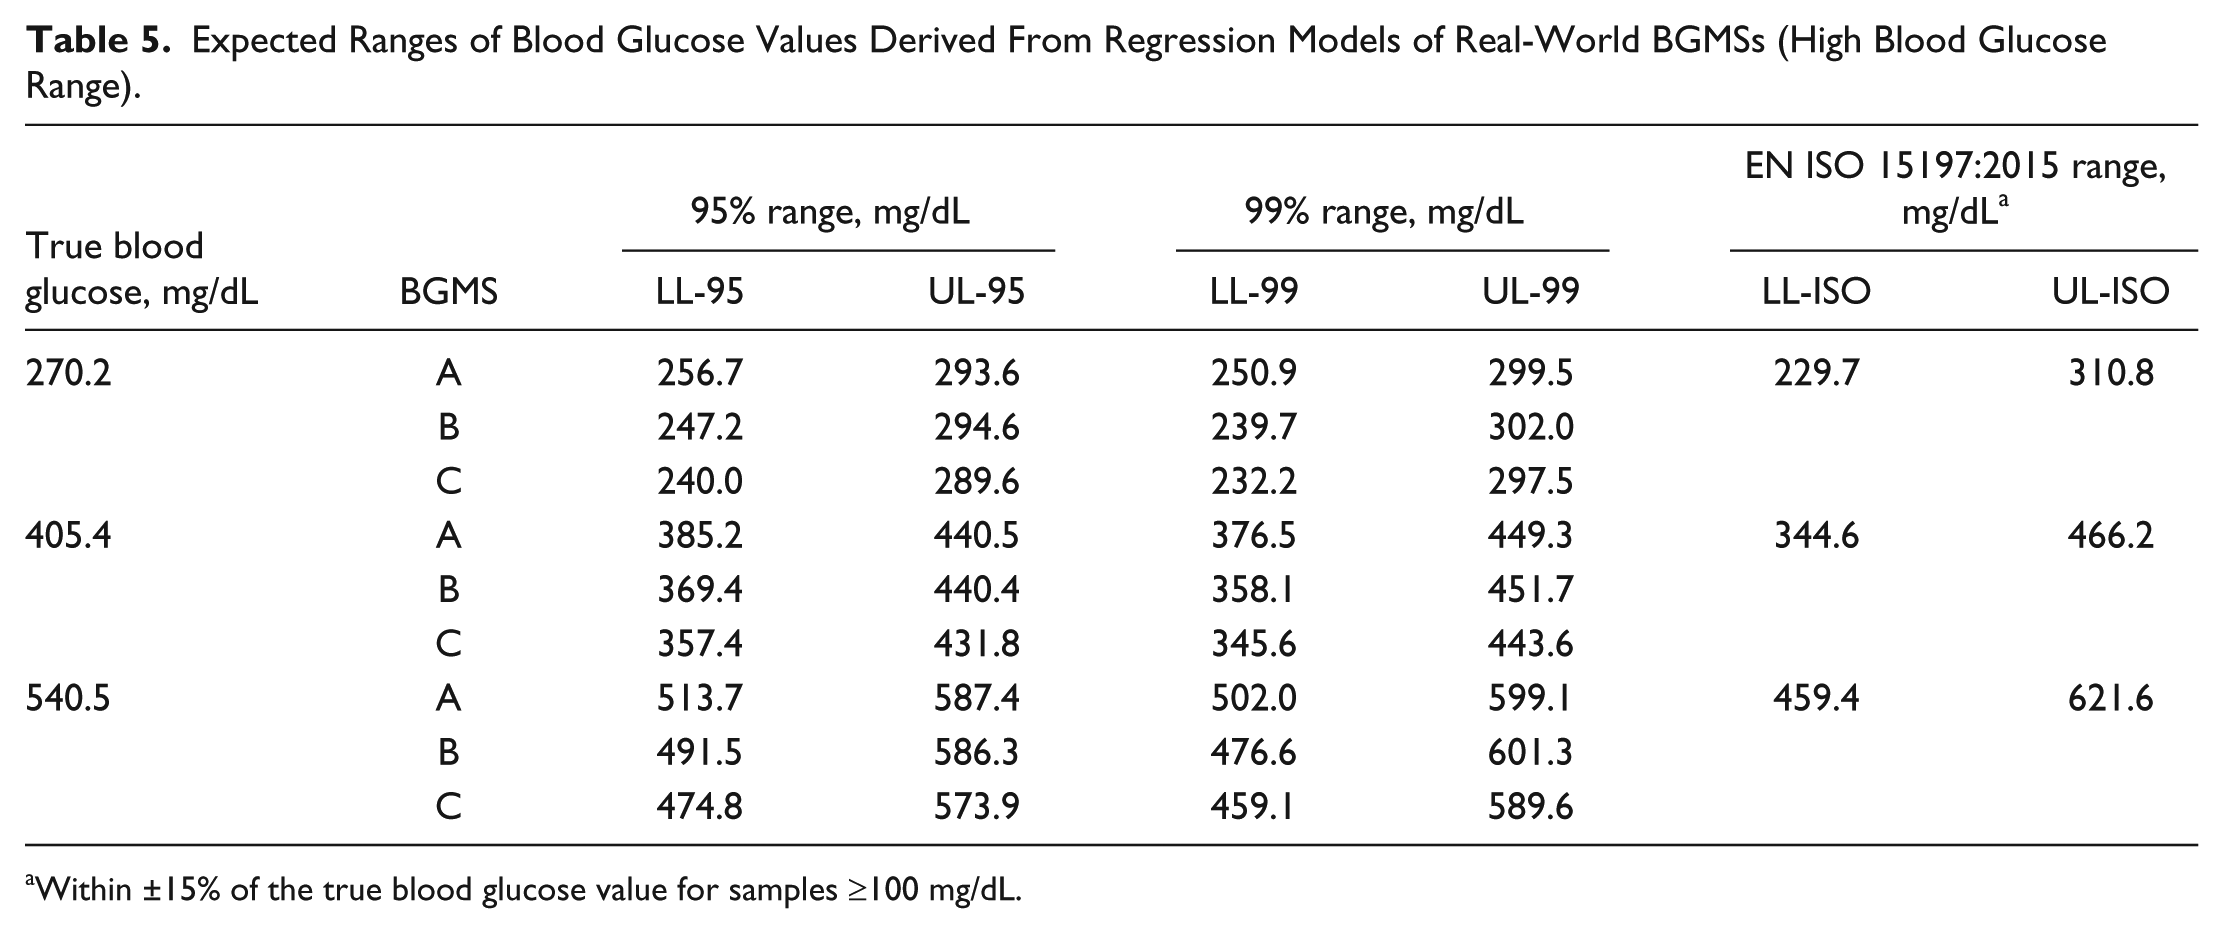
Within ±15% of the true blood glucose value for samples ≥100 mg/dL.
Discussion
The accuracy of BGMSs is clearly associated with risk of hypoglycemic events, 14 and the incidence of hypoglycemia may rise progressively as the magnitude of BGMS error increases. 15 If BGMS values are too high, users may overcorrect with increased insulin administration, resulting in hypoglycemia. In contrast, if BGMS results are too low, users may increase intake of readily absorbable carbohydrates to raise blood glucose, which may result in hyperglycemia and subsequent increases in HbA1c. 14 In addition, for people with diabetes who are treated by insulin and/or use insulin pumps, inaccurate glucose readings could lead to erroneous insulin dose calculations. Because of the dangers associated with hypoglycemia, 2 prevention of hypoglycemia is a primary concern for people with diabetes; therefore, accuracy requirements for BGMSs in the hypoglycemic range should be particularly stringent. 16
The least biased (or most accurate) blood glucose readings would support achievement of the lowest possible HbA1c and the least possible hypoglycemia, 17 which is an important goal of modern diabetes treatment and technologies. Current requirements for SMBG device accuracy, namely ISO 15197:2013, EN ISO 15197:2015, and the FDA 2016 criteria, do not guarantee stringency (eg, a 95% probability of obtaining an accurate result at a specific blood glucose concentration). The methodology proposed in the current study helps address these potential gaps and implications for diabetes management.
Results of our study demonstrated that, using a linear model of BGMS measurements as a function of laboratory results, curves can be generated to provide the estimated probability of a blood glucose value falling within any particular bounds at any blood glucose concentration within a specified range. The probability curves we generated showed that all 3 real-world BGMSs tested met EN ISO 15197:2015 (ISO 15197:2013) accuracy criteria and 95% lower confidence limits. Based on potential clinical implications of poor glycemic control, 2 we also examined the quality of blood glucose measurements in the hypoglycemic, euglycemic, and hyperglycemic ranges. 16 To that end, although all 3 real-world BGMSs met accuracy criteria, variability between BGMSs was identified in the low blood glucose range, as 2 BGMSs showed decreased accuracy when blood glucose levels were <70 mg/dL, and 1 BGMS showed noticeably reduced accuracy at blood glucose values <50 mg/dL. Such information about variabilities in BGMS accuracy is particularly useful, since small errors can have substantial consequences for patient-related outcomes—particularly where errors in the low blood glucose range can increase the risk of hypoglycemia and related sequelae.
It is important to note that the methodology reported here is not simulation based. It is a computational methodology that can be applied to any BGMS data set. In this paper, we demonstrate the application of this method to data from simulated BGMSs as well as actual clinical data from real-world BGMSs to illustrate how the method might elucidate error characteristics of various meters. In addition, our methodology does not modify the data set in any way; rather, it analyzes the data set to obtain additional information on BGMS performance. Our methodology allows one to better understand heterogeneity in sets of blood glucose data that already meet any analytical performance standard, such as the standards provided by ISO. This methodology can be used to expand our understanding of the data beyond the minimum threshold that passing a standard implies.
This article reflects a new approach to the analysis of populations of actual or simulated BGMS data. It is not an evaluation of any particular BGMS. In addition, assumptions were made to construct the probability curves, including normality of (signed) relative (percentage) difference, which is only an approximation/model.
Conclusions
Probability curves highlight the importance of BGMS accuracy at any given blood glucose concentration across the entire blood glucose range to achieve optimal glycemic control while avoiding hypoglycemia or hyperglycemia. Such curves can be used to elucidate potential ranges of blood glucose concentrations and reveal when BGMSs may not be as accurate as desired, even when aggregate EN ISO 15197:2015 (ISO 15197:2013) and/or FDA criteria are satisfied. This information may be especially significant in low blood glucose ranges where small errors in BGMS measurements can have substantial impacts on patient-related outcomes, including hypoglycemia risk.
Footnotes
Abbreviations
BG, blood glucose; BGMS, blood glucose monitoring system; CV, coefficient of variation; EN, European Norm; FDA, US Food and Drug Administration; HbA1c, glycated hemoglobin; ISO, International Organization for Standardization; LL, lower limit; Pr, probability; SMBG, self-monitoring of blood glucose; UL, upper limit.
Declaration of Conflicting Interests
The author(s) declared the following potential conflicts of interest with respect to the research, authorship, and/or publication of this article: SP and RMS are full-time employees of Ascensia Diabetes Care. DAS was an employee of Ascensia Diabetes Care during the development of the work reported here.
Funding
The author(s) disclosed receipt of the following financial support for the research, authorship, and/or publication of this article: These analyses were supported by Ascensia Diabetes Care, Parsippany, NJ. Medical writing assistance was provided by Allison Michaelis, PhD, of MedErgy, and was funded by Ascensia Diabetes Care.