
Abstract
Background:
Extensive past work showed that noninvasive continuous glucose monitoring with a wearable multisensor device worn on the upper arm provides useful information about glucose trends to improve diabetes therapy in controlled and semicontrolled conditions.
Method:
To test previous findings also in uncontrolled conditions, a long term at home study has been organized to collect multisensor and reference glucose data in a population of 20 type 1 diabetes subjects. A total of 1072 study days were collected and a fully on-line compatible algorithmic routine linking multisensor data to glucose applied to estimate glucose levels noninvasively.
Results:
The algorithm used here calculates glucose values from sensor data and adds a constant obtained by a daily calibration. It provides point inaccuracy measured by a MARD of 35.4 mg/dL on test data. This is higher than current state-of-the-art minimally invasive devices, but still 86.9% of glucose rate points fall within the zone AR+BR.
Conclusions:
The multisensor device and the algorithmic routine used earlier in controlled conditions tracks glucose changes also in uncontrolled conditions, although with lower accuracy. The examination of learning curves suggests that obtaining more data would not improve the results. Therefore, further efforts would focus on the development of more complex algorithmic routines able to compensate for environmental and physiological confounders better.
Diabetes is a widespread disease affecting 422 million people worldwide in 2014 according to a World Health Organization report. 1 It occurs when the glucose-insulin regulatory system fails to maintain glucose levels in blood within the euglycemic range of 70 ± 180 mg/dL, leading to long and short term complications. In this context, glucose sensors played a crucial role in the last years to improve diabetes management and therapy. Self-monitoring blood glucose (SMBG) sensors provided invasive and sparse glucose measures used to retrospectively analyze and adjust therapy parameters. 2 More recently, minimally invasive continuous glucose monitoring (CGM) sensors provided less invasive and almost continuous data, describing the dynamic of the system being measured and enabling further applications like the prediction of hypo- and hyperglycemic alarms, 3 the artificial pancreas for automatic control of glucose levels in blood,4,5 personalized lifestyle change suggestions to prevent long-term metabolic consequences, 6 and others.7,8 Noninvasive CGM (NI-CGM) sensors are the natural next steps in the evolution of CGM devices due to obvious reasons related to the wearer’s comfort. Many noninvasive technologies were proposed over the years to measure glucose noninvasively, among others optical, 9 electromagnetic, 10 as well as acoustic 11 and others.12-14 These technologies provide a characterization of the biological properties of the skin or biological fluids (like saliva 15 or tears 16 ) that can be used to track glucose changes with reasonably good accuracy in strictly controlled conditions.17-20 However, none of them provided point accuracy close to that of minimally invasive CGM devices under uncontrolled conditions. The reason being the latter measure in the sub cutis with an enzymatic sensor that is in contact with biological fluids containing glucose molecules, whereas NI-CGM devices measure skin characteristics modulated by glucose changes that are also sensitive to intrinsic (physiology related) and extrinsic (environment related) confounders. These non-glucose-related physiological confounders, like blood perfusion, sweating and orthostatic fluid shift as well as environmental ones, like temperature and humidity, must be measured and properly compensated to provide reliable and accurate glucose estimation also in uncontrolled situations typical of home use.21-24 The need for such a broad characterization of phenomena lead to the development of the multisensor concept, where glucose and non-glucose-related sensors are embedded within the same device. 20 An algorithmic routine is then necessary to properly combine the measured channels for a robust estimation of glucose values. Mechanistic models relating multisensor channels and glucose are not yet available due to the complex nature of physiology in skin and underlying tissues and interaction among the aforementioned phenomena. For this reason, black-box statistical models were used previously.20,25,26 The bespoken challenges cause point accuracy of NI-CGM devices to be not yet at the same level as their minimally invasive counterpart. However, glucose rate of change has shown to be estimated with reasonably good accuracy and can be used as adjunctive information to SMBG reading to judge the risk associated with hypo- and hyperglycemic events in controlled or semiuncontrolled conditions.26,27
The aim of this article is to report on the performance of algorithmic routines developed to analyze data from a long-term study with a wearable multisensor device for NI-CGM, showing how models developed for controlled and semicontrolled conditions are essentially still valid but require further effort to cope with unexpected events in the data typically met in uncontrolled conditions.
Methods
Study Population
Of the 23 subjects initially enrolled in the study who signed an informed consent agreement, 2 completed only block A (see Study Design section ) and were thus excluded from the study and 1 withdrew before starting.
A total of 7 female and 13 male patients of Caucasian origin with type 1 diabetes, 38 ± 13 years (mean ± SD), BMI 24.1 ± 3.0 kg/m2, duration of diabetes 17.0 ± 13.0 years, HbA1c 7.5 ± 0.9%, completed this study. The study was performed in accordance with Good Clinical Practice (GCP) and the Declaration of Helsinki.
Over the entire study there were 1072 accepted and a total of 191 excluded study days (runs) respectively, which represent 15% of all runs.
Study Design
After the screening visit, patients completed an in-clinic study day (block A) to be introduced to the device and get trained in the operation of the entire set up. Patients were then sent home and collected each a total of ten home-use days (block B). Patients returned for another three in-clinic days (block C), including two nights. While in the clinic, blood samples were taken routinely by the study personnel via an inserted venous catheter for blood glucose reference measurement using a HemoCue Glucose 201+ (HemoCue, Sweden) every 10 to 20 minutes. In parallel patients were performing regular SMBG via finger pricking and blood sampling, using a Ascensia Contour BMG (Bayer, Switzerland).
During the entire study, patients were noting down insulin dosing, activity levels or special events using a dedicated log book tool installed on the personal digital assistant (PDA).
After completion of the three in-clinic days (block C), patients returned home to perform at least another 20 study days under regular home use conditions during a period of 6-12 months (block D).
Multisensor System
The design and validation of the multisensor concept used in this study has been extensively reported previously.28-34 To characterize the biophysical properties of the skin and underlying tissues as well as the detrimental effects, the multisensor embeds a mix of dielectric spectroscopy (DS) and optical modules, as well as temperature, humidity, and sweat sensors. Finally, to measure motion effects, a 3-axes inertial sensor is implemented. Dielectric properties of the skin are investigated in the frequency range 0.1-200 MHz with three electrodes of different size to sample different penetration depths, in the 1-200 KHz range with one electrode and in the 1-3 GHz range with two additional grounded coplanar waveguides. Optical properties are measured with 2 entities of 3 LEDs, each at 3 different wavelengths: green (568 nm), red (660 nm), and infrared (798 nm).
All channels are sampled every 20 seconds and data transmitted via Bluetooth connection to a PDA and finally downloaded to a PC together with all other reference data.
Data Analysis Procedure
Figure 1 shows the block diagram of the data processing routine used to evaluate the multisensor data and the data required at each stage. The algorithm is designed to work prospectively and in real-time once it is tuned during the training phase.
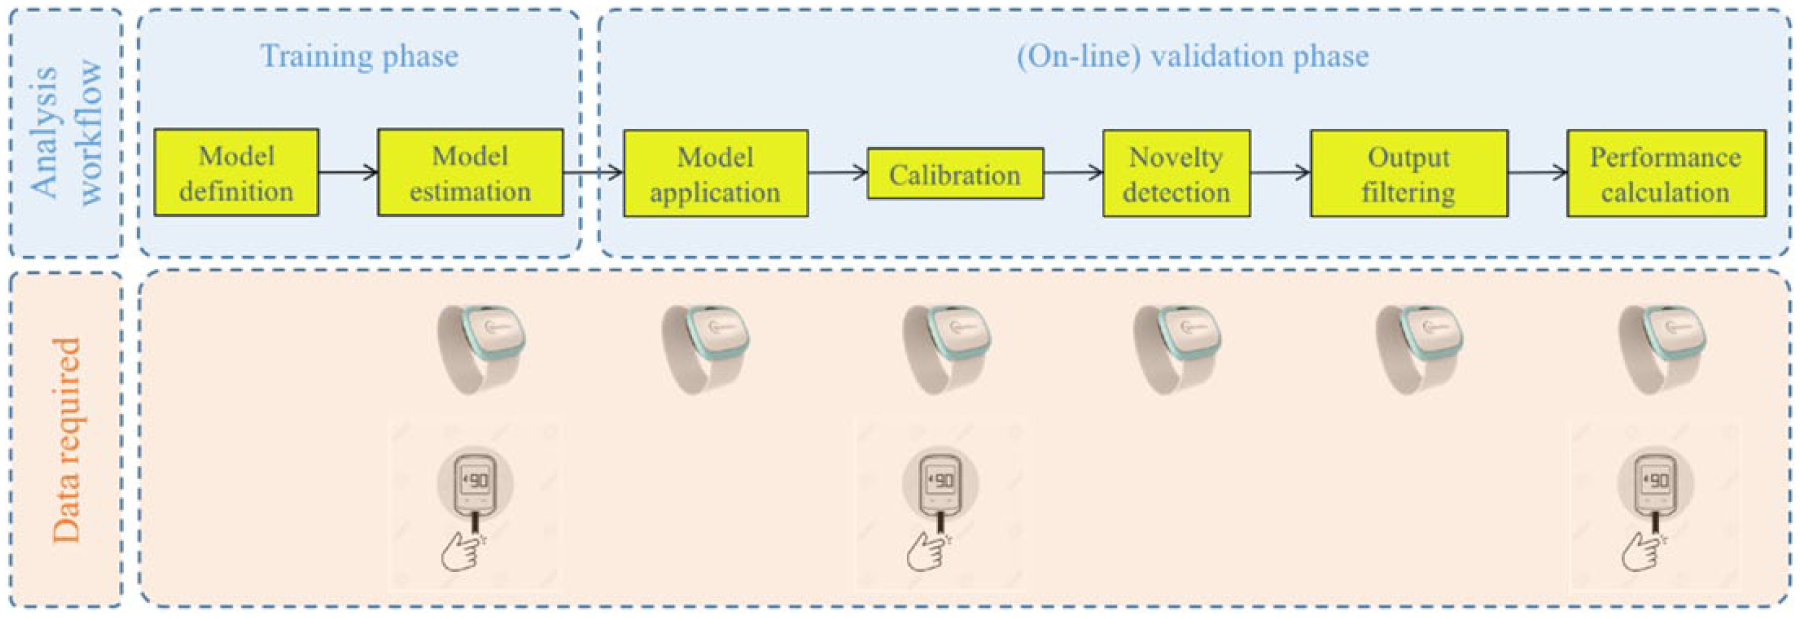
Block diagram of data processing and data required at each step (multisensor and reference BG).
Model Definition
The complex nature of the physiological system being measured and the interaction with perturbing effects support the hypothesis that measured data describe a nonlinear dynamical system, for example, the dermal blood volume variations as a function of thermoregulation.35,36 The internal working principles for such processes are typically expressed by mechanistic models. 37 However, for our problem these models have not yet been developed. We therefore use the multiple linear model:
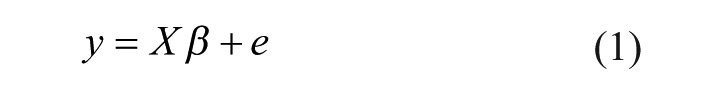
where
Model Estimation
The multisensor system used in the study is based on DS sensors that provide dielectric properties of the skin as a function of the frequency, leading in practice to a high dimensionality of the measurement space and to high correlation among subsets of variables. The problem of estimating
The available data from blocks A, B, C, and D are split into a training set (blocks A, B, and C) used to estimate the model and a test set (block D) to test the global model on an independent set of data not seen during the model derivation stage. 38
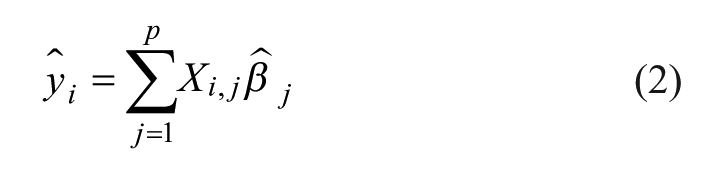
Model Application
Once the parameter vector
Calibration
Previous work showed that device calibration during the manufacturing phase causes differences among multisensor devices to be negligible. 39 As can be seen in Figure 2, the clustering of the DS sensor data is due to subject specific differences. To deal with these differences, an additional degree of freedom to adjust the baseline to each subject is required. Thus, a constant is added to all estimated BG values of an individual. Here, the constant is derived from a single calibration value: The first reference BG value available after the adaptation period of 75 minutes which is in the range [70, 300] mg/dL and for which the estimated glucose rate is not rapidly changing, that is, is within –2,2 mg/dL/min. is obtained. The constant is chosen to make the estimated BG value equal to it. 40
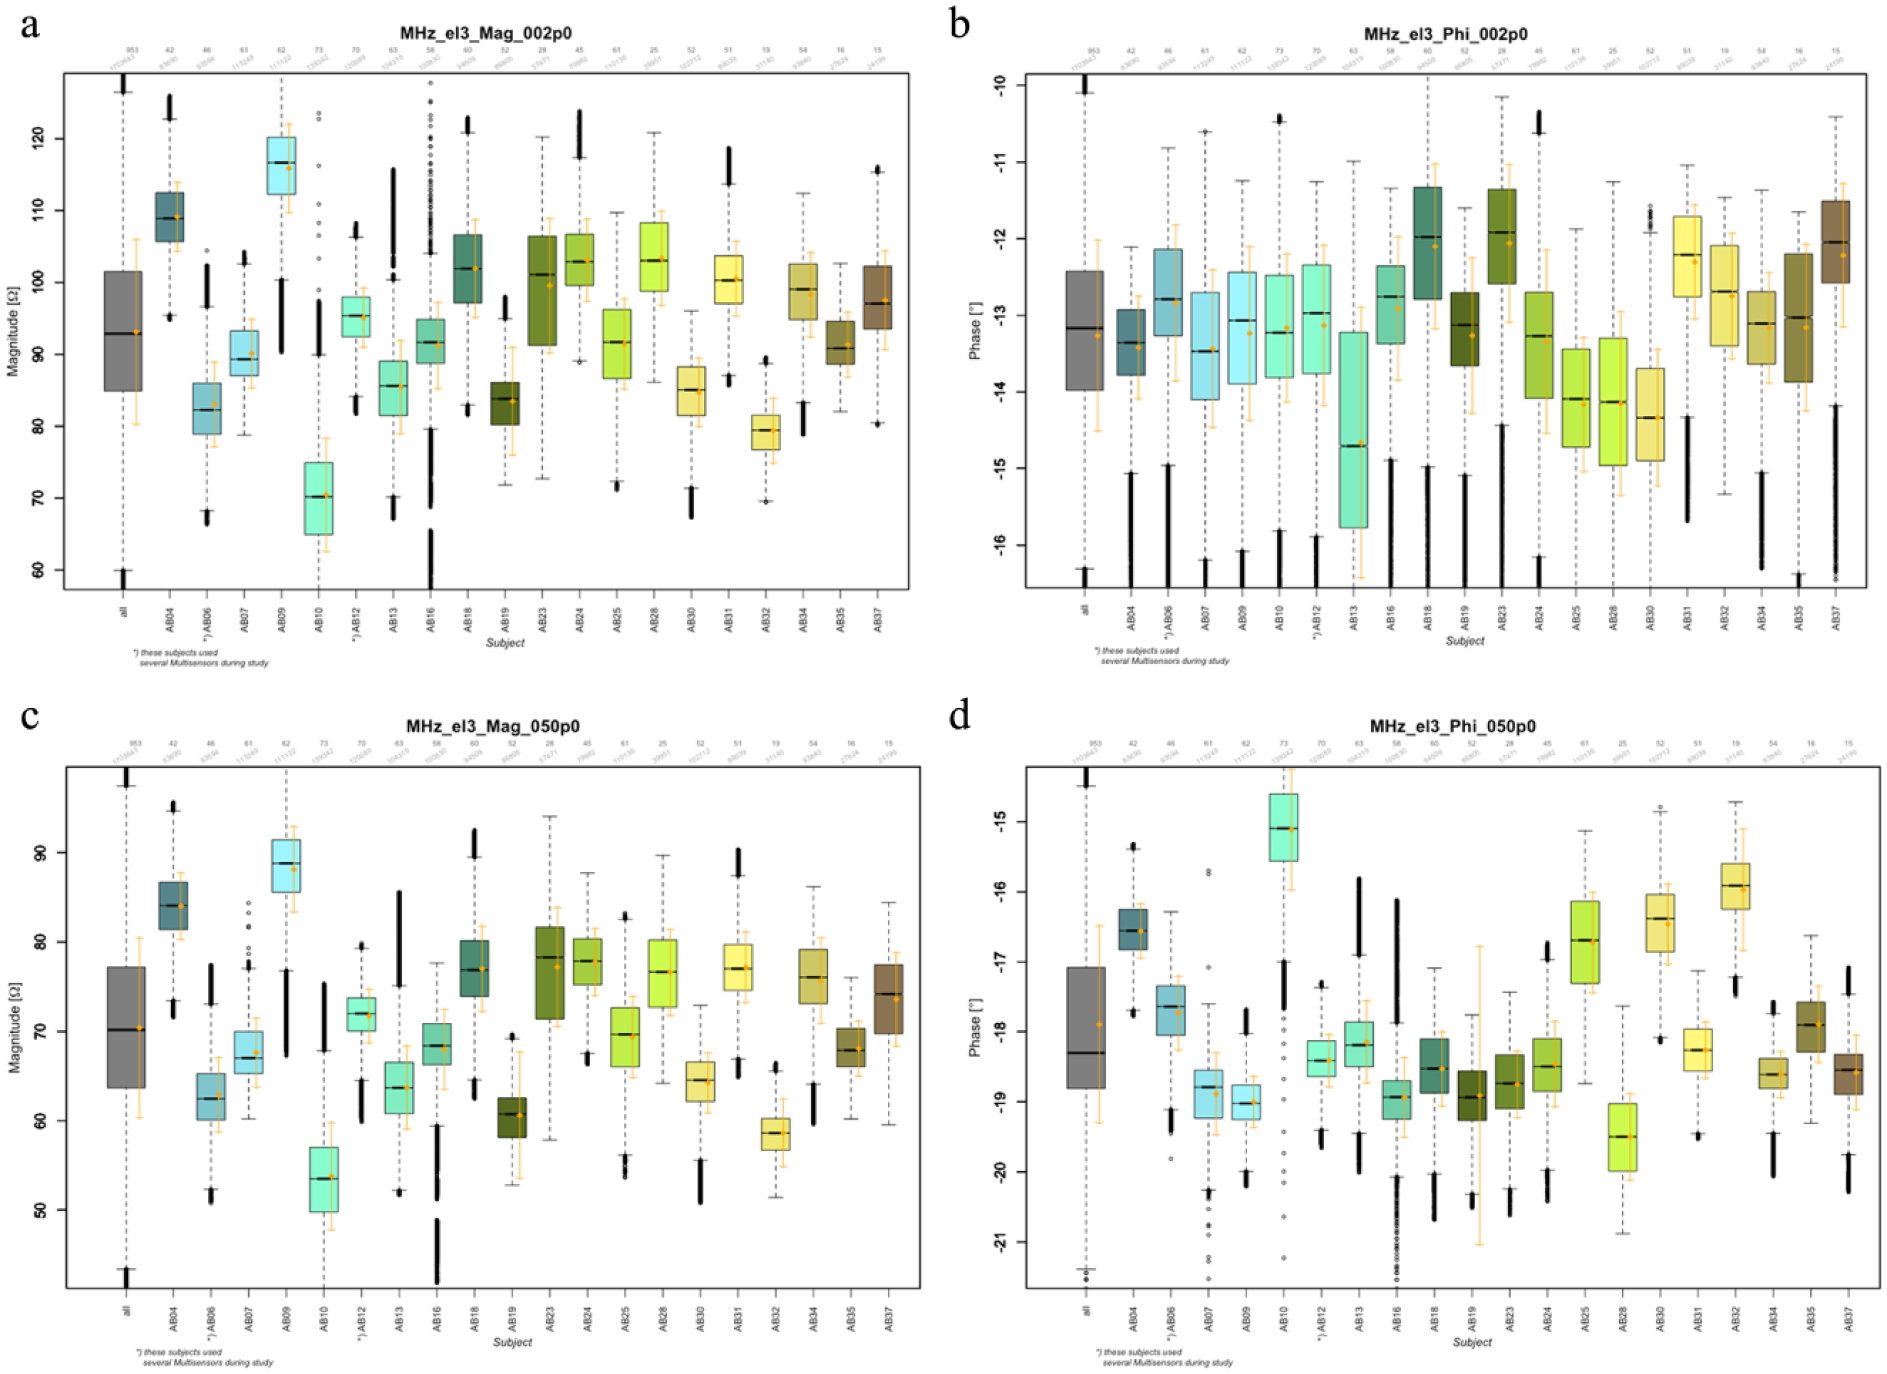
Boxplots of signal distribution for two channels (2 and 50 MHz, a, b and c, d respectively) measured with the long electrode and parametrized by magnitude (a, c) and phase (b, d). Mean and standard deviation are also given (orange). Given over all patients/devices (gray) and per patient/device. One device per patient, except AB06 and AB12 that used several devices.
Novelty Detection
In uncontrolled conditions met in daily life situations unexpected events can influence the multisensor channel data and deteriorate the accuracy of glucose estimates because they were not visible in the training data and thus not properly compensated. The novelty detection module in cascade to the calibration stage monitors the multisensor channels and makes sure the data are within the boundaries of applicability of the model. If the module recognizes a data behavior associated with a situation it does not know how to handle properly it raises a flag, waits for 30 minutes during which glucose is not displayed, and asks for a new calibration. Describing in details the functioning of the novelty detection module is out of the scope of the present article, but we will give a brief overview. The approach consisted of training an artificial network classifier to detect situations which were manually flagged as exceptions on the basis of features describing the distribution of the data as well as from the so called innovation, that is, the difference between what the system should be doing and what is actually doing.
Output Filtering
When the estimated BG value leaves the range of 30,400 mg/dL, the estimate is suppressed for the following 30 minutes and restarted only when a new reference BG value is available for a new calibration.
Performance Calculation
Glucose values estimated by the “multisensor + algorithm routine” ensemble is compared against BG data and the accuracy measured with a set of indicators widely used in the diabetes community.
Statistical metrics
We consider the mean absolute difference (MAD), indicating how much estimated glucose values are lower or higher than the reference:
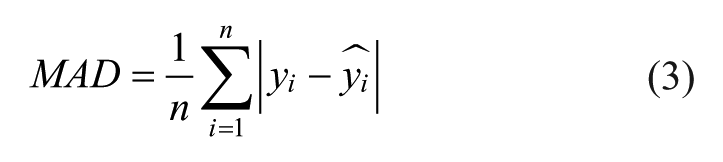
and the mean absolute relative difference (MARD), which characterizes the relative errors (in %) of the estimated glucose:
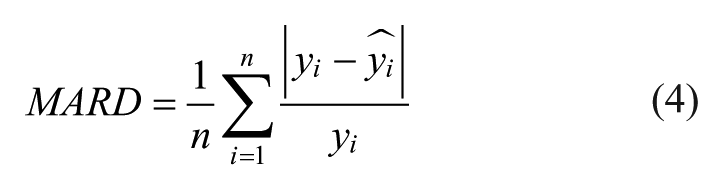
where
Metrics related to clinical relevance
Finally, a popular method used in the diabetes community to judge the point accuracy of glucose sensors is the Clarke error grid (CEG) proposed by Clarke and coworkers. 41 The scatterplot of BG as estimated by the model and SMBG values is broken down into five regions labelled A to E, see Clarke et al 41 for definition. The most dangerous situations are those where estimated glucose values fall into zones C/D/E because, from a clinical point of view, they will lead to unnecessary or even wrong and potentially dangerous treatments. An evolution of CEG developed for CGM sensors is the rate error grid (REG) that measures the accuracy of estimated glucose trends with analogous regions labelled from AR to ER; see Clarke et al 42 for details.
Results
Internal Validation
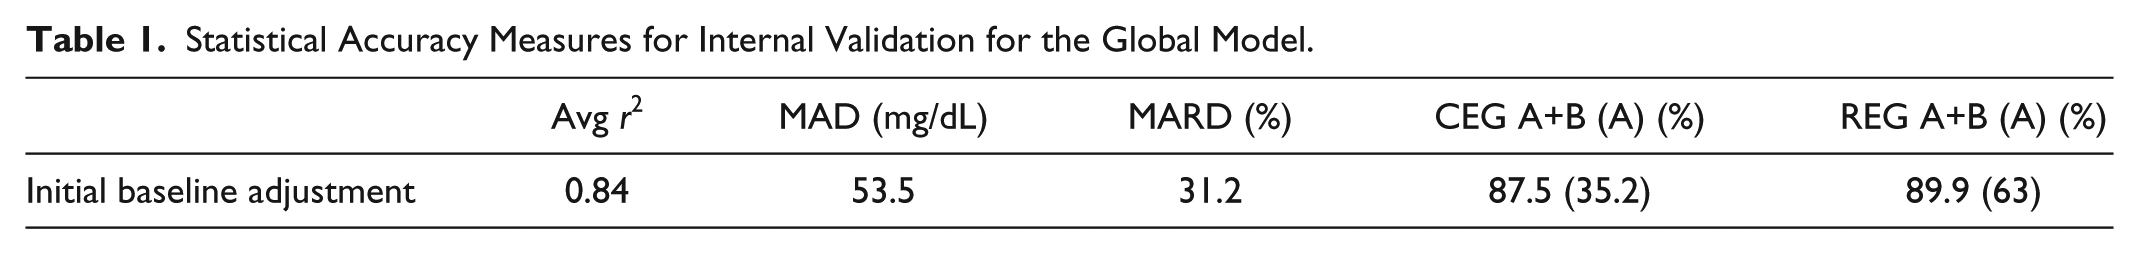
Figure 3 and Table 1 collect the accuracy results when the global model estimated on the training data set is applied to the same data with an initial adjustment of the baseline.
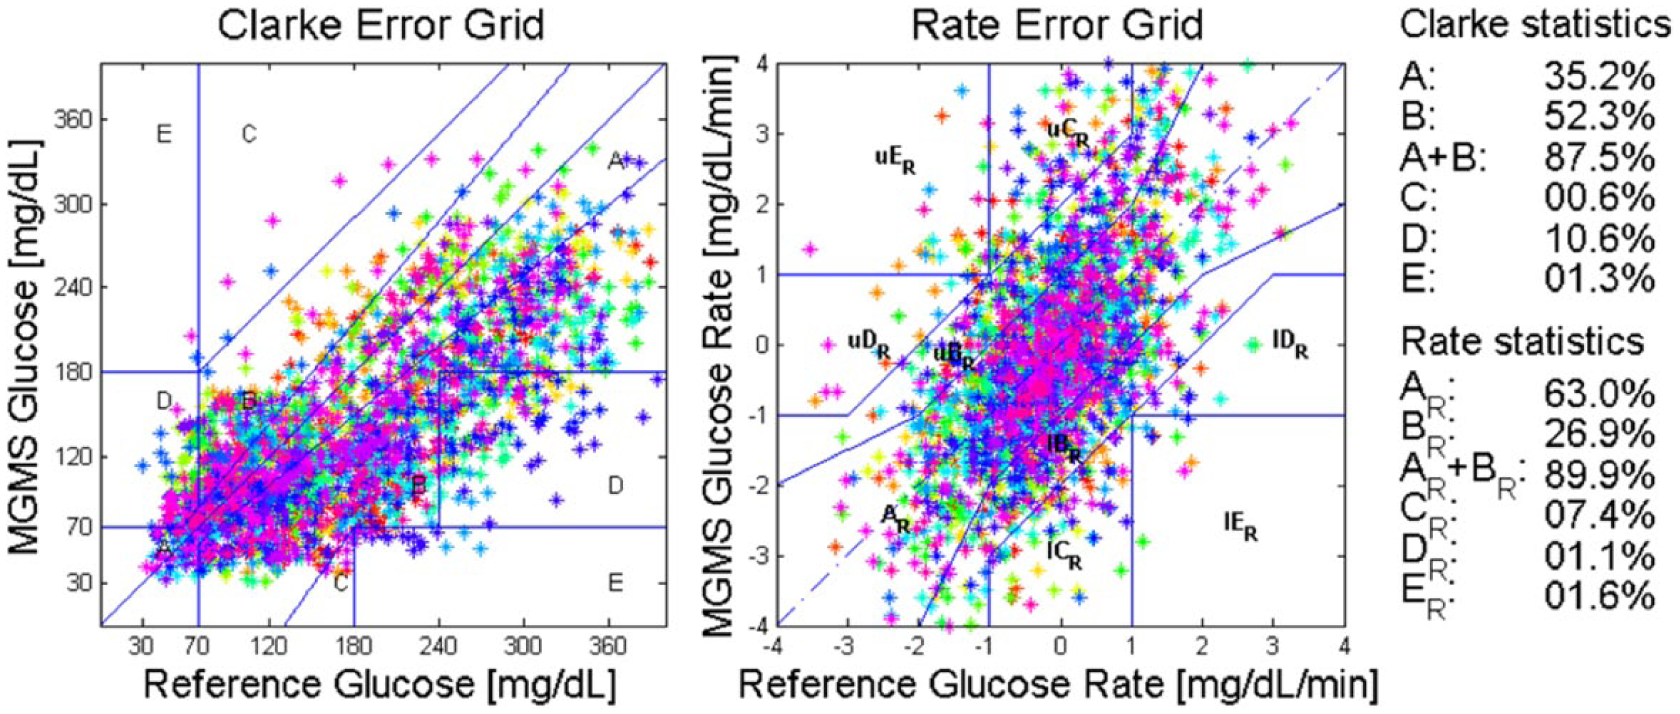
Internal validation results in terms of the CEG (left) and the REG (right). Colors correspond to subjects.
Statistical Accuracy Measures for Internal Validation for the Global Model.
External Validation
Figure 4 shows the results for the CEG and the statistics regarding the number of points falling in the different zones. The REG, measuring accuracy of estimated glucose trend, is not available because the reference sampling SMBG needed to calculate reference trend values is too sparse since by protocol the subjects were instructed to collect 10 SMBGs during the day at home.
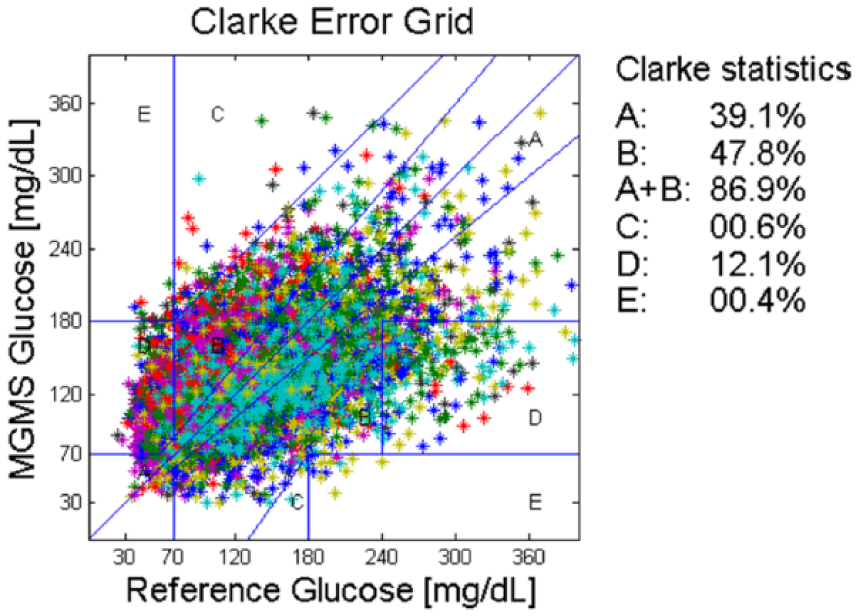
External validation: CEG for block D. Colors correspond to subjects.
Table 2 reports on the results obtained after each stage of the algorithmic routine. Calibration at stable glucose levels instead of calibration after 75 min reduces the MAD of about 50%, and further improvements are achieved when monitoring multisensor channels for unexpected events and filtering the output.
Performance Summary for External Validation on Block D for the Global Model Estimated on Blocks A, B, and C.
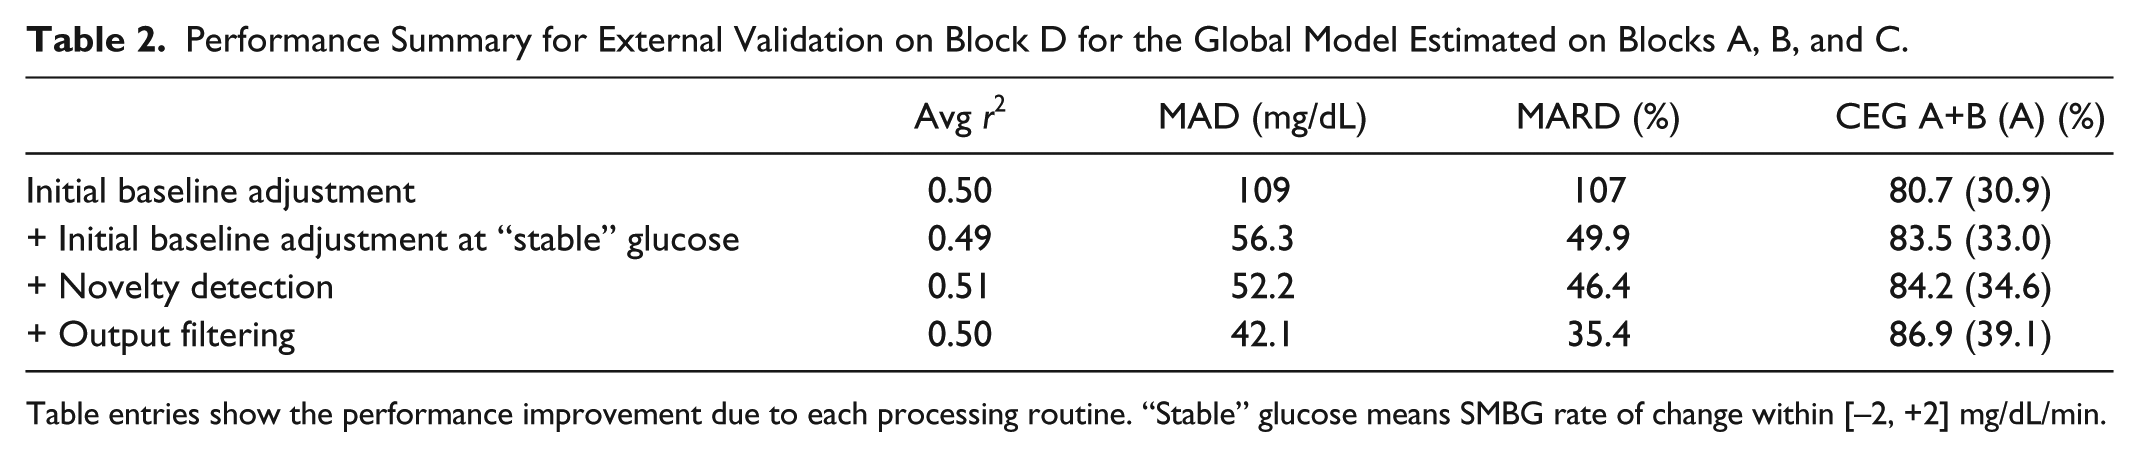
Table entries show the performance improvement due to each processing routine. “Stable” glucose means SMBG rate of change within [–2, +2] mg/dL/min.
Overall, the point accuracy for an externally validated, on-line compatible, global model in uncontrolled conditions is lower than under controlled or semicontrolled conditions (global model MAD 29.8 mg/dL, MARD 21.1 mg/dL 39 ), likely due to perturbations not yet properly compensated.
Discussion
External validation results show that point accuracy of the NI-CGM multisensor device is not at the same level of minimally invasive ones, for example, recently showing single digit MARD value of 9%. 43 Understanding possible directions for improvement is essential to shrink the accuracy gap and provide a noninvasive technological solution that can be used to improve diabetes therapy. For instance, learning curves are used to analyze the bias-variance tradeoff when estimating models from data. 38 The bias component of the error indicates whether or not the model is complex enough to capture the complexity of the data, whereas variance of the error indicates if the model can generalize well over unseen data, that is, it is overfitting. Figure 5 shows the root mean squared error (RMSE) used to evaluate the difference between model estimates and reference data as a function of the training data available expressed by the number of subjects included in the training set (to take into account also intersubject variability). When only few subjects are used, the training error is small because data are overfitted but the model cannot generalize on unseen data leading to big test error. As soon as the number of subjects in the training set increases the training error increases because it becomes harder to fit the data but the model will generalize better over test data (lower test error). Eventually, the train and test learning curves converge indicating the model is not overfitting anymore, that is, the model has low variance. However, train and test curves converge to RMSE value between 40-50 mg/dL indicating that the current model has a high bias and more data would not help in this case, but rather this suggests that more complex or partially adaptive models should be used to properly combine multisensor channels to account for cofounding factors and intersubject variability.
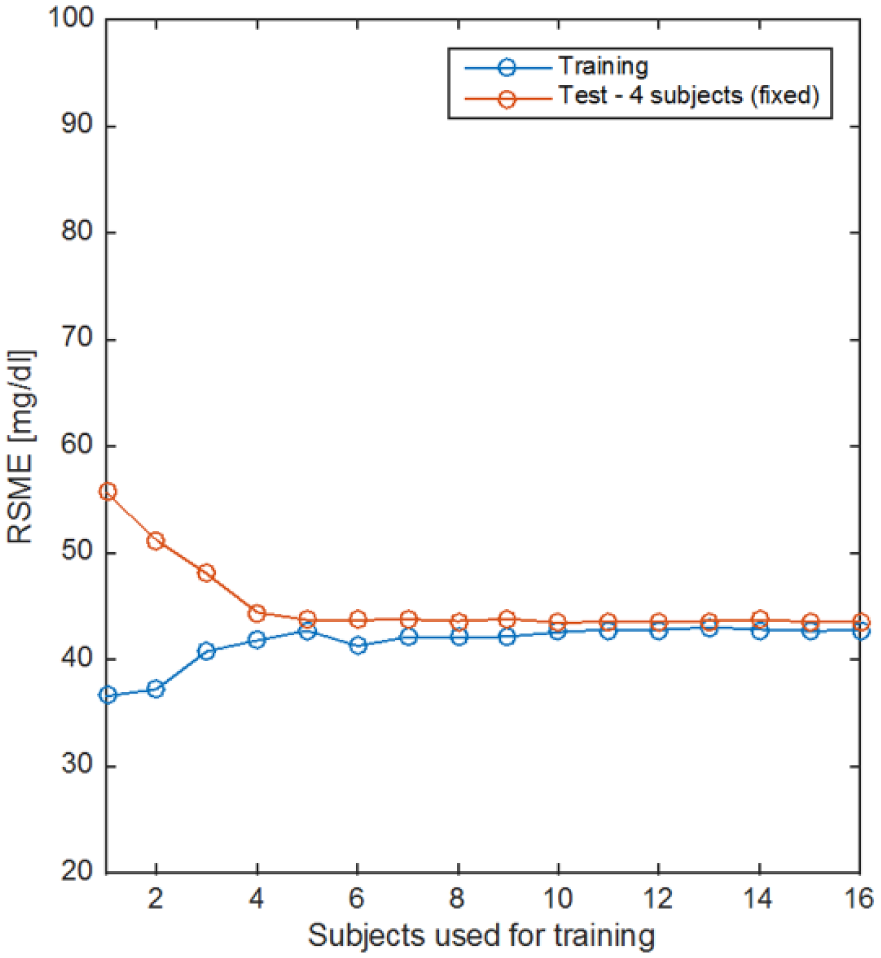
Learning curves for the linear model in equation 1. Train (blue) and test (red) error curves as a function of the amount of subjects’ data used for training.
Conclusions
In this work we reported some of the findings and challenges we met in a long-term study with a wearable multisensor device for NI-CGM in uncontrolled conditions at home. The goals of the study were to collect data over a long period of time, including different seasons, temperature range and climate conditions to test and to further develop the algorithms used previously in controlled and semicontrolled settings for NI-CGM. A data set of 1072 runs from T1D patients is now available including data from the multisensor as well as SMBGs and log books with meals, insulin and activity. As can be seen in Figure 2, data show the expected subject-/device-specific characteristics as in previous work. 39 Point accuracy is reduced in uncontrolled versus controlled conditions 39 and is not yet comparable to that of minimally invasive CGM but glucose rate performance in data blocks A and C as measured by the REG shows that 63% of the points are in AR zone and almost 89.9% of the points are within zones AR+BR. This result opens long-term possibilities to use NI-CGM devices to applications specifically developed after the advent of CGM devices, for example, scoring of hypo- and hyperglycemic events 44 and suggestions for insulin dosing adjustments.45,46
The analysis showed that the multisensor system is sensitive to glucose changes in all patients but some unexplained sources of error still persist. This can be explained with the assumptions about the model used, linear and static, that cannot capture the complexity of the measured physiological process and their interactions that are nonlinear and dynamical. This is also corroborated by the learning curve analysis that suggests more data would not help. It seems that uncontrolled conditions of daily life are not yet modelled adequately. Therefore, more complicated modelling techniques could be applied to further compensate complex perturbing effects met in uncontrolled conditions. Such models might be nonlinear or adaptive in the parameters models 38 or better reflect knowledge of the system.47,48
Footnotes
Acknowledgements
Thanks to various people from former Solianis Monitoring AG and to dedicated international partners for their solid contributions that allowed expanding on the understanding of underlying mechanisms and characterization of phenomena related to noninvasive glucose monitoring.
Abbreviations
BG, blood glucose; CEG, Clarke error grid; CGM, continuous glucose monitoring; DS, dielectric spectroscopy; MAD, mean absolute difference; MARD, mean absolute relative difference; NI-CGM, noninvasive CGM; PDA, personal digital assistant; REG, rate error grid; RMSE, root means squared error; SMBG, self-monitoring blood glucose.
Declaration of Conflicting Interests
The author(s) declared no potential conflicts of interest with respect to the research, authorship, and/or publication of this article.
Funding
The author(s) disclosed receipt of the following financial support for the research, authorship, and/or publication of this article: This work was supported by Solianis Monitoring AG.