
Abstract
Background:
Postprandial hyperglycemia poses a challenge to closed-loop systems. Dipeptidyl peptidase-4 (DPP-4) inhibitors, like sitagliptin, reduce postprandial glucose concentrations in patients with type 2 diabetes. The objective of this study was to assess sitagliptin’s role in type 1 diabetes (T1DM) as an adjunct therapy in reducing postprandial blood glucose with an insulin-only closed-loop system.
Methods:
This was a randomized, double-blinded, placebo controlled, crossover design trial. The participants were18-35 years old, had T1DM, and an HbA1c of ≤ 8.5%. A dose determination study included eight subjects with T1DM. There were three study visits. Four hours after receiving study drug (placebo, sitagliptin 50 mg, sitagliptin 100 mg), subjects underwent a mixed meal tolerance test with assessment of hormone concentrations. In a second study, 15 subjects underwent two visits receiving either placebo or 100 mg of sitagliptin plus an insulin only closed-loop system for 25 hours with timed meals. Blood glucose and other hormone concentrations were analyzed using repeated measures ANOVA.
Results:
For the dose determination study, sitagliptin 100 mg resulted in reduced postprandial blood glucose (P = .006). For the closed-loop study, glucose concentrations were lower in the treatment group, most prominently during the first two study meals (P = .03). There was no difference in glucagon concentrations, but insulin concentrations and insulin delivery were lower in the treatment group.
Conclusions:
Sitagliptin may be considered as an adjunct therapy in a closed-loop setting. Larger studies are needed to determine the role of oral agents like sitagliptin to lower postprandial hyperglycemia with closed loop.
Diabetes leads to significant mortality and morbidity worldwide 1 and the mainstay of treatment for T1DM at this time is insulin. 1 Despite the lack of therapeutic options for T1DM there have been technological advancements made for improving blood glucose (BG) control including continuous glucose monitoring (CGM) and insulin pump therapy. 2 However, it is still difficult to achieve BG goals without causing hypoglycemia, 1 often partly due to elevated postprandial glucose. Elevated BG levels over time have a role in predicting cardiovascular disease, retinopathy, and nephropathy. 3
Incretin hormones including glucagon-like peptide 1 (GLP-1) and gastric inhibitory polypeptide (GIP) play an important role in regulation of insulin and glucagon. GLP-1 is released from the L-cells in the duodenum and jejunum during feeding causing augmented insulin secretion and decreased glucagon secretion. However, incretins have limited activity because of their short half-lives and rapid degradation by the enzyme DPP-4.4,5
Given the importance of these hormones, treatment strategies to include them can be utilized for improved glycemic control. Pharmacotherapies include GLP-1 agonists, which are resistant to degradation, 6 and DPP-4 inhibitors, such as sitagliptin. 7 Sitagliptin is a second line agent to treat type 2 diabetes (T2DM) and the dosing range is from 25 mg to 200 mg daily. 8 Improvement in postprandial BG is noted in patients taking sitagliptin with T2DM,9,10 with average Hemoglobin A1c (HbA1c) improvement of 0.5-0.8%. 11 Its effect on lowering postprandial BG concentrations may be due to decreasing glucagon release.12,13 It can be taken orally with good bioavailability 14 with a low risk of hypoglycemia 15 and weight neutral effects. 16
A closed-loop (CL) system utilizes a computer algorithm enabling automatic insulin delivery in patients with T1DM. The algorithm depends on glucose concentration and trend, with increased delivery during times of hyperglycemia; and insulin shut off during times of hypoglycemia. This is a reactive system and due to delay in absorption and action of insulin, postprandial hyperglycemia can be a challenge. 17 Therefore, drugs targeting endogenous incretin hormones could be ideal adjunctive therapies in this setting. We therefore hypothesized that sitagliptin would be an excellent adjunct therapy for use with the CL system in subjects with T1DM to reduce meal related hyperglycemia.
Methods
Both the dose determination and CL studies were randomized, double-blinded, placebo controlled, crossover design trials; approved through Albert Einstein College of Medicine Institutional Review Board (IRB) and the latter also through Food and Drug Administration (FDA) (investigational device). Investigations were carried out according to the Declaration of Helsinki. Both studies were registered on clinicaltrials.gov with the following numbers: NCT01530178, NCT02328040.
Recruitment: Patients were recruited from diabetes clinics, via fliers, and online postings on clinical trial sites. Inclusion criteria for the dose determination study, subjects were 18-30 years old with HbA1c less than or equal to 9%. For the CL study, subjects were 18-35 years old with HbA1c less than or equal to 8.5% and were required to be on insulin pump therapy. For both, subjects had T1DM for at least one year without concomitant illness, other than controlled hypothyroidism. Exclusion criteria included lactating and pregnant women, anemia, elevated creatinine, or alcohol/substance abuse (CRAAFT questionnaire), 18 taking medications which could affect BG, history of QTc prolongation, use of acetaminophen and vitamin C, sensitivity to 5-HT3 receptor antagonists or known allergy to sitagliptin. For CL, additional exclusions included a history of major hypoglycemic event in the last year or a history of pancreatitis.
Screening Visit
Screening consisted of obtaining an informed consent followed by history, physical examination and blood draw for CBC, lipase, amylase, serum creatinine, HbA1c and serum HCG in females. Blood draws were repeated at the start of each study visit. Randomization occurred at pharmacy and a randomization sheet was created through an online randomization program (Randomization.com). 19 Investigators as well as participants were masked to the treatment assignment.
Study Visits: Dose Determination
Each of the eight study subjects underwent three study visits, three to four weeks apart; at each visit receiving either placebo, sitagliptin 50 mg, or sitagliptin 100 mg. At the visits, subjects were admitted to Montefiore Medical Center (Figure 1A). Insulin infusion through a subcutaneous pump or long acting basal insulin was continued. Study medication (sitagliptin or placebo) was given at –240 minutes. Blood draws occurred at –240, –180, –60, and 0 minutes prior to a mixed meal tolerance test (MMTT) and again at 10, 20, 30, 40, 60, 90, 120, 150, 180, 210, 240, and 360 minutes after the MMTT, measuring BG, insulin, and glucagon. At 0 minutes, a prebreakfast insulin bolus of rapid acting insulin was given, based on the subject’s usual insulin to carbohydrate ratio and reduced by 20% with additional correction for BG. The MMTT consisted of a standard, Boost® Liquid meal drink (12 ounces, 360 calories, 50 g of carbohydrates, and 12 g of fat), consumed over 10 to15 minutes. Lunch was provided at 240 minutes and an insulin bolus of rapid acting insulin was given. The subject was then discharged at 360 minutes. BG concentrations were measured at the bedside using an Analox GM 9 analyzer® (Analox Instruments, Stourbridge, UK).
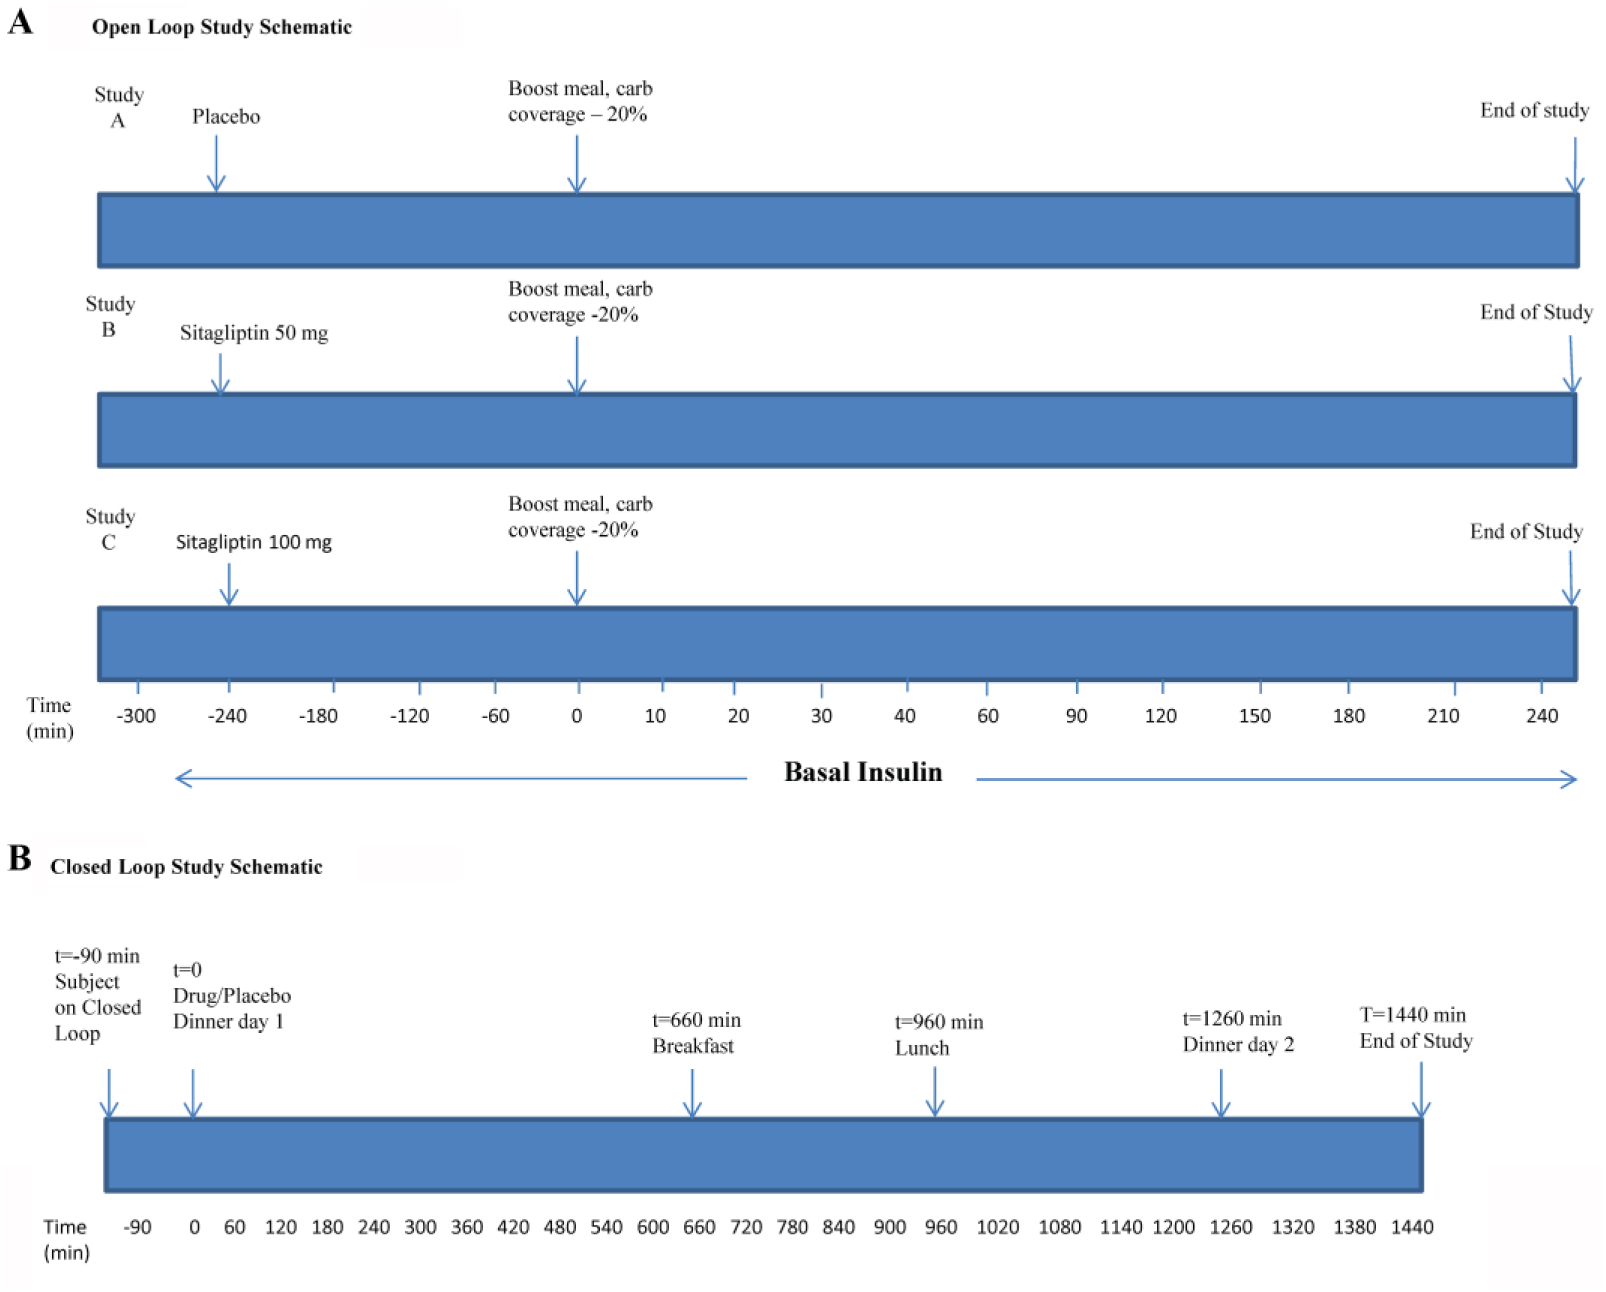
Study Design. (A) Dose determination study schematic. (B) Closed-loop study schematic.
Study Visits: Closed Loop (CL)
Subjects underwent two study visits, with 100 mg sitagliptin and placebo. Randomization was done using the same process as the previous study. Subjects were admitted to the Montefiore study location (Figure 1B). An intravenous line was placed and Medtronic Enlite CGM sensors were placed and calibrated. The Medtronic CL insulin only system was started around 6:30
Day 1
At 8:00
Day 2
At 7:00
Lunch and dinner had approximately 60 grams of carbohydrates at 12:00
The effect of a single-dose oral sitagliptin as an adjuvant therapy to insulin in the CL setting was assessed in comparison to CL with insulin monotherapy and placebo. The primary outcome measure of the study was better targeted meal and postprandial BG levels in the CL setting in the treatment arm. The secondary outcome measure included assessment of serum glucagon concentrations. In addition to the primary and secondary outcomes listed, we assessed additional outcomes including all BG concentrations and the total area under the curve (AUC) from start of the study visit on day 1 (0 min) to end of study visit (1500 min) on day 2, as well as serum insulin concentrations. Three-hour postprandial AUC for dinner on day 1 as well as breakfast, lunch, and dinner on day 2, for both the BG and the serum insulin concentrations was also measured. Protocol deviations and adverse events were reported to the IRB, FDA, and data safety monitoring board.
Insulin and Glucagon Assays
Glucagon and insulin assays were performed in the core laboratories of Einstein Institute for Clinical and Translational Research, 21 using a Mercodia enzyme-linked immunosorbent assay kit (Cat No 10-1271-01, Winston Salem, NC) and an EMD Millipore radioimmunoassay kit (HI-14K, Billerica, MA). The lower limit of quantification for glucagon was 25 pg/ml, and insulin was 3 uU/mL.
Statistical Analysis
Statistical comparisons were done using repeated measures Analysis of Variance (ANOVA) to determine the effect of sitagliptin on BG, insulin, and glucagon concentrations, which were averaged for each glycemic target. The total mean AUC was calculated using the trapezoidal method for BG, insulin, and glucagon over time as well as the three hour post-prandial concentrations after dinner on day 1 (0–180 minutes), and day 2, breakfast (660-840 minutes), lunch (960-1140 minutes) and dinner (1260-1440 minutes). Data was analyzed by 2-way ANOVA followed by 1-way ANOVA at each time point and post hoc Bonferroni’s test. All data are expressed as mean ± SD. P<0.05 was considered to be statistically significant. The variability in AUC (treatment vs control) for both total and 3-hour postprandial periods is expressed as mean ± 95% confidence interval (CI). The statistical software that was used to analyze the comparative and descriptive statistics was Graphpad Prism, V 6.0 (GraphPad Software Inc, San Diego, CA).
Sensor accuracy was calculated as mean absolute relative deviation (MARD) of the sensor glucose concentration from the plasma venous glucose concentration for all paired time points (mean ± SD). The difference between treatment versus control was considered to be statistically significant at P<0.05. Fisher’s exact test was used to analyze the hypoglycemic events, between the control and treatment groups.
Results
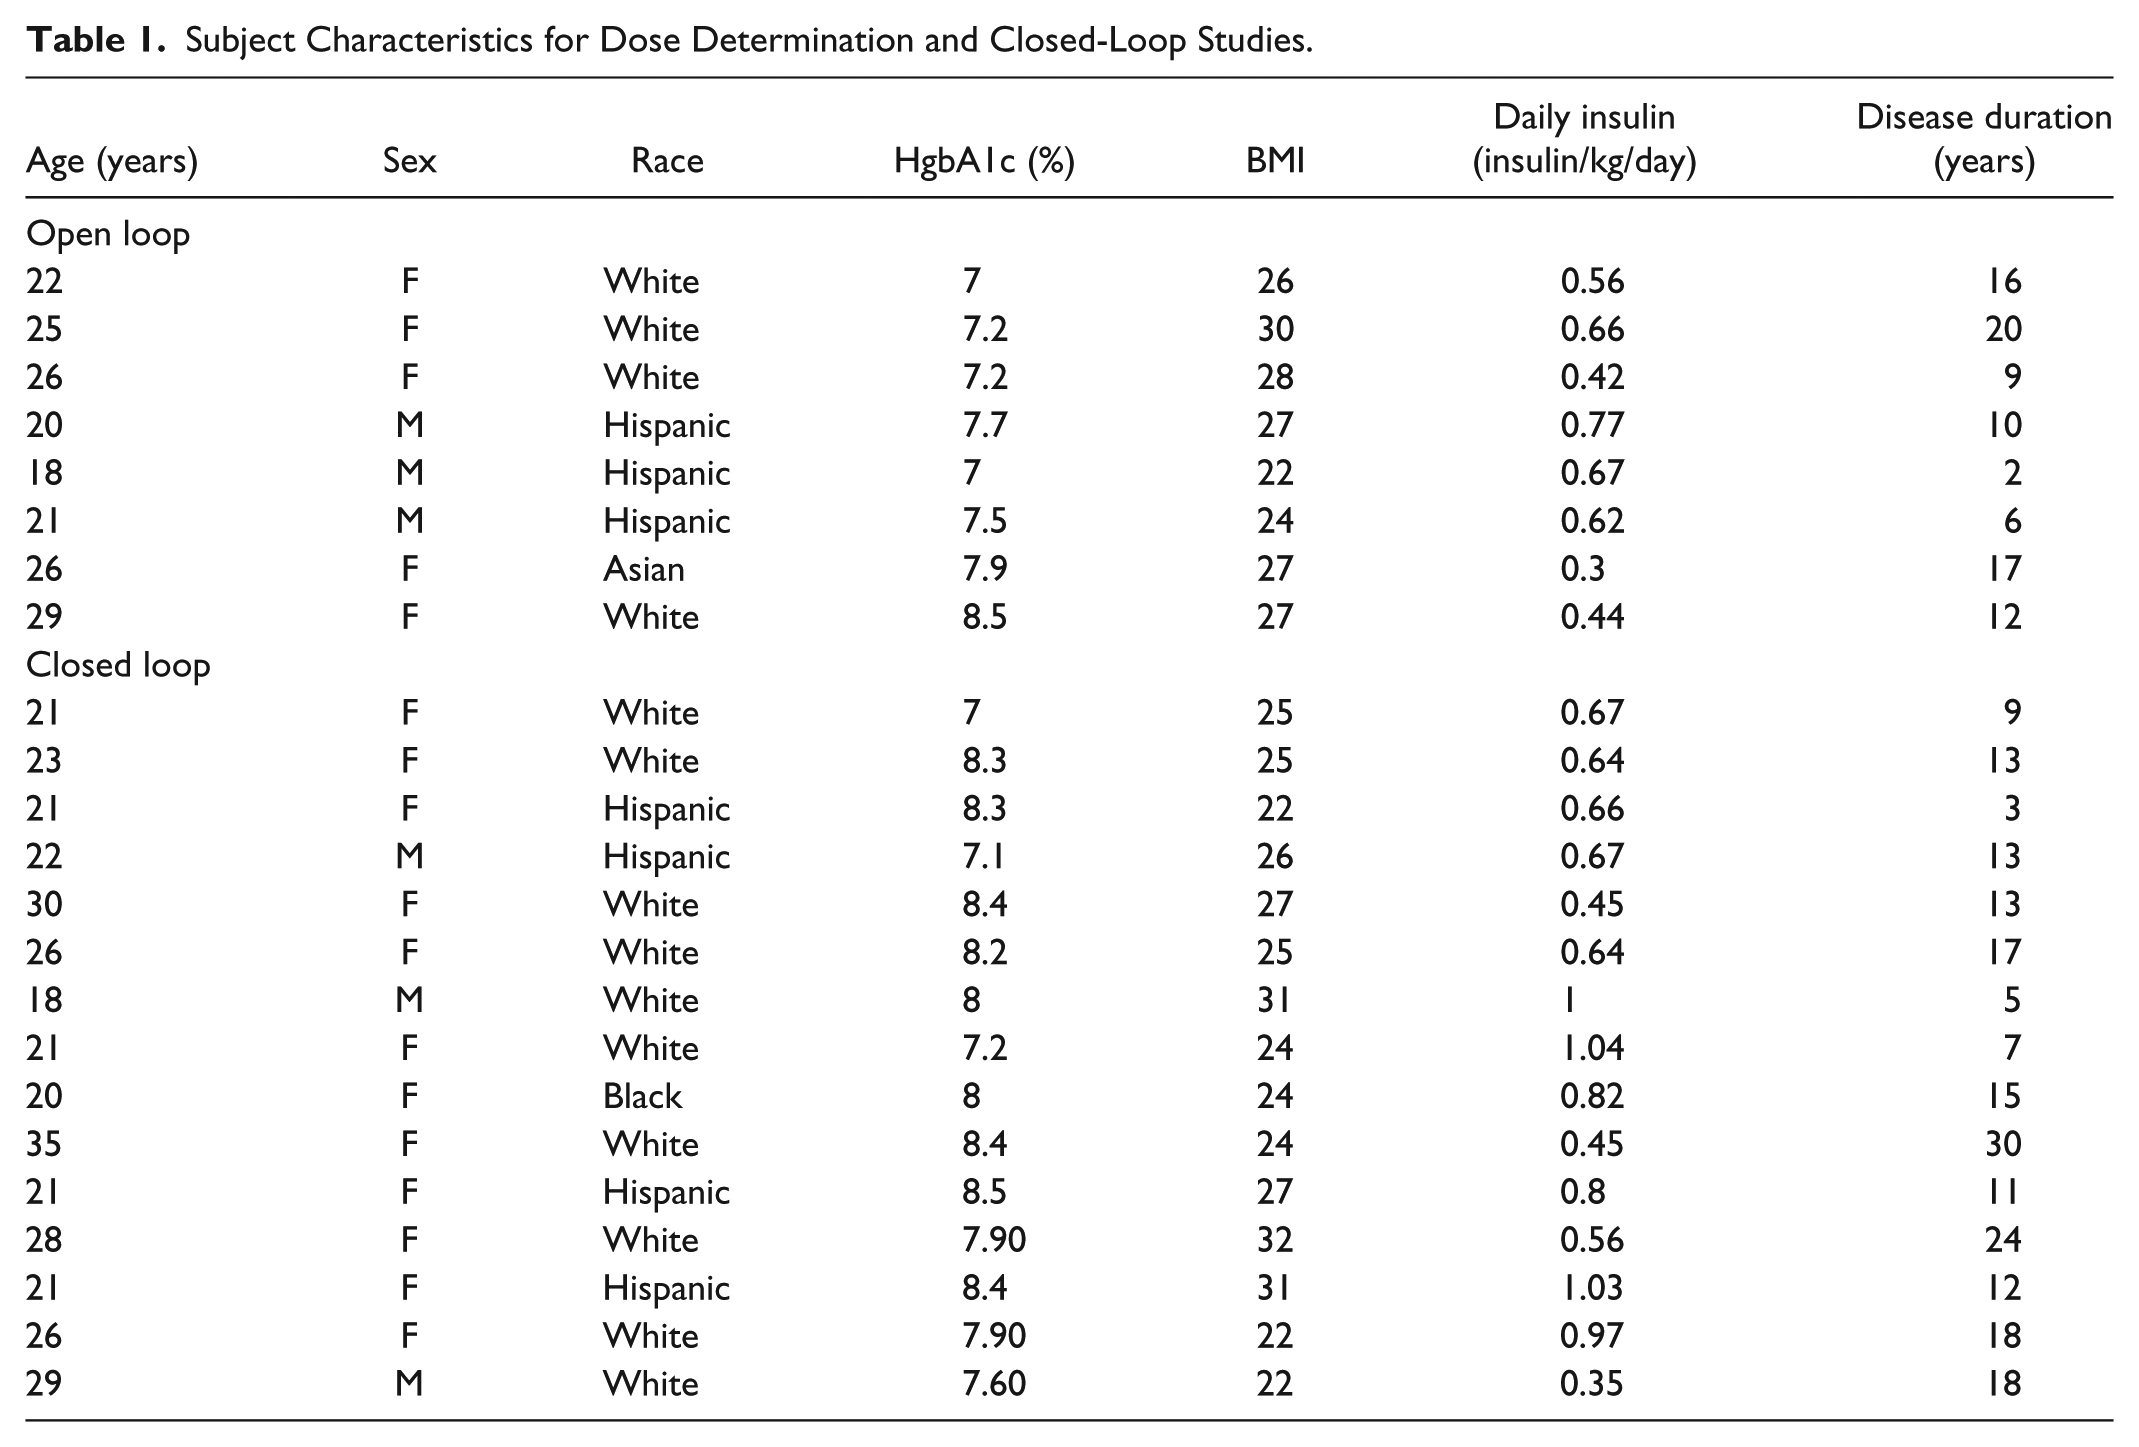
Table 1 depicts subject characteristics for the dose determination study. For the dose determination study, ten subjects were screened with two screen fails due to high HbA1c and low hemoglobin.
Subject Characteristics for Dose Determination and Closed-Loop Studies.
Dose Determination
Overall, BG values were significantly lower in the sitagliptin 100 mg treatment group, compared to sitagliptin 50 mg treatment and control (placebo) group (P = .0006). The average BG from –240 minutes to 360 minutes was lower in sitagliptin 100 mg treatment group (153.6 ± 22.4 vs 181.5 ± 45.1 mg/dl, P = .003), compared to the controls and (153.6 ± 22.4 vs 179.4 ± 36.6 mg/dl, P = .0005) compared to sitagliptin 50 mg (Figure 2A). The corresponding total AUC for BG was again significantly lower in sitagliptin 100 mg group, compared to sitagliptin 50 mg treatment group only (6384 ± 4844 vs 7394 ± 5606 mg/dl*hr, P = .009), the mean difference being –1010 mg/dl*hr (95% CI –1.732, –287.9) (Figure 2B).
Overall, serum insulin concentrations were significantly lower in the control and sitagliptin 50 mg treatment groups (P < .0001). Compared to sitagliptin 100 mg treatment, insulin concentrations were lower in both the control (306.7 ± 48.4 vs 275.0 ± 57.0 pmol/L, P < .0001) and sitagliptin 50 mg treatment group (306.7 ± 48.4 vs 276.2 ± 50.0 pmol/L, P < .0001). Furthermore, there was also a significant mean difference in insulin concentrations between the treatment (sitagliptin 100 mg) and control arms 31.96 pmol/L (95% CI 22.52, 41.40) as well as between the two treatment groups (sitagliptin 100 mg vs sitagliptin 50 mg) 30.53 pmol/L (95% CI 23.53, 37.52). We also calculated the corresponding total AUC for both treatment and control groups. Compared to sitagliptin 100 mg, the total AUC for insulin concentrations were statistically significant in the control (13515 ± 13151 vs 11712 ± 10622 pmol/L*hr, P = .04) and sitagliptin 50 mg treated group (13515 ± 13151 vs 11919 ± 11101 pmol/L*hr, P = .03) The mean difference is 1803 pmol/L*hr (95% CI 58.03, 3548) for controls and 1596 pmol/L*hr (95% CI 206.5, 2985) for sitagliptin 50 mg.
Serum glucagon concentrations were not different between the treatment (sitagliptin 100 mg) and control groups (5.24 ± 1.8 vs 5.13 ± 2.6 pmol/L, P = .79, the mean difference being 0.12 pmol/L (95% CI –0.78, 1.01) and as well as between the two treatment groups (sitagliptin 100 mg vs sitagliptin 50 mg) (5.24 ± 1.8 vs 5.52 ± 2.2 pmol/L, P = .52), the mean difference is 0.28 pmol/L (95% CI –1.18, 0.63). The total AUC for glucagon concentrations showed no difference between the treatment and control group (P = .85) as well as between the two treatment groups (P = .26).
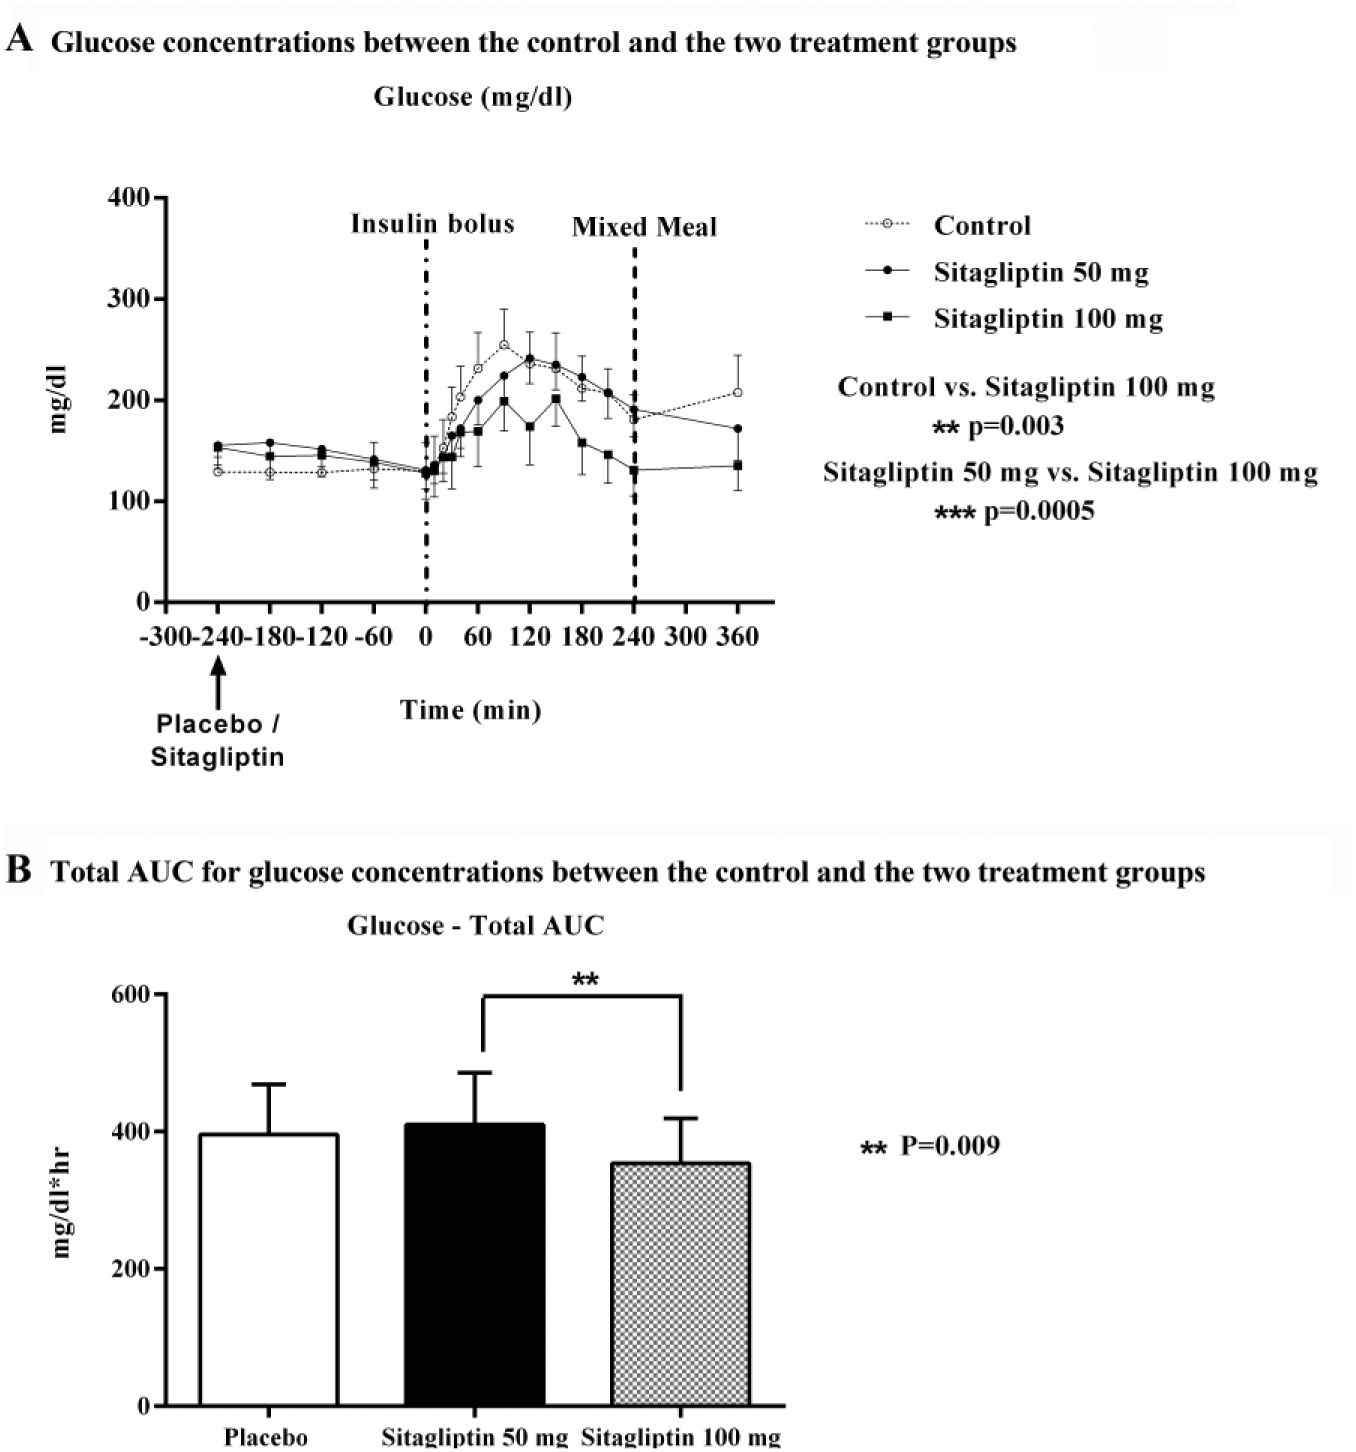
Dose determination/open loop. (A) Glucose concentrations between the control and the two treatment groups. (B) Total AUC for glucose concentrations between the control and the two treatment groups.
Closed Loop
The CL system was active 100% of the time during the study, except for periods of lost signal (such as subject being out of range when in the bathroom) or in the case of computer malfunction. These times were infrequent and represented generally less than five minutes at one time. Table 1 depicts subject characteristics for the CL study. Twenty-two subjects were screened, and 17 subjects were enrolled. Two opted not to complete the study due to scheduling issues. Screen fails were due to high HbA1C, history of pancreatitis, elevated serum creatinine, and history of a recent major hypoglycemic episode. One study subject from the CL arm had a presumed sensor malfunction and was excluded from data analysis. Early in the study there were some issues with control tool shutdown which necessitated two repeat studies. Fifteen subjects completed both study visits. Based on the dose determination study results, 100 mg dose of sitagliptin was considered for use in CL. According to our primary outcome, both meal and postprandial BG levels were analyzed as 3-hour postprandial BG concentrations, following each meal. The BG concentrations were not significant during any of the postprandial periods. During dinner on day 1, the postprandial BG concentrations were not different between the control and treatment groups (164.2 ± 36.5 vs 186.2 ± 30.4 mg/dl, P = .12). Similarly on day 2, when compared to controls, the BG concentrations during the postprandial periods were not significant in the treatment group following breakfast (209.1 ± 50.0 vs 190.1 ± 27.0 mg/dl, P = .13), lunch (156.0 ± 36.0 vs 151.4 ± 35.0 mg/dl, P = .76), and dinner (172.0 ± 26.6 vs 181.0 ± 33.0 mg/dl, P = .53).
However, Figure 3A depicts BG concentrations during the entire study period. BG concentrations showed significant improvements in the treatment arm, compared to the control arm (P = .03). The average BG from 8:00
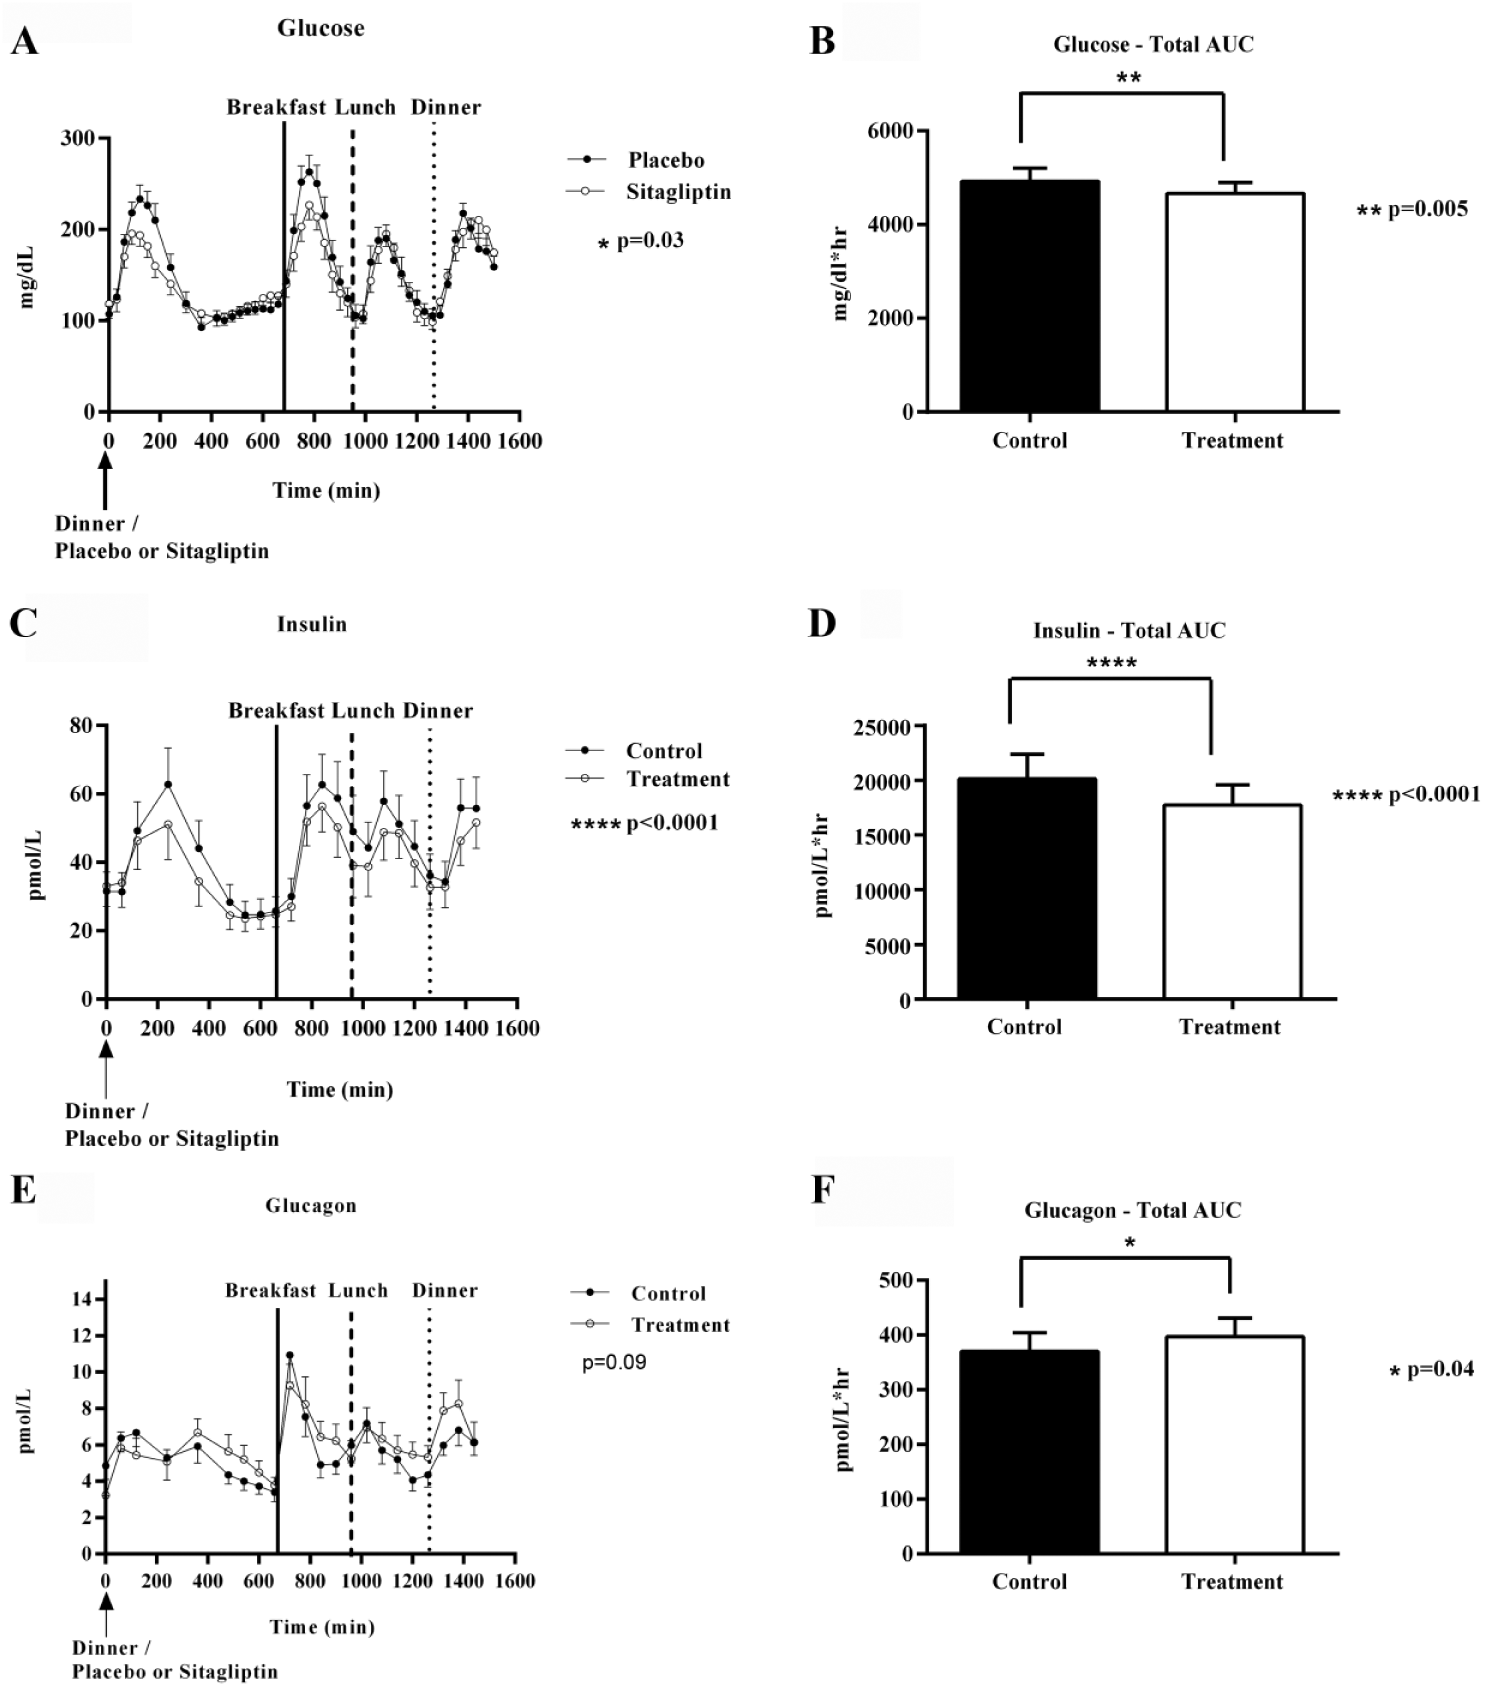
(A, C, E) Glucose, insulin, and glucagon concentrations in the control vs sitagliptin treatment arms. (B, D, F) Total area under curve (AUC) for glucose, insulin, and glucagon between the control and treatment groups.
The total AUC for BG concentrations (Figure 3B) was also significantly lower in the treatment arm (4664 ± 1548 vs 4921 ± 1905 mg/dl*hr, P = .005), the mean difference is –257 mg/dl*hr (95% CI –433.2, –80.84). We further assessed the BG concentrations from the start of the first meal at dinner on day 1 at 8:00
In addition, we also assessed the 3-hour AUC for postprandial plasma glucose concentration in the treatment arm at dinner on day 1, which was statistically significant (27092 ± 9062 vs 34652 ± 5753 mg/dl*hr, P = .001); the mean difference is –7560 mg/dl*hr [95% CI –12934, –2186] (see Supplementary Material). Also, for the postprandial period, dinner on day 1, the percentage time spent with the plasma glucose levels within the target range of 70-180 mg/dl is significantly higher in the sitagliptin CL, compared to the standard CL (63.3% vs 43.9%). However, the 3-hour postprandial AUC for breakfast, lunch, and dinner at day 2 were not statistically significant in the treatment arm (P = .62). Furthermore, we did not see any significant difference in the percentage time spent in target range, during the postprandial period for breakfast (44.9% vs 40.8%), lunch (61.2% vs 57.1%) and dinner on day 2 (48.9% vs 50%). In addition, the overall mean absolute relative difference (MARD), was (mean [SD]) –2.03% [6.1] for the control arm versus –2.17% [4.7] for the treatment arm. MARD was statistically insignificant in subjects treated with sitagliptin (P = .94).
Secondary outcomes suggest, glucagon concentrations were not significant in the treatment arm (6.04 ± 1.5 vs 5.66 ± 1.6 pmol/L, P = .09); the mean difference being 0.39 pmol/L (95% CI –0.08, 0.85) (Figure 3E). Compared to sitagliptin 100 mg, the total AUC for glucagon excursions were statistically significant in the control arm (396.9 ± 158.0 vs 370.0 ± 160.9 pmol/L*hr P = .04); the mean difference in total AUC is 26.86 pmol/L*hr (95% CI 1.49, 52.24) (Figure 3F). Furthermore, the AUC for 3-hour postprandial glucagon concentrations were not significant in the treatment arm for any of the meal times (P = .68). Other outcomes (Figure 3C) include insulin concentrations which were significantly reduced overall (270.8 ± 74.0 vs. 303.2 ± 91.4 pmol/L, P < .0001), in the treatment arm. There was a significant difference in insulin concentrations between the treatment and control arms 32.46 pmol/L (95% CI 19.75, 45.18). The total AUC (Figure 3D) for insulin concentrations were also significantly lower in the treatment arm (17736 ± 8547 vs 20127 ± 10538 pmol/L*hr; P < .0001), with a mean difference of 2391 pmol/L*hr (95% CI –1368, 3415). The corresponding AUC for 3-hour postprandial insulin concentrations was insignificant at dinner on day 1 (P = .37) as well as at breakfast (P = .38), lunch (P = .07), and dinner on day 2 (P = .13) (see Supplementary Material).
Insulin requirements in the CL system for the study period were slightly lower in the treatment arm, but this did not reach statistical significance (13.16 ± 2.3 vs 13.31 ± 2.5 units/hr; P = .63). Furthermore, insulin use per hour during the postprandial period in control versus treatment arm was also not significant, breakfast (15.40 ± 7.9 vs ± 15.29 ± 4.9 units/hr; P = .94), lunch (10.49 ± 5.2 vs 10.78 ± 5.8 units/hr, P = .88), and dinner (14.04 ± 8.7 vs 13.40 ± 5.2 units/hr, P = .76).
Adverse Events
There were no serious adverse events. Two subjects received ibuprofen for headache; one was during a treatment visit. There was no statistically significant difference between the groups with regards to hypoglycemia, defined as BG below 70 mg/dl at any of the 47 required BG time-points. There were 34 episodes of hypoglycemia with placebo. Of these, six episodes occurred during premeal, 14 episodes overnight, and 14 episodes were during the postprandial period. During the sitagliptin treatment there were 28 episodes of hypoglycemia. This includes eight episodes of hypoglycemia during the premeal period, nine episodes overnight, and 11 episodes during the postprandial period. Hypoglycemia episodes between the control and treatment arms were not significantly different (P = .52, Fisher’s exact test). Subjects were given glucose tablets and rechecked in 20-25 minutes. None of these episodes were severe, requiring resuscitation beyond treatment with glucose tabs and no patient dropped out of the study due to hypoglycemia.
Discussion
The dose determination study results showed significant improvement in postprandial BG with 100 mg sitagliptin, compared to 50 mg and placebo. This was used to determine the dose for the CL protocol. In the CL study, adjunct treatment with 100 mg sitagliptin in the CL setting with insulin therapy was effective in lowering the overall glucose excursions in patients with T1DM. This glucose lowering effect was more prominent in the postprandial period after the first meal (dinner on day 1) and breakfast on day 2. However, the first meal response was difficult to assess as it was early in the study visit.
Three studies have previously evaluated sitagliptin use in subjects with T1DM. One study used metformin concurrently with sitagliptin, so individual drug effects are difficult to differentiate. 5 In another study, Ellis et al investigated the effects of 100 mg sitagliptin with an eight week crossover design with the use of CGM. 22 Eighteen subjects participated in the study and it showed significant decrease in 2-hour postprandial glucose AUC and 24-hour glucose AUC, but no individual meal significance. In addition, Garg et al looked at 121 subjects with T1DM using 100 mg sitagliptin versus placebo daily for 16 weeks. In the Garg et al study, meal challenge and CGM were utilized. 23 GLP-1 was found to be elevated, as expected and in the first four weeks, there was a decrease in HbA1c for those on treatment however this did not persist. A nonsignificant decrease in HbA1c was noted in a subset of patients with positive C-peptide. 23
For our dose determination study, insulin concentrations were increased, but this was also seen prior to drug administration (higher at 0 minutes), therefore not thought to be related to drug action. For the CL study, subjects taking sitagliptin had statistically significant lower insulin concentrations. In addition, the documented mean insulin administration was lower in this group but this was not statistically significant. Garg et al did note a trend toward decreased insulin in T1DM subjects on sitagliptin, but it did not reach statistical significance. 23 The lowering of insulin concentrations points to a possible mechanism of increased insulin sensitivity in subjects with T1DM, but requires further study.
In our CL study hypoglycemic episodes were analyzed and there was no difference in hypoglycemic episodes between the treatment and control groups. This is in concordance with studies in subjects with T2DM and the lowering of BG is one of the desirable features of this medication for that population. 24 In future studies, further adjustments to the algorithm and perhaps premeal announcements, may help to minimize the number of hypoglycemic episodes. Due to the reactive nature of the CL system it administers insulin in response to hyperglycemia in the postprandial period which results in a hypoglycemic episode from the excess insulin. A meal announcement may help reduce this type of response.
Glucagon concentrations in the CL study were not statistically different between the control and treatment groups. A study using vildagliptin in subjects with T1DM utilized twice daily dosing and hypoglycemic clamps were performed on the subjects. Vildagliptin was found to reduce glucagon concentrations postprandially but not during times of hypoglycemia. 14 The vildagliptin study also examined glucagon and found lower levels postprandially. 14 This was not reproduced in the Garg study which also examined glucagon concentrations, though authors note there was concern regarding the accuracy of the samples. 23 Suppression of glucagon concentrations has also been noted in subjects with T2DM 12 and this is a part of the known mechanism. Therefore the question of glucagon action with sitagliptin in T1DM remains incompletely understood.
A limitation of the dose determination study is the doses and timing of dosing. The highest dose was 100 mg and the dose may need to be higher than that to be even more effective. A limitation of the CL study also is related to dosing. Perhaps two doses are needed in a day; the timing of the dose needed to be adjusted or an increased dosage was required. For patients with T2DM, sitagliptin is given once daily and in studies22,23 where sitagliptin was used in T1DM, time of dosing was not discussed. Sitagliptin starts to work in 1 to 4 hours, corresponding to peak action, and the half-life is 12 hours, 25 suggesting that since its effect is on postprandial BG, morning administration would be superior to target breakfast and lunch. Twice daily dosing could also be considered. In a previous study where vildagliptin was used in patients with T1DM, twice daily dosing was used. 14 An additional limitation is the length of the studies. For both the dose determination and the CL study a longer duration study would provide better information. One last limitation of the CL and dose determination study is meal composition consideration; though one standard Boost® meal was used the others were controlled only for carbohydrates.
Conclusions
In conclusion, sitagliptin demonstrated an overall decrease in BG concentrations when used as an adjunct therapy with an insulin only CL system. There were minimal side effects when using sitagliptin and CL and therefore could provide a simple oral adjunctive therapy to improve postprandial hyperglycemia with the CL system.
Footnotes
Acknowledgements
We would like to thank all research participants and the staff at Montefiore Medical Center inpatient unit and as well as the staff at clinical research center at Montefiore. The authors acknowledge support from the National Institute of Diabetes and Digestive and Kidney Diseases (NIDDK).
Abbreviations
ANOVA, analysis of variance; AUC, area under the curve; BG, blood glucose; CBC, complete blood count; CGM, continuous glucose monitor; CL, closed loop; DPP-4, dipeptidyl peptidase-4; ePID, external physiological insulin delivery; FDA, Food and Drug Administration; GIP, gastric inhibitory polypeptide; GLP-1, glucagon-like peptide-1; HbA1c, hemoglobin A1c; IRB, institutional review board; MARD, mean absolute relative deviation; NIDDK, National Institute of Diabetes and Digestive and Kidney Diseases; NIH, National Institute of Health; T1DM, type 1 diabetes mellitus; T2DM, type 2 diabetes mellitus.
Declaration of Conflicting Interests
The author(s) declared the following potential conflicts of interest with respect to the research, authorship, and/or publication of this article: RAH is a shareholder in Thermalin Diabetes and a consultant for Lexicon, Merck, and Mannkind. For all other authors, the disclosures are “none.”
Funding
The author(s) disclosed receipt of the following financial support for the research, authorship, and/or publication of this article: This trial was funded by the National Institute of Diabetes and Digestive and Kidney Diseases (NIDDK), DP3DK101078.
References
Supplementary Material
Please find the following supplemental material available below.
For Open Access articles published under a Creative Commons License, all supplemental material carries the same license as the article it is associated with.
For non-Open Access articles published, all supplemental material carries a non-exclusive license, and permission requests for re-use of supplemental material or any part of supplemental material shall be sent directly to the copyright owner as specified in the copyright notice associated with the article.