
Abstract
Background:
Computer simulation has been shown over the past decade to be a powerful tool to study the impact of medical devices characteristics on clinical outcomes. Specifically, in type 1 diabetes (T1D), computer simulation platforms have all but replaced preclinical studies and are commonly used to study the impact of measurement errors on glycemia.
Method:
We use complex mathematical models to represent the characteristics of 3 continuous glucose monitoring systems using previously acquired data. Leveraging these models within the framework of the UVa/Padova T1D simulator, we study the impact of CGM errors in 6 simulation scenarios designed to generate a wide variety of glycemic conditions. Assessment of the simulated accuracy of each different CGM systems is performed using mean absolute relative deviation (MARD) and precision absolute relative deviation (PARD). We also quantify the capacity of each system to detect hypoglycemic events.
Results:
The simulated Roche CGM sensor prototype (RCGM) outperformed the 2 alternate systems (CGM-1 & CGM-2) in accuracy (MARD = 8% vs 11.4% vs 18%) and precision (PARD = 6.4% vs 9.4% vs 14.1%). These results held for all studied glucose and rate of change ranges. Moreover, it detected more than 90% of hypoglycemia, with a mean time lag less than 4 minutes (CGM-1: 86%/15 min, CGM-2: 57%/24 min).
Conclusion:
The RCGM system model led to strong performances in these simulation studies, with higher accuracy and precision than alternate systems. Its characteristics placed it firmly as a strong candidate for CGM based therapy, and should be confirmed in large clinical studies.
Continuous glucose monitoring (CGM) has become a powerful tool to assist in the optimization of glycemic control in diabetes. Since the advent of CGM technology,1-3 significant progress has been made toward versatile and reliable CGM devices that not only monitor the course of blood glucose (BG) fluctuations day and night, but also provide feedback such as alarms when BG reaches preset low or high thresholds. A number of studies have documented the benefits of CGM4-7 and charted guidelines for its clinical use.8-11
Most current CGM devices do not measure actual BG but form a BG representation based on the interstitial glucose (IG) concentration (the actual measurement matrix), sparse actual BG measurements (calibrations), and algorithmic tools (calibration algorithms, smoothers and short term prediction); all in an effort to account for the physiological process allowing transport from blood to the interstitium.12-19 Because the time lag can greatly influence the accuracy of CGM, a number of studies were dedicated to its investigation, yielding various results.16-22 For example, it was hypothesized that if a glucose fall is due to peripheral glucose consumption the physiological time lag would be negative, that is, fall in IG would precede fall in BG.16,23 In most studies IG lagged behind BG by 4-10 minutes regardless of the direction of BG change. The formulation of the push-pull phenomenon offered reconciliation of these results and provided arguments for a more complex BG-IG relationship. 24
In addition, errors from calibration, transient loss of sensitivity, movement artifacts like pressure-induced sensor attenuation (PISA),25,26 large errors (or large inaccuracies as defined in Leelarathna et al), 27 and random noise confound CGM data.28,29 Nevertheless, the accuracy of CGM is increasing and may be approaching a physiological limit for subcutaneous glucose monitoring.30-34
While the assessment of sensor accuracy during human clinical trials remains the main source for information about CGM performances and prediction of the utility of these systems,35-38 computer simulation has also been shown to be a relevant means to infer the impact of different measuring systems on glucose control, based on sensor error modeling derived from said accuracy studies.39-44 At the core of these simulations is the UVa/Padova simulation platform, a computer based software allowing for the simulation of glucose and insulin metabolism in adults, adolescents, and children with T1D, under a variety of treatment paradigms (eg, multiple daily injections, pump therapy, or closed loop systems). The simulator is equipped with 300 in-silico patients (100 in each age category), designed to span the T1D population and produce a robust assessment of the impact of the specified therapy on plasma glucose. While it is based on 30+ years of research, the simulator was validated in 2008 and is accepted by the Food and Drug Administration as a replacement for preclinical data.
In this article we explore the characteristics of a new CGM prototype, the Roche CGM sensor prototype (RCGM), designed by Roche Diabetes Care. We first describe the overall accuracy metrics based on accuracy data provided by Roche, and decompose the error in its different components (gain, time lag, drift & colored noise) of the new prototype as well as the characteristics of 2 already commercially available CGM systems (CGM-1 and CGM-2) as a base for comparison. Based on this analysis we then leverage the UVa/Padova T1DM simulation platform to compare CGM performances during different scenarios designed to reproduce real-life use, and further describe the potential clinical benefits associated with CGM accuracy. Such setup allows for further testing of a wide variety of situations (see scenarios below), in a more diverse subject population.
Methods
Modeling Data
Data were provided by Roche Diabetes Care for modeling and analysis, including frequent glucose reference measurements and 3 different CGM systems as follows: 10 patients monitored by the RCGM, leading to 19 RCGM sensor traces; 45 12 patients monitored by alternate system 1 (CGM-1), leading to 24 sensor traces; 46 10 patients monitored by alternate system 2 (CGM-2), leading to 20 sensor traces. 47 All data were collected during a previous study and deidentified prior to analysis; details about subjects and protocols have been published.45-47
The length of CGM recordings was on average 155 hours, with 163.7 ± 0.29 hours for RCGM, 142.43 ± 3.25 hours for CGM- 1, and 162.7 ± 1.42 hours for CGM-2. Frequent reference measurements (median time between reference 42 minutes [16 min-61 min]) were taken throughout; studies assessing the accuracy of RCGM and CGM-2 used Accu-Chek® Aviva, Roche Diagnostics GmbH, as reference measurements, while we had access to YSI 2300 for the modeling of CGM-1. Distribution of BG references and rate of change are shown in Figure 1.
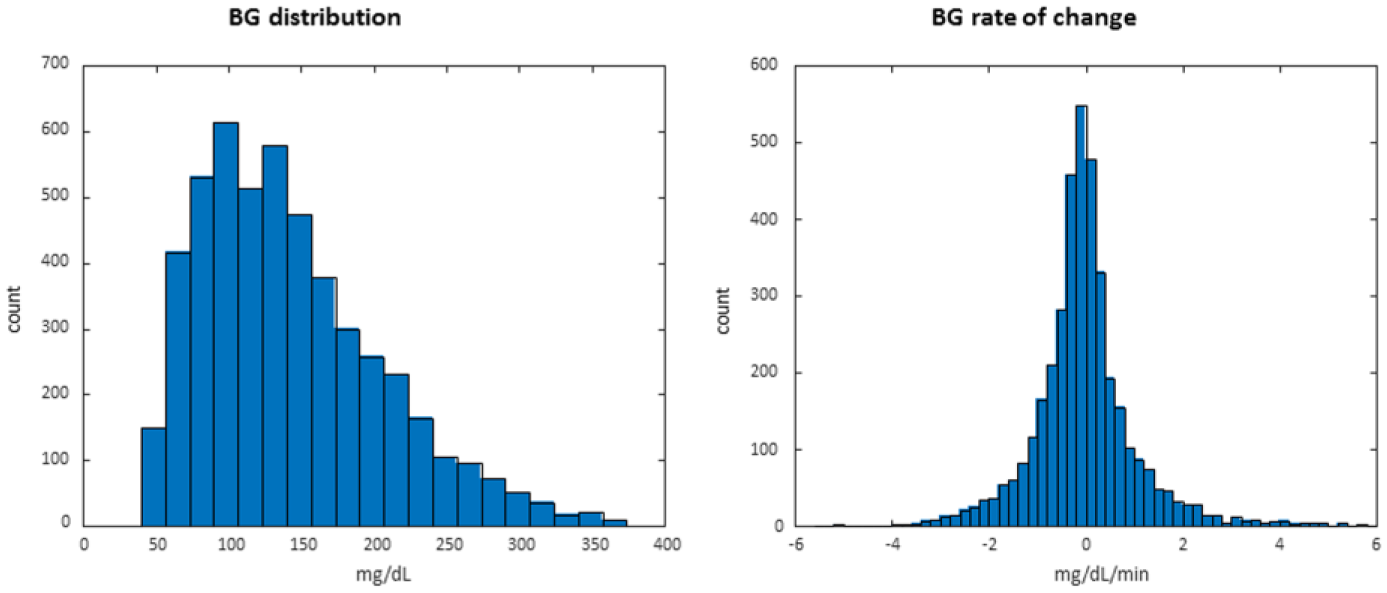
Distribution of reference values and rate of change in original data set.
Reference measurements and sensor signals between calibrations were used to model the sensors, leading to 3178, 4414, and 3346 data pairs for RCGM, CGM-1, and CGM-2 respectively.
Modeling Method
CGM signals have been shown to be a complex mixture of transformed BG signals and error processes. As discussed earlier, the transport of glucose from blood to the sensing matrix of a CGM (within the interstitium), associated with the calibration of the CGM signal using blood measurements (SMBG) leads to a complex relationship between CGM and BG traces. While the more exact mathematical model to represent this phenomenon has been described as part of the “push-pull” methodology, the calibration scheme, and its potential errors, do not allow for a precise estimation of the process parameters. Therefore, we have chosen to represent the transport/calibration “error” as a combination of a time dependent linear transform and time lag, associated with a multiplicative error term; namely:
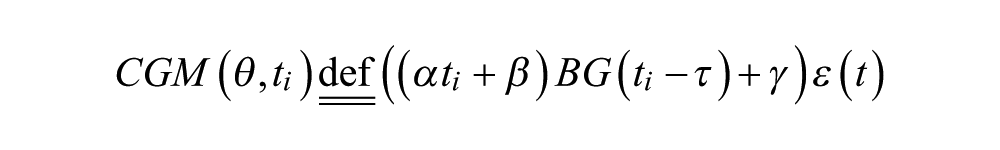
where
The error term, ϵ(τ), is not considered to be a white noise process: the multiplicative noise is considered to be following a Johnson distribution, and as such to be a transformation of a Gaussian process, then its dynamics are set to follow an autoregressive moving average (ARMA) scheme; leading to:
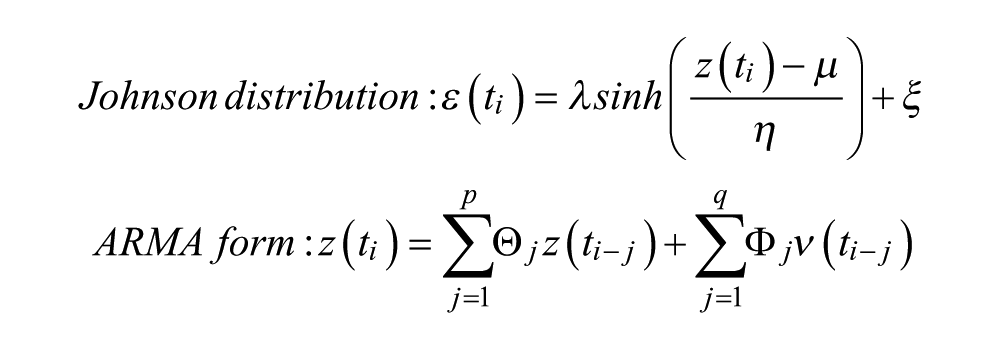
where
Model parameters are estimated by least square methods, with a single τ per sensor, and
Simulation Setup
Simulations were run on the 2008 version of the UVa/Padova T1DM simulator 40 using the adult population (100 in-silico subjects). Each in-silico subject was equipped with (1) a simulated BG meter with normally distributed measurement error, following the ISO15197:2003 standard, (2) a simulated CGM, with parameters randomly sampled from the distributions described above, and (3) a simulated error-free insulin pump. Each in-silico subject is associated with a set of CSII treatment parameters that was used to compute insulin doses during the simulation runs. Therapy was CGM based: the CGM data were used for both dosing insulin or additional carbohydrates. In-silico subjects were exposed to 6 testing scenarios designed to expose them to hyper and hypoglycemia and have them experience fast changing plasma glucose values triggered by mismatched therapy and physiological changes. A summary of these scenarios is provided below:
Optimal glucose control in which per-subject estimated carbohydrates and basal/bolus insulin doses are accurate and glucose is well-controlled. This is considered a baseline “control” protocol for comparison of the others demonstrating poor control.
Hyperglycemia in which carbohydrates and insulin doses are “underestimated” and BG levels rise above the normal range.
Hypoglycemia in which “overtreatment” of insulin occurs during the simulation and BG levels fall below the normal and safe range.
Exercise-induced hypoglycemia in which “insulin sensitivity” and “insulin utilization” is increased and BG levels fall below the normal and safe range.
Insulin stacking with mistimed dosing in which “insulin on board” is increased.
Rapid glycemic excursions in which BG fluctuations change ± 0.9 to 3.5 mg/dL/minute from high or normal glucose level into the hypoglycemic range.
The entire in-silico population was exposed to each protocol, wearing all 3 CGM systems, and repeated 50 times each, leading to approximately 44.5 million hours of simulated glucose signals.
Outcomes and Analysis
We compared the RCGM performance and clinical outcome measures to those of the alternate CGM models (CGM-1 and CGM-2) using standard performance metrics. The analyses included accuracy (MARD) of paired CGM measurements and plasma glucose values (SMBG) and precision (PARD) of paired CGM measurements across the range of glucose variability (see Obermaier et al 48 for precise definitions). BG ranges of interest included hyperglycemia of > 200 mg/dL and >240 mg/dL, euglycemia of 70-180 mg/dL, hypoglycemia at < 70 mg/dL and severe hypoglycemia at < 55 mg/dL; Rapidly changing glucose levels (rising and falling ≥ 1 mg/dL/ minute) were investigated as well. In addition, hypoglycemia event detection failure (false alarms or missed events) and delay to detection were examined. Differences in MARD and PARD were the primary accuracy measures with MAD being a secondary measure for the comparison of the RCGM to the other CGM devices. The median and variability of the metrics across all sensor models and the in-silico population are provided in the summary results tables below. No statistical analysis was performed due to the specific nature of simulation studies (the standard error of an estimate can be made artificially low by increasing the number of repetitions).
Results
Parameters were obtained for all 3 sensors and their distributions are reported in Figure 2. All systems showed similar drifts, but RCGM estimated time lag was approximately half as that of the other systems (4.5 vs 12.1 vs 11.4 minutes, P < .01). Both RCGM and CGM-2 showed a slightly elevated multiplicative Bias when compared to CGM-1 (0.97 vs 0.72 vs 0.99, P < .01), but CGM-1 displayed a much larger additive correction (−1.6 vs 32.7 vs −1.3, P < .01).
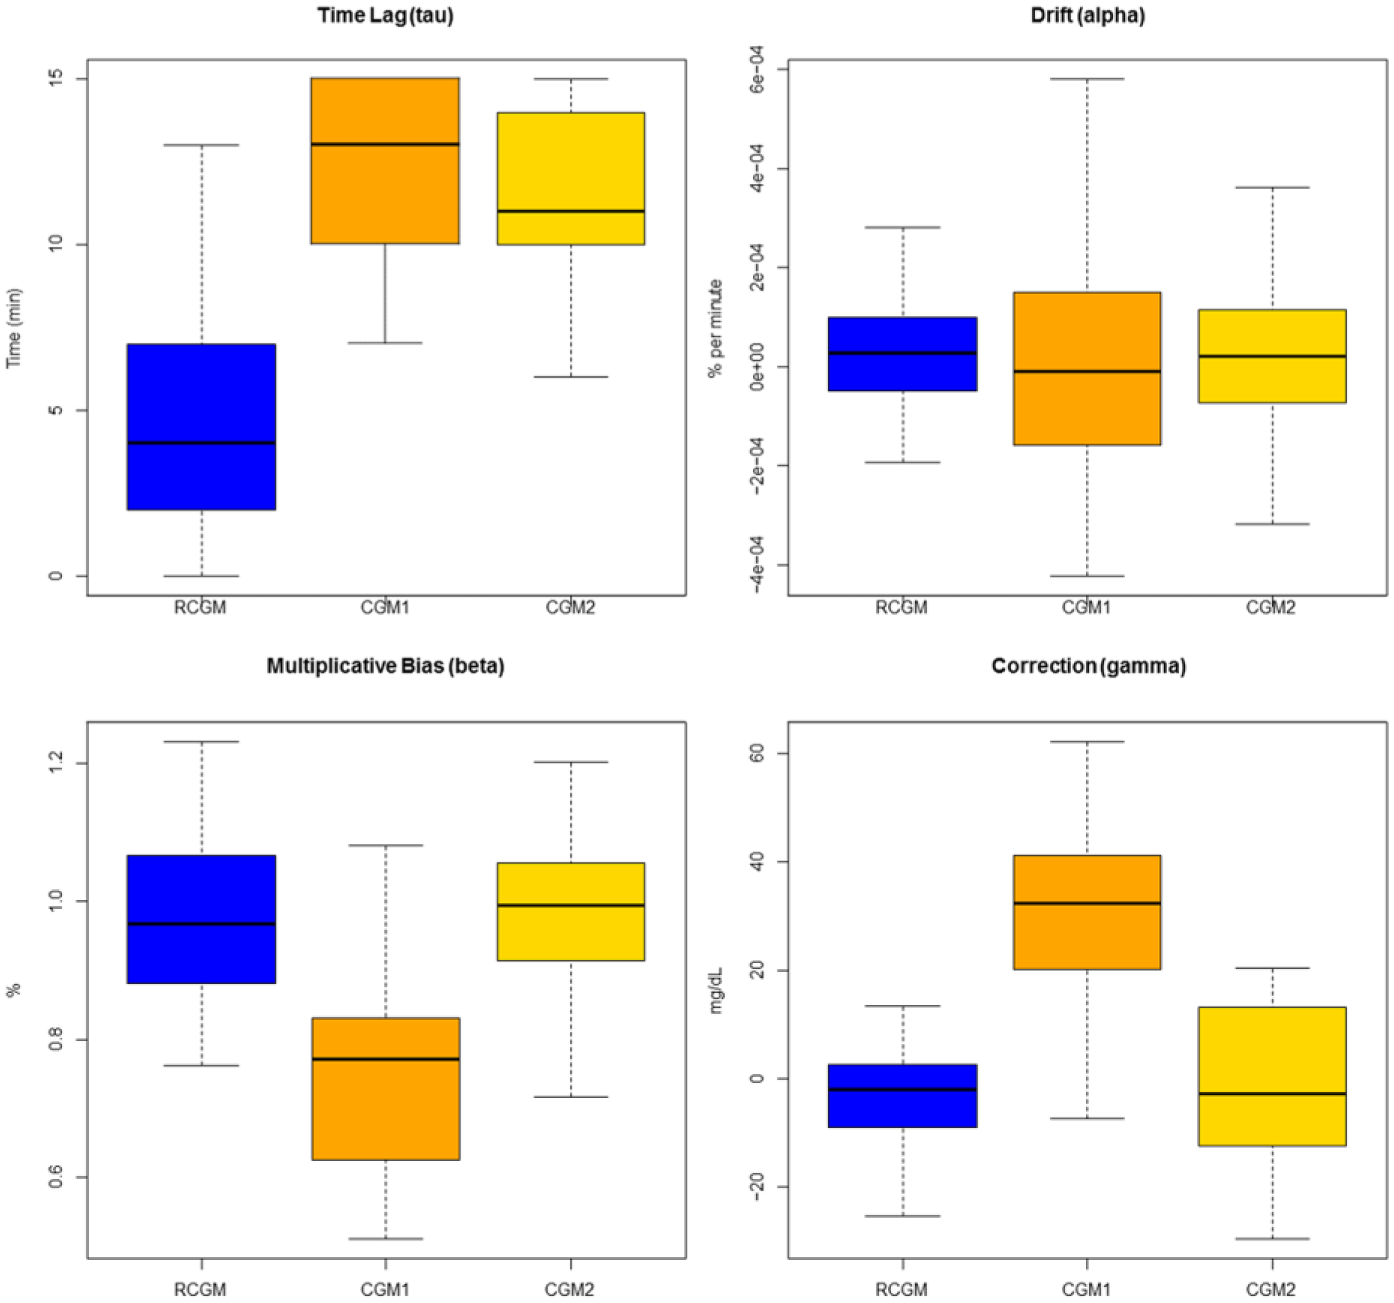
Distribution (box plot) of the parameter estimates for each CGM system. Whiskers represent 95% of the data, the median is represented as a horizontal line, and the colored block represents the interquartile range. RCGM is shown in blue, CGM-1 in orange, and CGM-2 in yellow.
The model was further validated by testing the normality of the transformed noise process (Shapiro-Wilk test for normality > 0.75 for all sensors), the ARMA process chosen was a first order autoregressive model with irregular spacing, parameters were similar for all systems (no significant differences found), with partial autocorrelation of approximately 0.6 and spread of approximately 0.35. Noise generated by the models was not found to originate from a different distribution than the source data: Kolmogorov-Smirnov test with P > .7. Finally, the MARDs of 500 simulated sensors for each system were found to be indistinguishable from the empirical data.
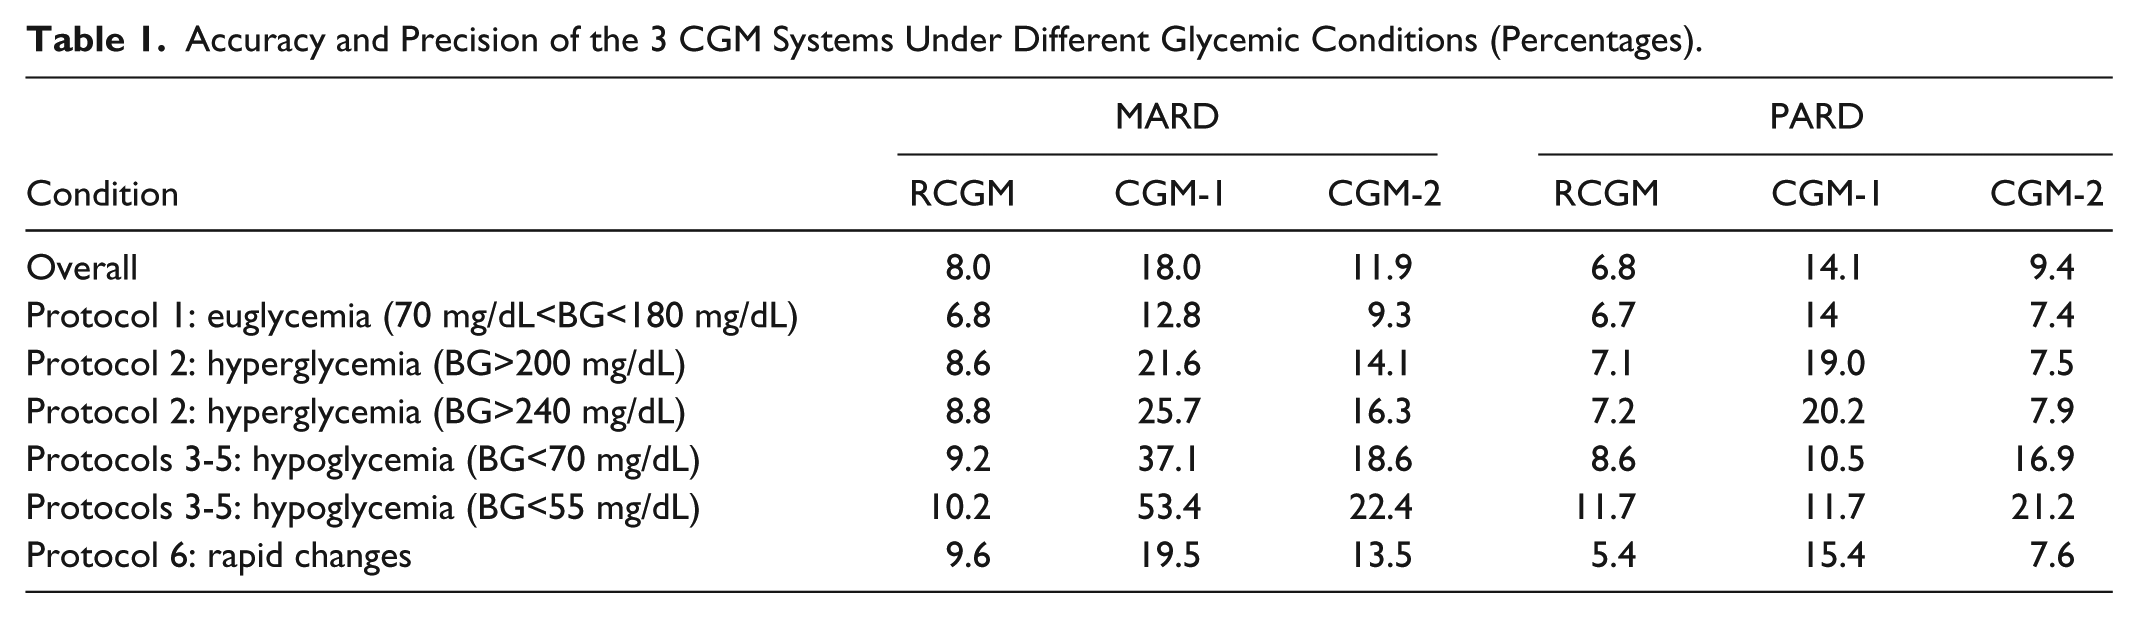
Overall both accuracy and precision of the 3 CGM system were clearly different, with an order of decreasing accuracy: RCGM with an MARD of 8% (6.8%-10.2%), CGM-2 11.4% (9.3%-22.4%), and CGM-1 18% (12.8%-53.4%). These relative performances were confirmed across all testing conditions, with particular contrasts in hypoglycemia with RCGM performances remaining around 10% and the alternate sensors showing MARDs 2 to 4 times higher. Both RCGM and CGM-2 were much more precise than CGM-1 overall, with RCGM being the most precise (PARD: 6.8% vs 14.1% vs 7.4%). MARDs and PARDs are reported in Table 1.
Accuracy and Precision of the 3 CGM Systems Under Different Glycemic Conditions (Percentages).
These differences were further exacerbated during episodes of fast changing BG, with RCGM accuracy (MARD) varying from 7.3% to 15.6%, CGM-1 from 16.6% to 26.6%, and CGM-2 from 10.1% to 22.9%. Accuracy was best for all systems in the −1 mg/dL/min to 1 mg/dL/min range, and worst during fast descent (< –1.5 mg/dL/min). See Figure 3 for further details.
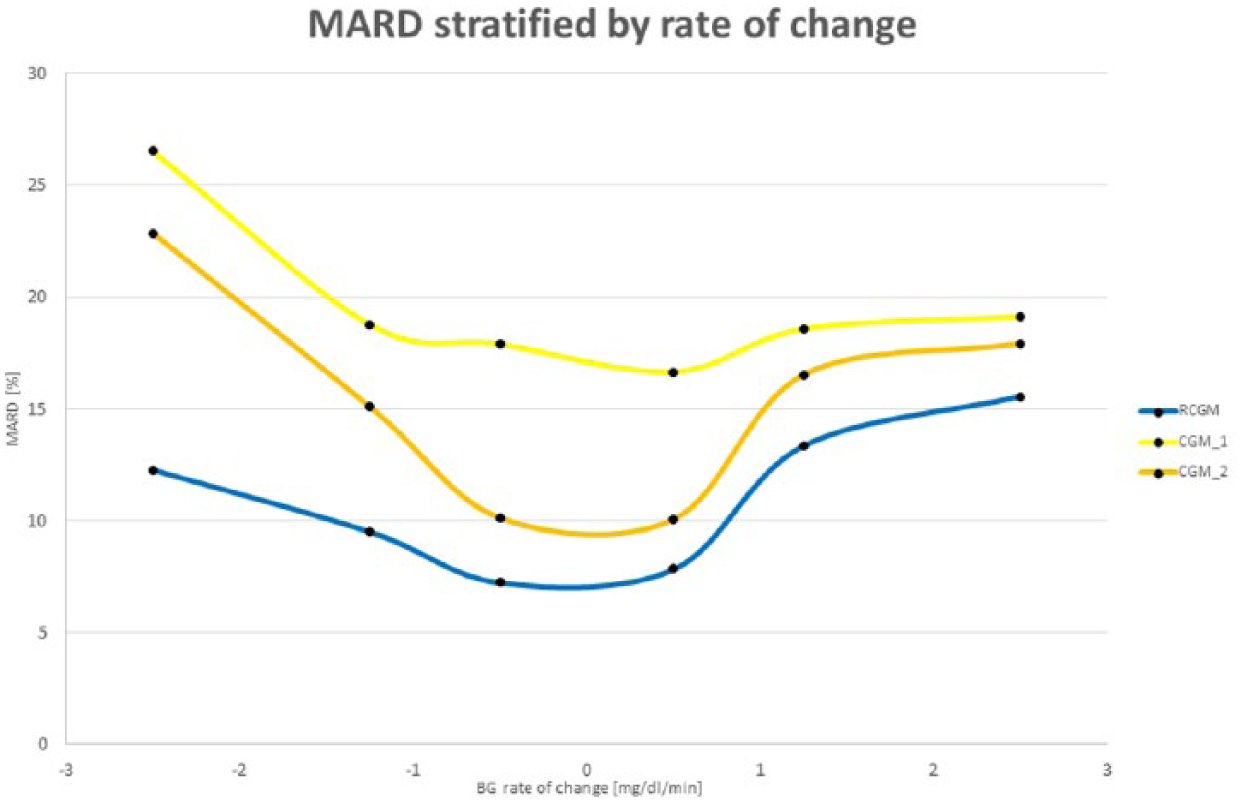
Analysis of the influence of blood glucose rate of change on CGM accuracy as measured by MARD, for RCGM (blue), CGM-1 (yellow), and CGM-2 (orange).
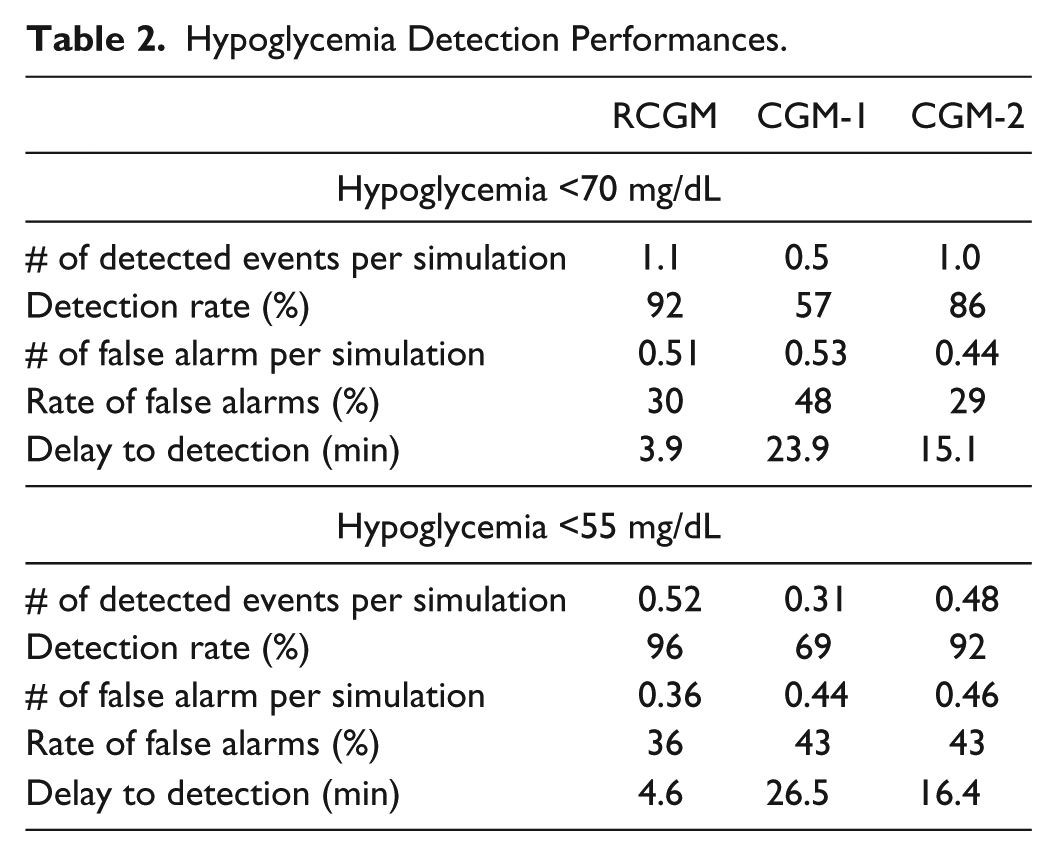
No hypoglycemia occurred during protocols 1 and 2 (nominal and hyperglycemia), so focusing only on the remaining 4 protocols we report the hypoglycemia detection rates and false alarm rates of the 3 CGM systems. In our simulations, the RCGM missed detection of fewer hypoglycemia events than the other 2 sensors (8.1% vs 43.4% vs 13.9%) and recorded lower rates of false detection of hypoglycemia (30%, 48%, and 29%). CGM-1 performed the worst and while failing to detect the presence of hypoglycemia and severe hypoglycemia as previously mentioned consequently had lower rates of false detection of hypoglycemia and severe hypoglycemia than the RCGM. CGM-2 failed to detect hypoglycemia at a rate nearly double that of the RCGM. Hypoglycemia detection characteristics are reported in Table 2.
Hypoglycemia Detection Performances.
Discussion
Based on mathematical modeling of the continuous glucose monitors characteristics, we showed that one can accurately simulate the behavior of CGM systems. This was performed by breaking the CGM signals into several components, from calibration to drift, time lag to colored noise. Borrowing and expanding from the literature, 41 a new model of CGM noise is proposed and fitted to clinical trial data. And while each sensor is represented by a specific set of parameters, we showed significant differences in the distribution of these parameters across 3 different CGM systems.
Using these models within our T1D simulation platform, we looked at the reaction of each system under a broad range of conditions such as hypo and hyperglycemia, triggered by treatment errors (eg, over/under insulin dosing), behavior (eg, exercise), and physiology (eg, change in insulin sensitivity). These different scenarios allowed for the generation of glucose fluctuations akin to in-vivo data and therefore the expansion of the accuracy study of the CGM systems beyond the source accuracy obtained in the clinical trials.
We showed that the RCGM system characteristics led to strong accuracy and precision, in both hypo- and hyperglycemia, comparing favorably to the performance of 2 alternate CGM systems under identical glycemic conditions. In particular, RCGM maintained high accuracy (MARD<10%) and precision across all studied glucose ranges and rate of change; in contrast to the other systems, whose performance, though sometime comparable, fluctuated significantly (see table 1). CGM-1 in particular suffered from serious inaccuracy in the hypoglycemic range.
Focusing on hypoglycemia, we showed that the RCGM characteristics lead to a detection of mild (<70 mg/dL) hypoglycemia on average with less than 4 minutes time lag (compared to 15 min and 24 min for CGM-1 and CGM-2), with a detection rate of 92% (vs 57% and 86%) but with a nonnegligible rate of false alarm of approximately 30% (vs 48% and 29%). This performance (and how it compared to CGM-1 and CGM-2) was confirmed when focusing on more pronounced hypoglycemia events (<55 mg/dL).
Scenarios were specifically designed to reproduce glycemic events (eg, hypoglycemia or fast rate of change) regardless of the sensor in use, therefore, this analysis does not allow for the determination of potential improvement in glycemic control by using 1 of the 3 systems over the others. Nonetheless, Kovatchev et al published in 2015 a different in-silico study looking specifically at the CGM characteristics that would be necessary for an entirely CGM-based treatment of T1D. 49 They concluded that a combination of MARD below 10% and a rate of large errors (beyond 20% of the reference) below approximately 12% should be sufficient for use of CGM systems as replacement for BG measurements; this result was further depicted by a curve linking MARD and the rate of large errors, later used to show system improvement by optimal signal treatment. 50 In Figure 4, we have represented the published curve with published CGM accuracy data from several articles38,50-52 as well as the data analyzed in this project. This figure clearly shows that the RCGM system’s predicted accuracy is well beneath the theoretical (obtained in simulation) threshold for nonadjunctive use in the treatment of T1D.
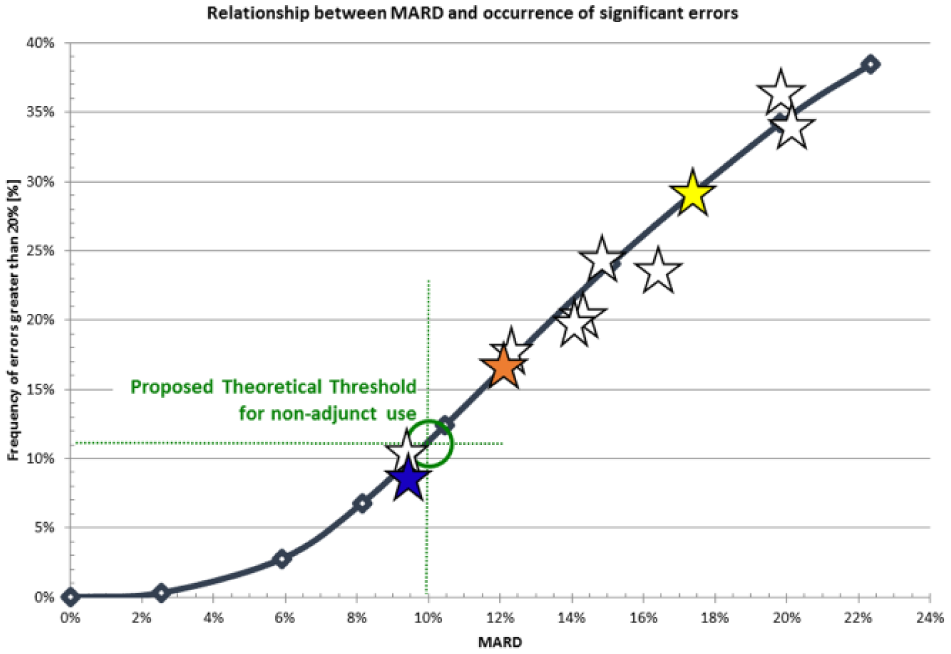
Relationship between MARD and rate of large error, and how they relate to the threshold for sole use of CGM in T1D treatment. White stars represent accuracy data from the literature, and RCGM (blue), CGM-1 (yellow), and CGM-2 (orange) are placed on the curve.
Conclusion
Using computer simulations, we explored the clinical relevance of sensor error characteristics derived from human clinical trials. This exploration led to the determination that the RCGM system may be more accurate in a broad set of conditions that 2 alternate systems, and that the RCGM sensor was particularly stable in its performances across glucose ranges and rates of change. We further predicted that based on these characteristics, the RCGM sensor should detect hypoglycemia more often and with better precision than 2 alternate systems.
Finally, the simulated results obtained in this analysis seemed to indicate that the RCGM system would be a strong candidate for CGM-based insulin treatment, as determined by Kovatchev et al. 49
Major weaknesses of this analysis included the small size of the original dataset (10-12 patients per sensor model), and the reliance on a mathematical model to generate sensor errors. In addition, the results obtained are predictions of performances from computer simulations, and therefore inherently limited by the capacity of the simulation platform. Approaches closer to clinical data such as presented in Kovatchev et al, 49 though also simulations, could boost confidence in the presented results, but ultimately, actual clinical risk/benefits analysis would be needed to support nonadjunct claims.
Nonetheless, simulations provide a unique environment to study the potential clinical impact of medical devices, allowing for precise control of the device characteristics and testing environment, as well as the capacity to explore a wide range of possible clinical scenario in a safe and cost-effective way. Technical performances of the RCGM were significantly better than the comparator systems in the original clinical data and these differences led to similar differences in simulated clinical outcomes. Such improvements would benefit from confirmation in long-term clinical studies.
Footnotes
Abbreviations
ARMA, autoregressive moving average; BG, blood glucose; CGM, continuous glucose monitor; CGM1, alternate continuous glucose monitor 1; CGM2, alternate continuous glucose monitor 2; CSII, continuous subcutaneous insulin infusion; IG, interstitial glucose; MAD, mean absolute deviation; MARD, mean absolute relative deviation; PARD, precision absolute relative deviation; PISA, pressure-induced sensor attenuation; RCGM, Roche continuous glucose monitor; T1D/T1DM, type 1 diabetes/type 1 diabetes mellitus.
Declaration of Conflicting Interests
MDB has received honorarium and consulting fees from Roche Diabetes. RH, MS, and GSR are Roche Diabetes Care employees. ECN and SR received funding from Roche for this work.
Funding
The author(s) disclosed receipt of the following financial support for the research, authorship, and/or publication of this article: Funding for this work was obtained from Roche Diabetes Care, Mannheim Germany. All simulations were run at The Epsilon Group.