
Abstract
Background:
Manufacturers now incorporate blood glucose (bG) value interpretation tools into their monitoring systems; however, usability of these support tools has not been well studied. We evaluated the utility and perceived benefits of support tool use by individuals with type 1 (T1D) and type 2 diabetes (T2D).
Methods:
This 3-arm, randomized, simulation study assessed the impact of use of bG value interpretation support tools on participants’ ability to correctly interpret bG values, using 1 of 3 tools: a new tool that uses colored scales with target range indicator (TRI), Colors and Smiley icons (already available). Participants assessed 50 bG values without use of any tool and repeated the assessment using 1 of the 3 tool configurations. Changes in percentage of correct responses when using a support tool and user perceptions were assessed.
Results:
Data sets from 140 participants were analyzed. Increases in correct responses were seen in all study groups but most notably in the TRI group (26%, P < .001) versus the Colors (3%, P = .018) and Smiley icons (6%, P < .001) groups. Significant improvements in confidence were seen among TRI users (P = .023) but not among other tool users (P > .627). Most TRI users felt confident (94%), agreed the tool will help them identify high and low values (96%) and will help them to make correct insulin dosage decisions (80%).
Conclusions:
Use of the TRI significantly increases users’ ability to correctly and confidently determine their glycemic risk when self-monitoring bG levels. This suggests the tool may offer clinical value to individuals with T1D and T2D.
Keywords
Use of structured self-monitoring of blood glucose (SMBG) regimens improves clinical outcomes and quality of life in patients with insulin-treated1,2 and non-insulin-treated diabetes.3-6 However, effective utilization of structured SMBG requires that patients are able to correctly interpret their blood glucose (bG) results and take appropriate actions when needed. 7
Anecdotal evidence suggests that many patients with diabetes do not know how to identify and interpret SMBG results or how their medications and health behaviors (eg, diet, exercise) influence their bG levels.8,9 This not only impacts patients’ ability to achieve and maintain desired glycemic control but can also negatively affect adherence to their prescribed testing frequency. 10
To assist SMBG users in better understanding their glucose testing results, many manufacturers are now incorporating bG result interpretation tools into their SMBG meters. Some systems utilize simple 2- or 3-color bar configurations to indicate within-range and out-of-range glucose values;11,12 whereas, others utilize basic interfaces, such as “smiley” icons, to inform users.13,14
The Accu-Chek® Instant blood glucose meter (Roche Diabetes Care GmbH, Mannheim, Germany), a new generation bG monitoring system, features a proprietary on-meter support tool (target range indicator [TRI]), that assists users in interpreting their bG results (Figure 1). The preprogrammed default glucose ranges were defined using the International Diabetes Federation (IDF) guidelines for high values 15 and American Diabetes Association (ADA) guidelines for low values. 16
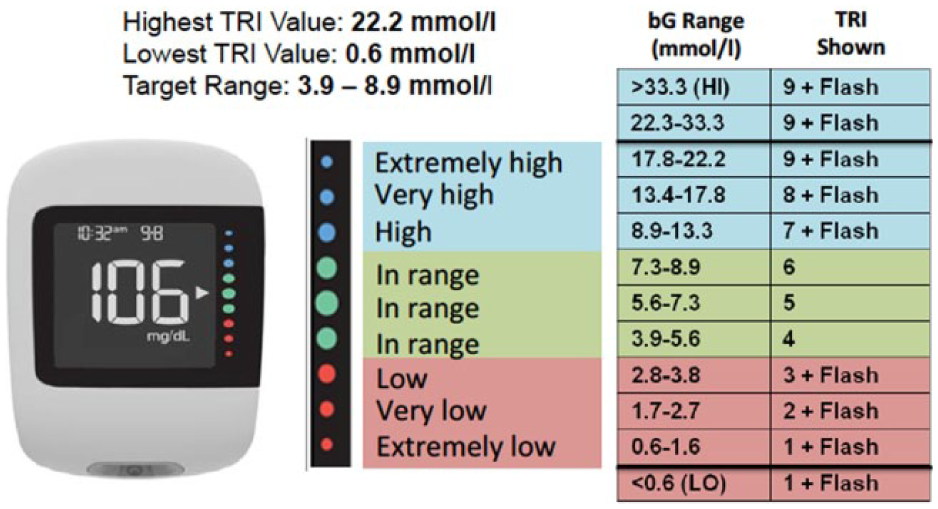
Study device. With the TRI tool, glucose risk is indicated by 9 colored dots, which are located on the right side of the display. A white arrow is positioned next to the dot that corresponds with the current glucose reading. The arrow blinks when glucose values are too high or too low. Glucose range settings can be individualized to meet user needs.
Unlike other support tool configurations, the TRI assesses bG values against a 9-point scale with 3 categories of high bG (high, very high, extremely high) and low bG (low, very low, extremely low) results.
Although it is reasonable to hypothesize that SMBG systems with integrated data interpretation support tools can enhance patients’ ability to more correctly assess their glycemic risk, studies of these tools are limited. 17 We report findings from a study that evaluated the clinical utility and perceived benefits of support tool use by individuals with type 1 (T1D) and type 2 diabetes (T2D).
Methods
Design
This single-center, 3-arm, randomized, simulation study was conducted in a nonclinical facility in London, UK, by staff from Use-Lab GmbH, an international, independent usability expert for medical devices. The study objective was to assess the impact of using data interpretation support tools on participants’ ability to correctly interpret bG results, comparing the TRI support tool configuration with 2 other on-meter support tools, “Colors” and “Smiley” icons (Figure 2).
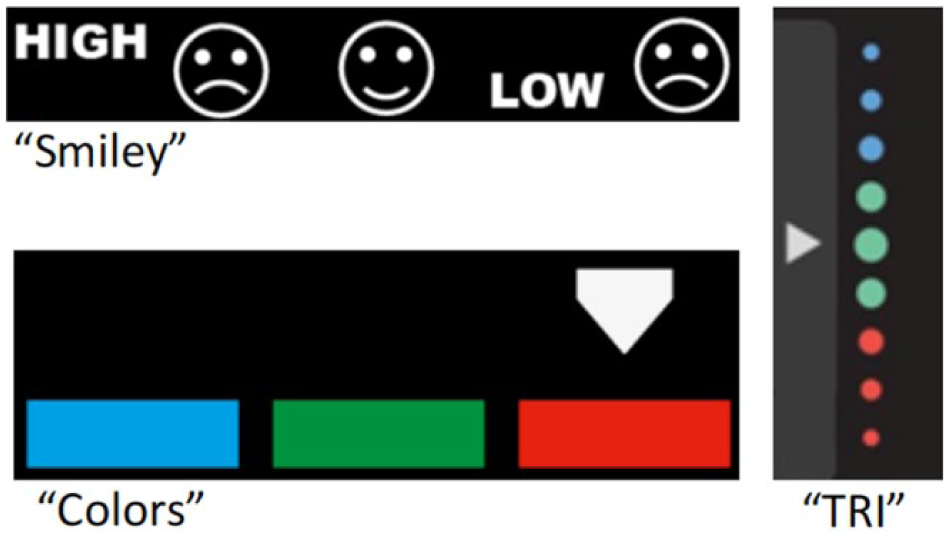
Support tool configurations.
Participants
Study participants were recruited from the greater London area, according to a defined set of screening criteria. An institutional review board approved the study. All participants gave their informed consent.
Study participants were age 16-81 years with T1D or T2D. The goal was to include 10% T1D participants and 90% T2D participants to create a cohort that is representative of the general diabetes population. Inclusion criteria were reported use of a blood glucose meter; agreement to be videotaped during testing; and agreement to sign a confidentiality agreement. Exclusion criteria were prior use of a blood glucose meter with bG result interpretation features comparable to the tools used in the study; mental or extreme physical incapacity (including illness or visual impairment) that might interfere with the testing; unwillingness to perform required tasks; language barriers; self-reported participation in market research of blood glucose meters within the past 6 months; or any personal or family tie to a medical company or market research company.
Measures
The primary measure of the study was change in the percentage of correctly categorized bG values (based on the bG ranges derived from international guidelines), comparing no tool use versus use of 1 of the 3 support tools. Participant preferences and perceptions of support tool usefulness, clinical utility and benefits were also assessed.
Procedures
Investigators conducted individual sessions with participants. Sessions were divided into 3 parts: Part 1, categorization of bG values (mmol/L) without a support tool; Part 2, categorization of bG values, using 1 of the 3 support tool configurations; and Part 3, rating of 7 bG meter displays with integrated support tools from different manufacturers (Figure 3). A tablet computer (Samsung® Galaxy Note 2014 Edition) was used to present bG results and collect participant responses.
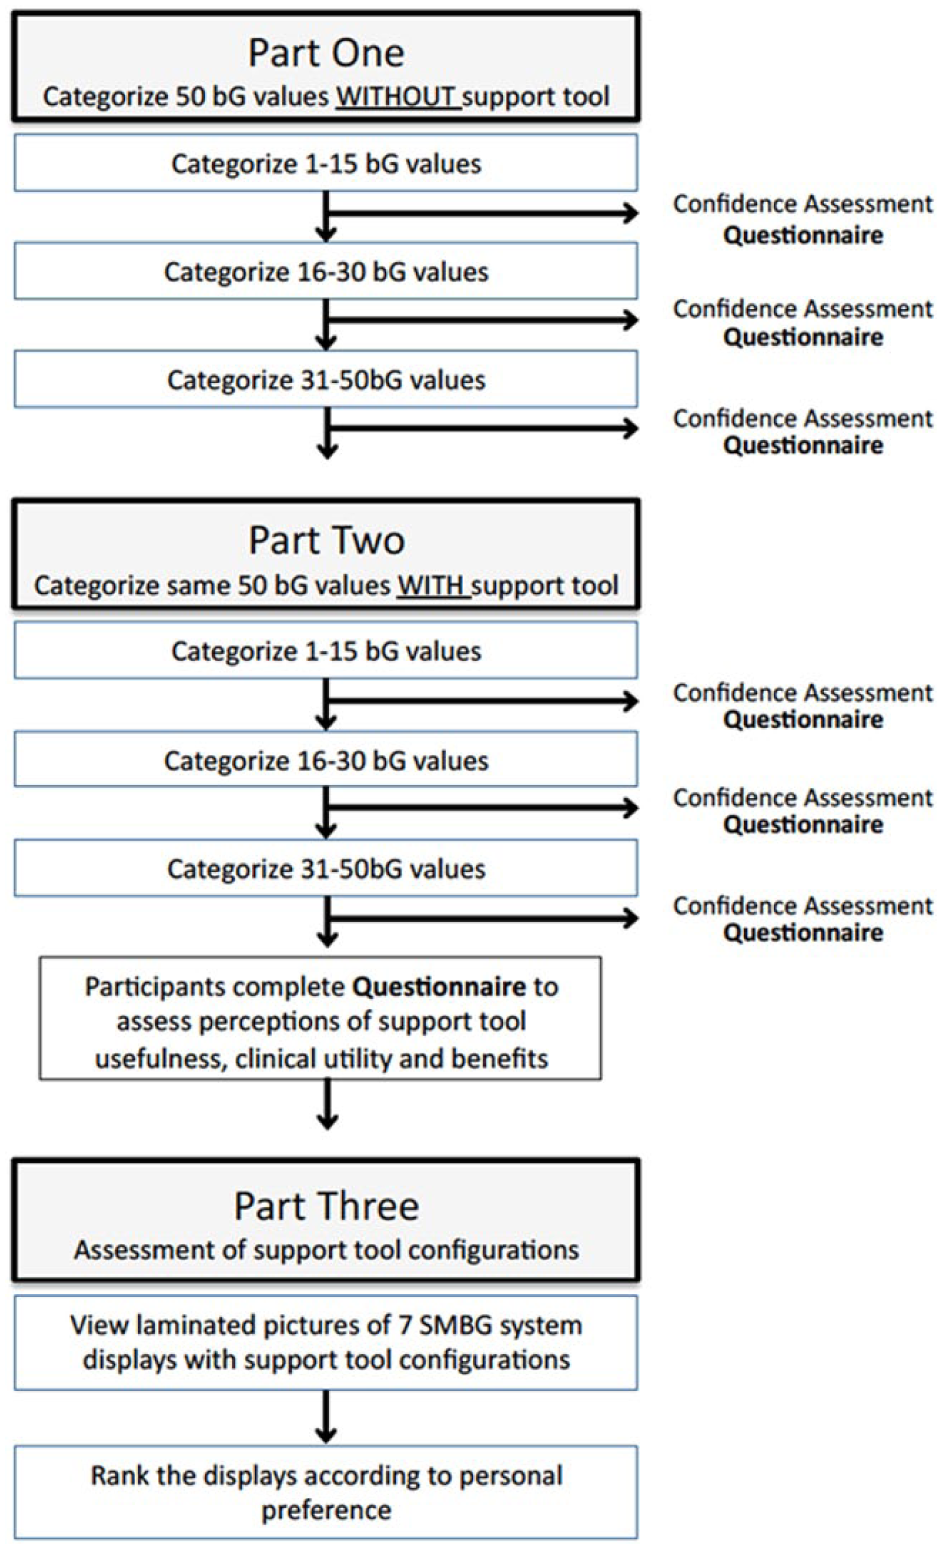
Study design.
Part 1
Participants were asked to categorize 50 different bG values into 1 of the 7 corresponding categories without the use of any support tool (Figure 4A). The bG values were presented in random order to minimize any potential sequence effects. Participants categorized bG values, using a scale that ranged from “extremely high” (18.8-22.2 mmol/l); “very high” (13.4-17.8 mmol/l); “high” (8.9-13.3 mmol/l); “in range” (3.9-8.9 mmol/l); “low” 2.8-3.8 mmol/l); “very low” (1.7-2.7 mmol/l); and “extremely low” (0.6-1.6 mmol/l). These values were derived from the International Diabetes Federation (IDF) guidelines for high values 15 and American Diabetes Association (ADA) guidelines for low values. 16
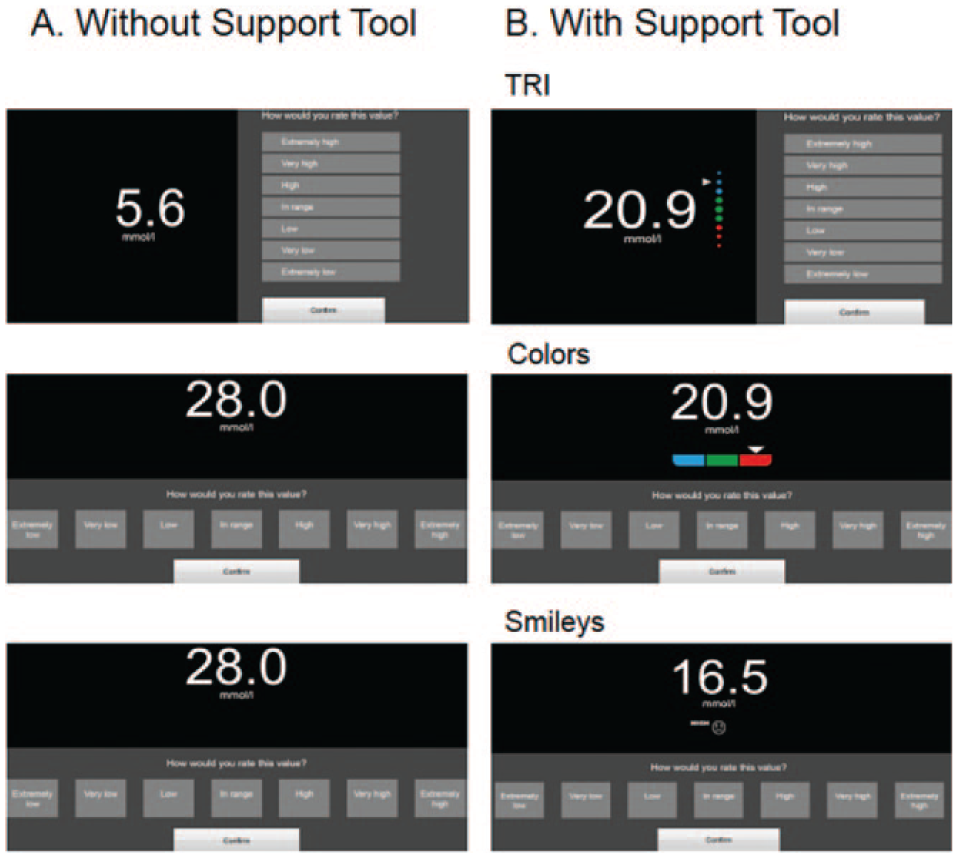
Simulation screenshots: without support tool (A) and with support tool (B).
Immediately following categorization of the 15th, 30th and final bG values, participants were asked to assess their confidence in categorizing the bG values, using an investigator-developed, 4-point confidence scale: 1 = “not confident at all”; 2 = “somewhat confident”; 3 = “confident”; and 4 = “very confident.”
Part 2
Participants were randomized to use of 1 of the 3 support tools (TRI, Colors or Smiley icons) and asked to categorize the same 50 bG values using their assigned tool configuration. Use of the 3 different support tools was randomized and equally distributed among participants (TRI, n = 47; Colors, n = 46; Smiley icons, n = 47) (Figure 4B). The bG values were presented in random order and participants’ confidence was again assessed after the 15th, 30th and final values. Participants then completed an investigator-developed questionnaire that included a series of questions regarding the participants’ perceptions of the usefulness, clinical utility and benefits of the support tool they evaluated. Participants’ perceptions of the intuitiveness and benefits of the support tools evaluated were reported and calculated using a 5-point Likert-type scale: 1 = “disagree”; 2 = “somewhat disagree”; 3 = “neither agree nor disagree”; 4 = “somewhat agree”; 5 = “agree.”
Part 3
All participants viewed real-size laminated pictures of bG glucose meter displays from different manufacturers (Figure 5). Three versions of each display (low bG value, in-range bG value, high bG value) were presented to participants in random order. Participants were asked to rank the 7 different displays according to personal preference.
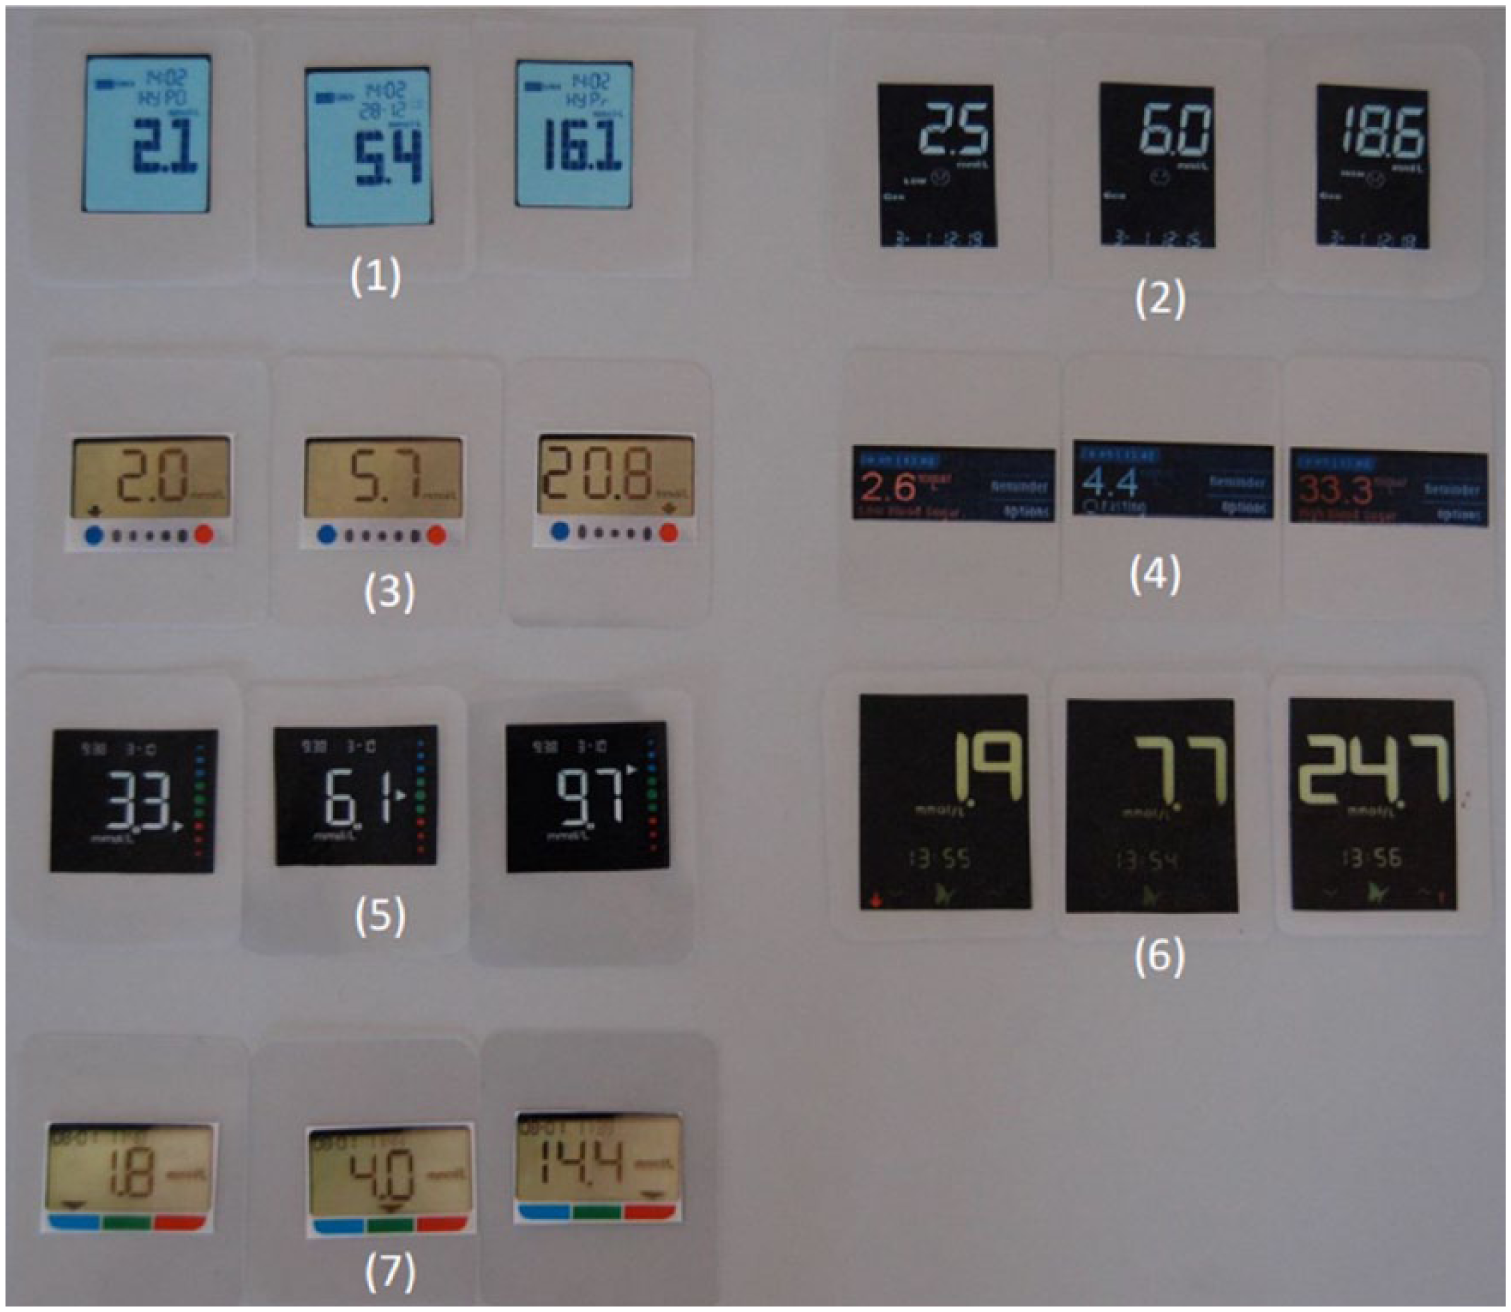
SMBG meter displays.
Analysis
Change in the percentage of bG values correctly categorized by participants was calculated by comparing the median number of correct responses from Part 1 to the median number of correct responses reported in Part 2. Change is reported by the specific support tool configuration. Pairwise Mann-Whitney U tests were conducted to confirm equal distribution of the initial correct responses from Part 1. Wilcoxon Signed Rank tests were used to assess the significance of changes in correct responses and confidence scores; P < .05 was considered statistically significant. Correlative and regression models, drawing on responses to other questions (eg, demographic variables), were applied to determine whether demographic characteristics (eg, type of diabetes, duration of diabetes, education levels) and other factors (eg, self-reported bG testing frequency and “effort managing diabetes”) were significant predictors of correctness in categorizing bG values and other change metrics. Categorical variables were summarized using counts and percentages of patients in each category.
Results
Participants
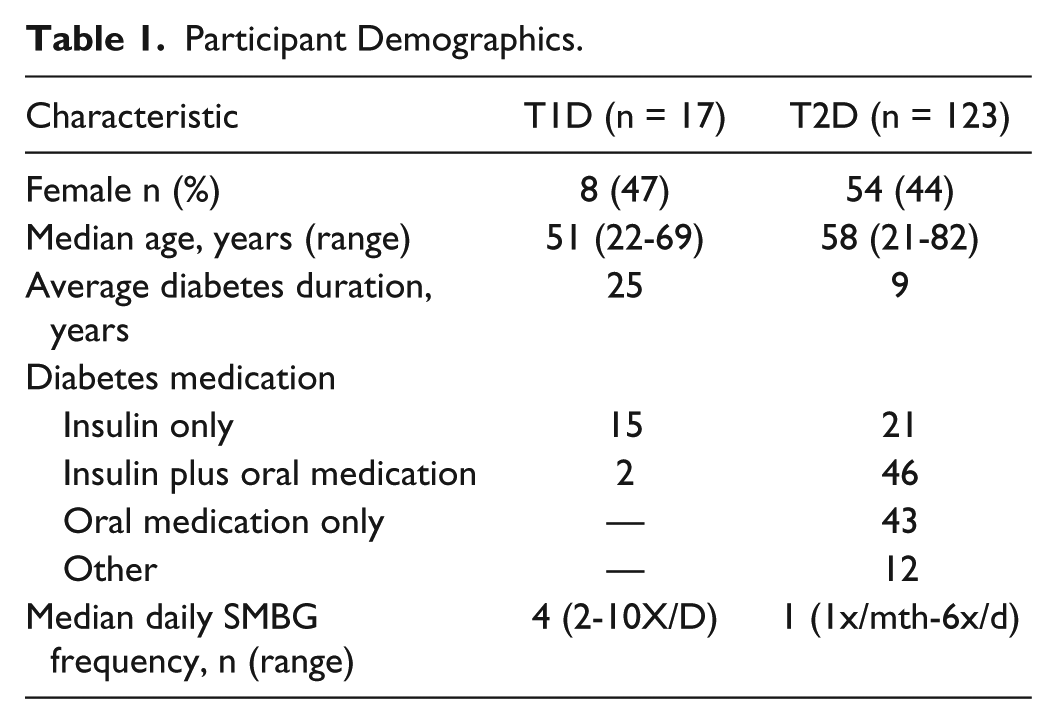
A total of 156 participants were tested. Data sets from 16 participants were excluded: 2 reported that they did not perform SMBG prior to the study; 1 did not speak English; 13 participants had to be eliminated due to software issues at the beginning of the study. Data sets from 140 participants (62 female, 78 male) are included in our analysis. The majority (85) of participants reported having a general certificate of secondary education (GCSE), bachelor’s, A-level, or master’s degree; 7 reported no degree. Participant characteristics by diabetes type are presented in Table 1.
Participant Demographics.
Categorization of bG Values
Correct Identification
The median percentage of correct bG values categorized without a support tool was 62% among all participants (n = 140). The median percentages of correct responses did not differ significantly between the 3 groups (P > .07) when using no support tool. The majority (87%) of all participants reported that they felt confident interpreting their bG values without the use of any support tool after Part 1.
Significant increases in the percentage of correct responses were seen with use a support tool in all 3 study groups (Figure 6). The increase in correct responses was most notable among TRI participants (26%, P < .001) but minimal among participants who used the Colors (3%, P = .018) and Smiley icons (6%, P < .001) tools. Among the T2D cohort, 20 (48%) of participants who used the TRI tool scored >90% correct responses; whereas, no participants using either the Colors or Smiley icon tools achieved >90% correct responses.
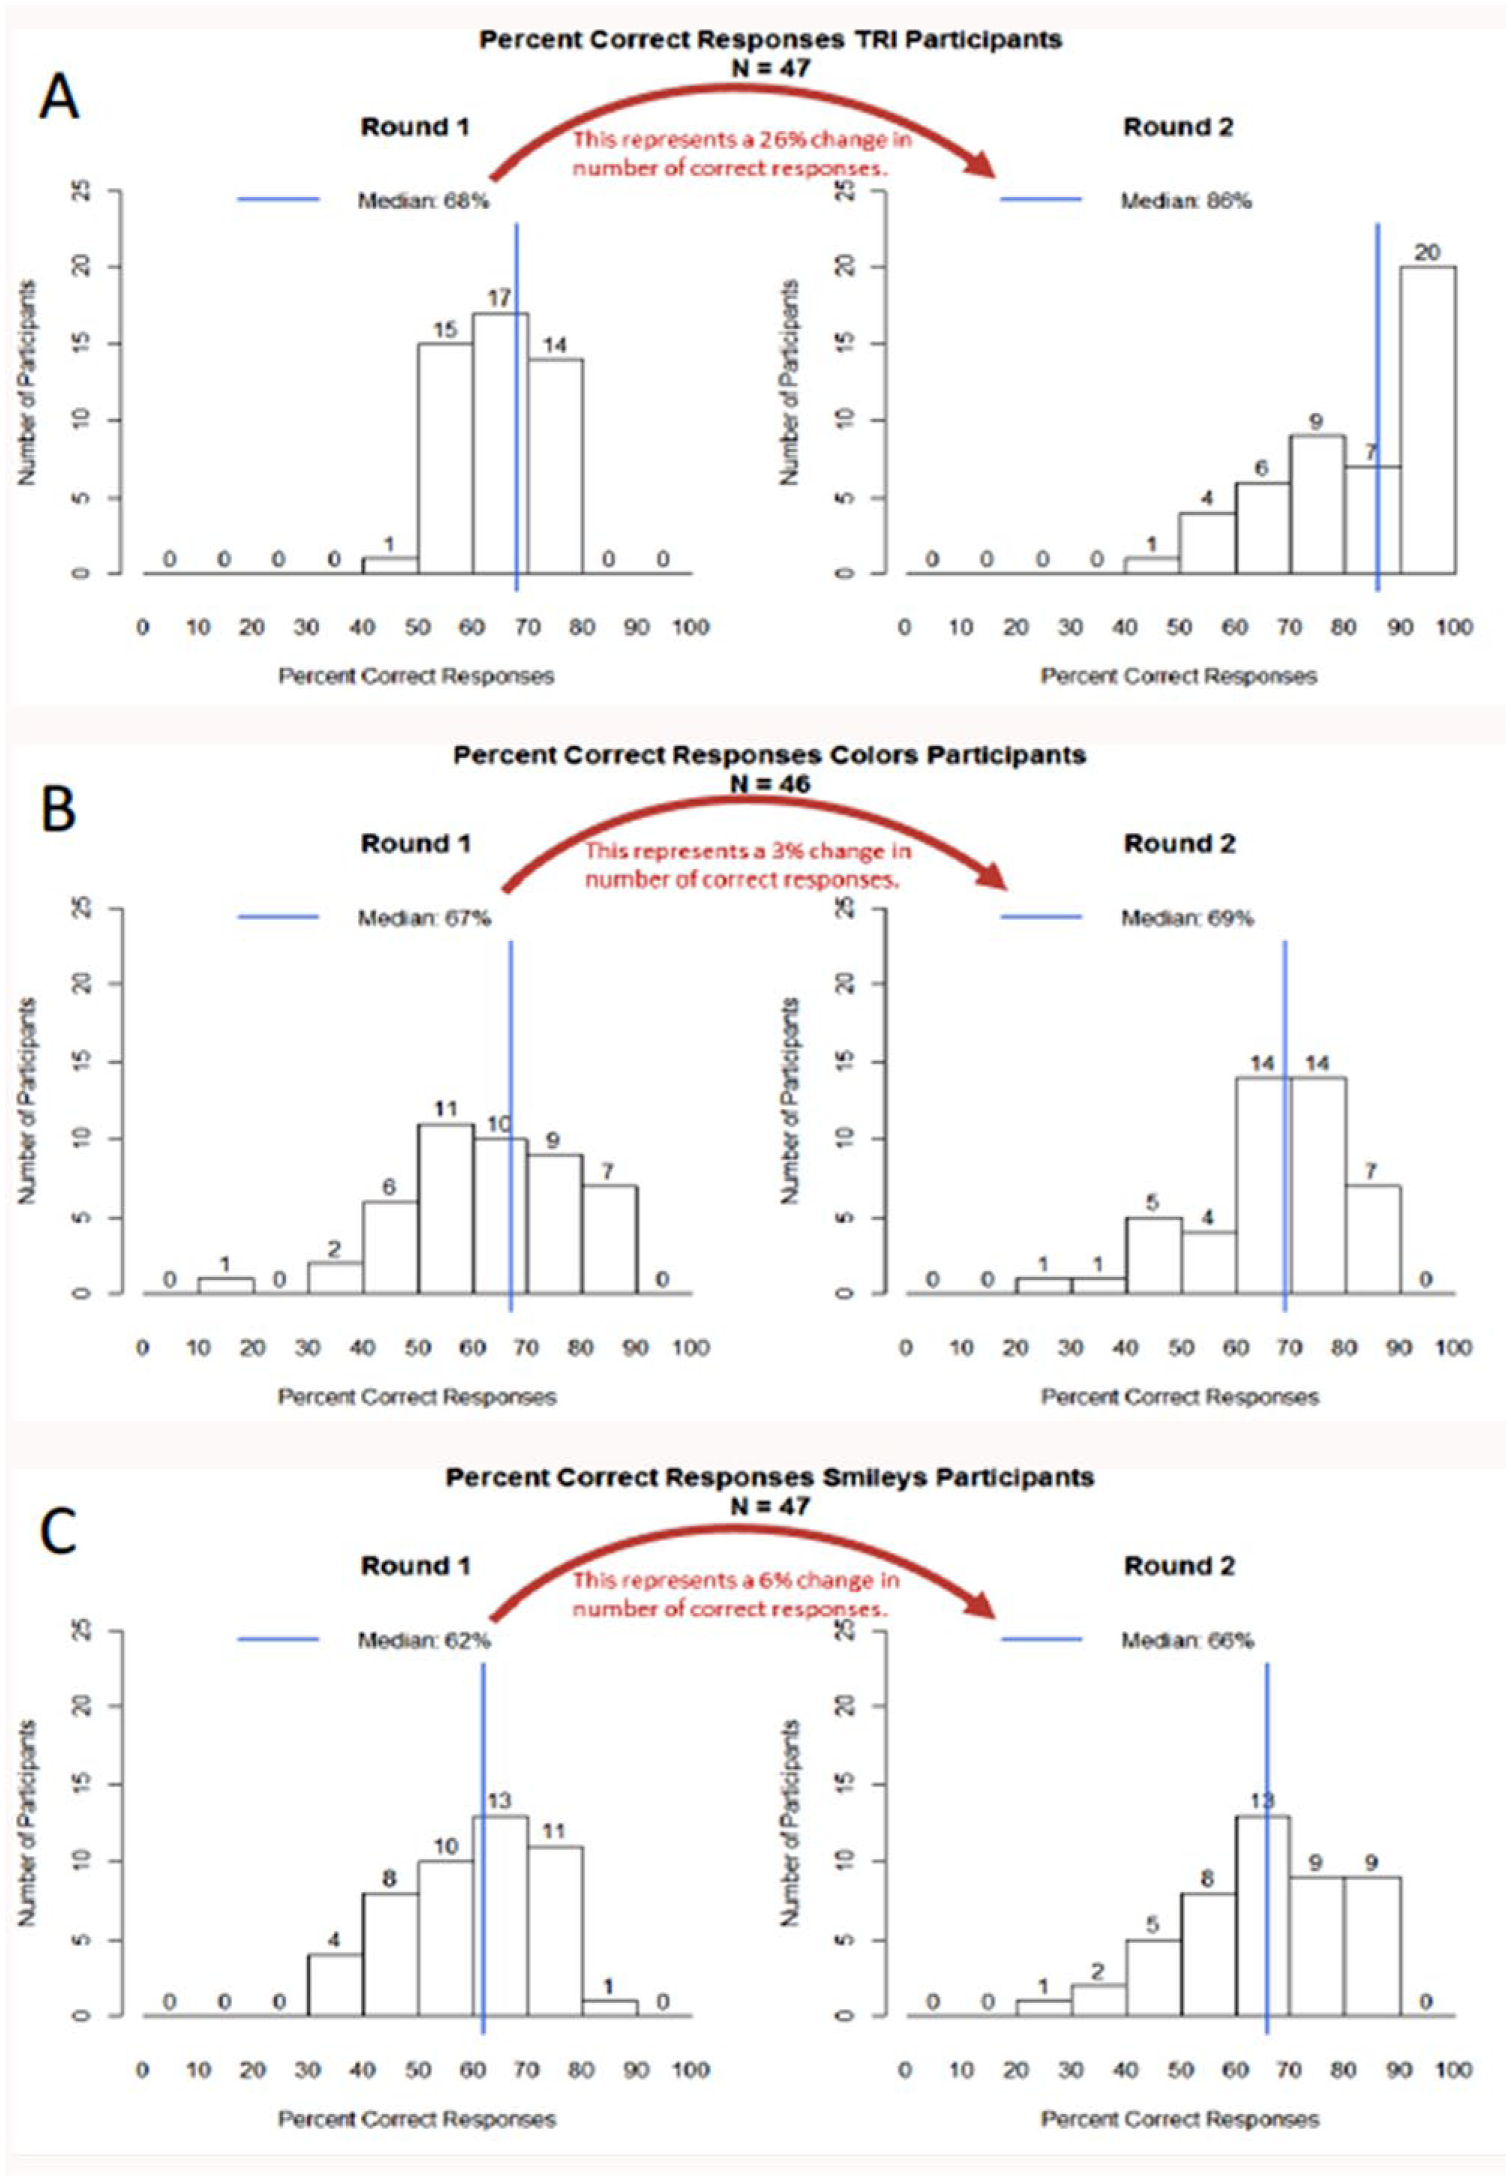
Percentage of correct responses to support tool study group. The graphs show the distribution of individuals within each group according to their percentage of correct responses, from 0% to 100% correct. The change in correct categorization of glucose values was calculated by comparing the median percentage of correct answers from Part 1 (no tool used) to the median percentage of correct answers obtained in 2 (tool used) for each of the 3 study groups. The increase in median percentage of correct answers was statistically significant in all study groups; however, the increase was most notable in the TRI group (26%, P < .01) (Panel A) compared to the Colors group (3%, P = .0018) (Panel B) and Smileys group (6%, P < .001) (Panel C). A P value < .05 was considered statistically significant.
Three variables had a significant influence on the improvement from Part 1 to Part 2: (1) participants’ percentage of correct responses in Part 1; (2) whether participants used the TRI tool; and (3) the deviation of the predefined range (absolute deviation of their minimum from 3.9 plus absolute deviation of their maximum from 8.9) from participants’ personal target range. No other variables significantly predicted accuracy improvement. Interestingly, neither participant’s experience with diabetes, (eg, diabetes duration, bG testing frequency and self-reported “effort managing diabetes”) nor the type of diabetes (T1D and T2D) were significant predictors of improvement.
Confidence
Significant changes in confidence scores were seen among TRI users (P = .023), but not among users of the other tools (P > .627). The change was most notable in the change in percentage of TRI users who reported feeling “very confident” (from 36% to 53%) versus no change in the Colors (from 23% to 23%) or icons (from 26% to 26%) groups. Most TRI users (94%) felt confident when using the tool.
Participant-Reported Perceptions
Improved Level of Correctness
The majority of all participants reported that the support tool configurations they evaluated would help them correctly (91%), easily (86%) and quickly (90%) interpret their bG values. A large percentage of all participants (94%) reported that they believe the support tool would help them identify high or low glucose values regardless of the support tool use (Table 2). Among TRI users, the percentage of agreement was notably higher in most of these categories. The majority of all participants agreed that the support tool configurations were intuitive (86%).
Reported Perceptions of Support Tool Helpfulness, Clinical Utility and Preferences/Benefits.
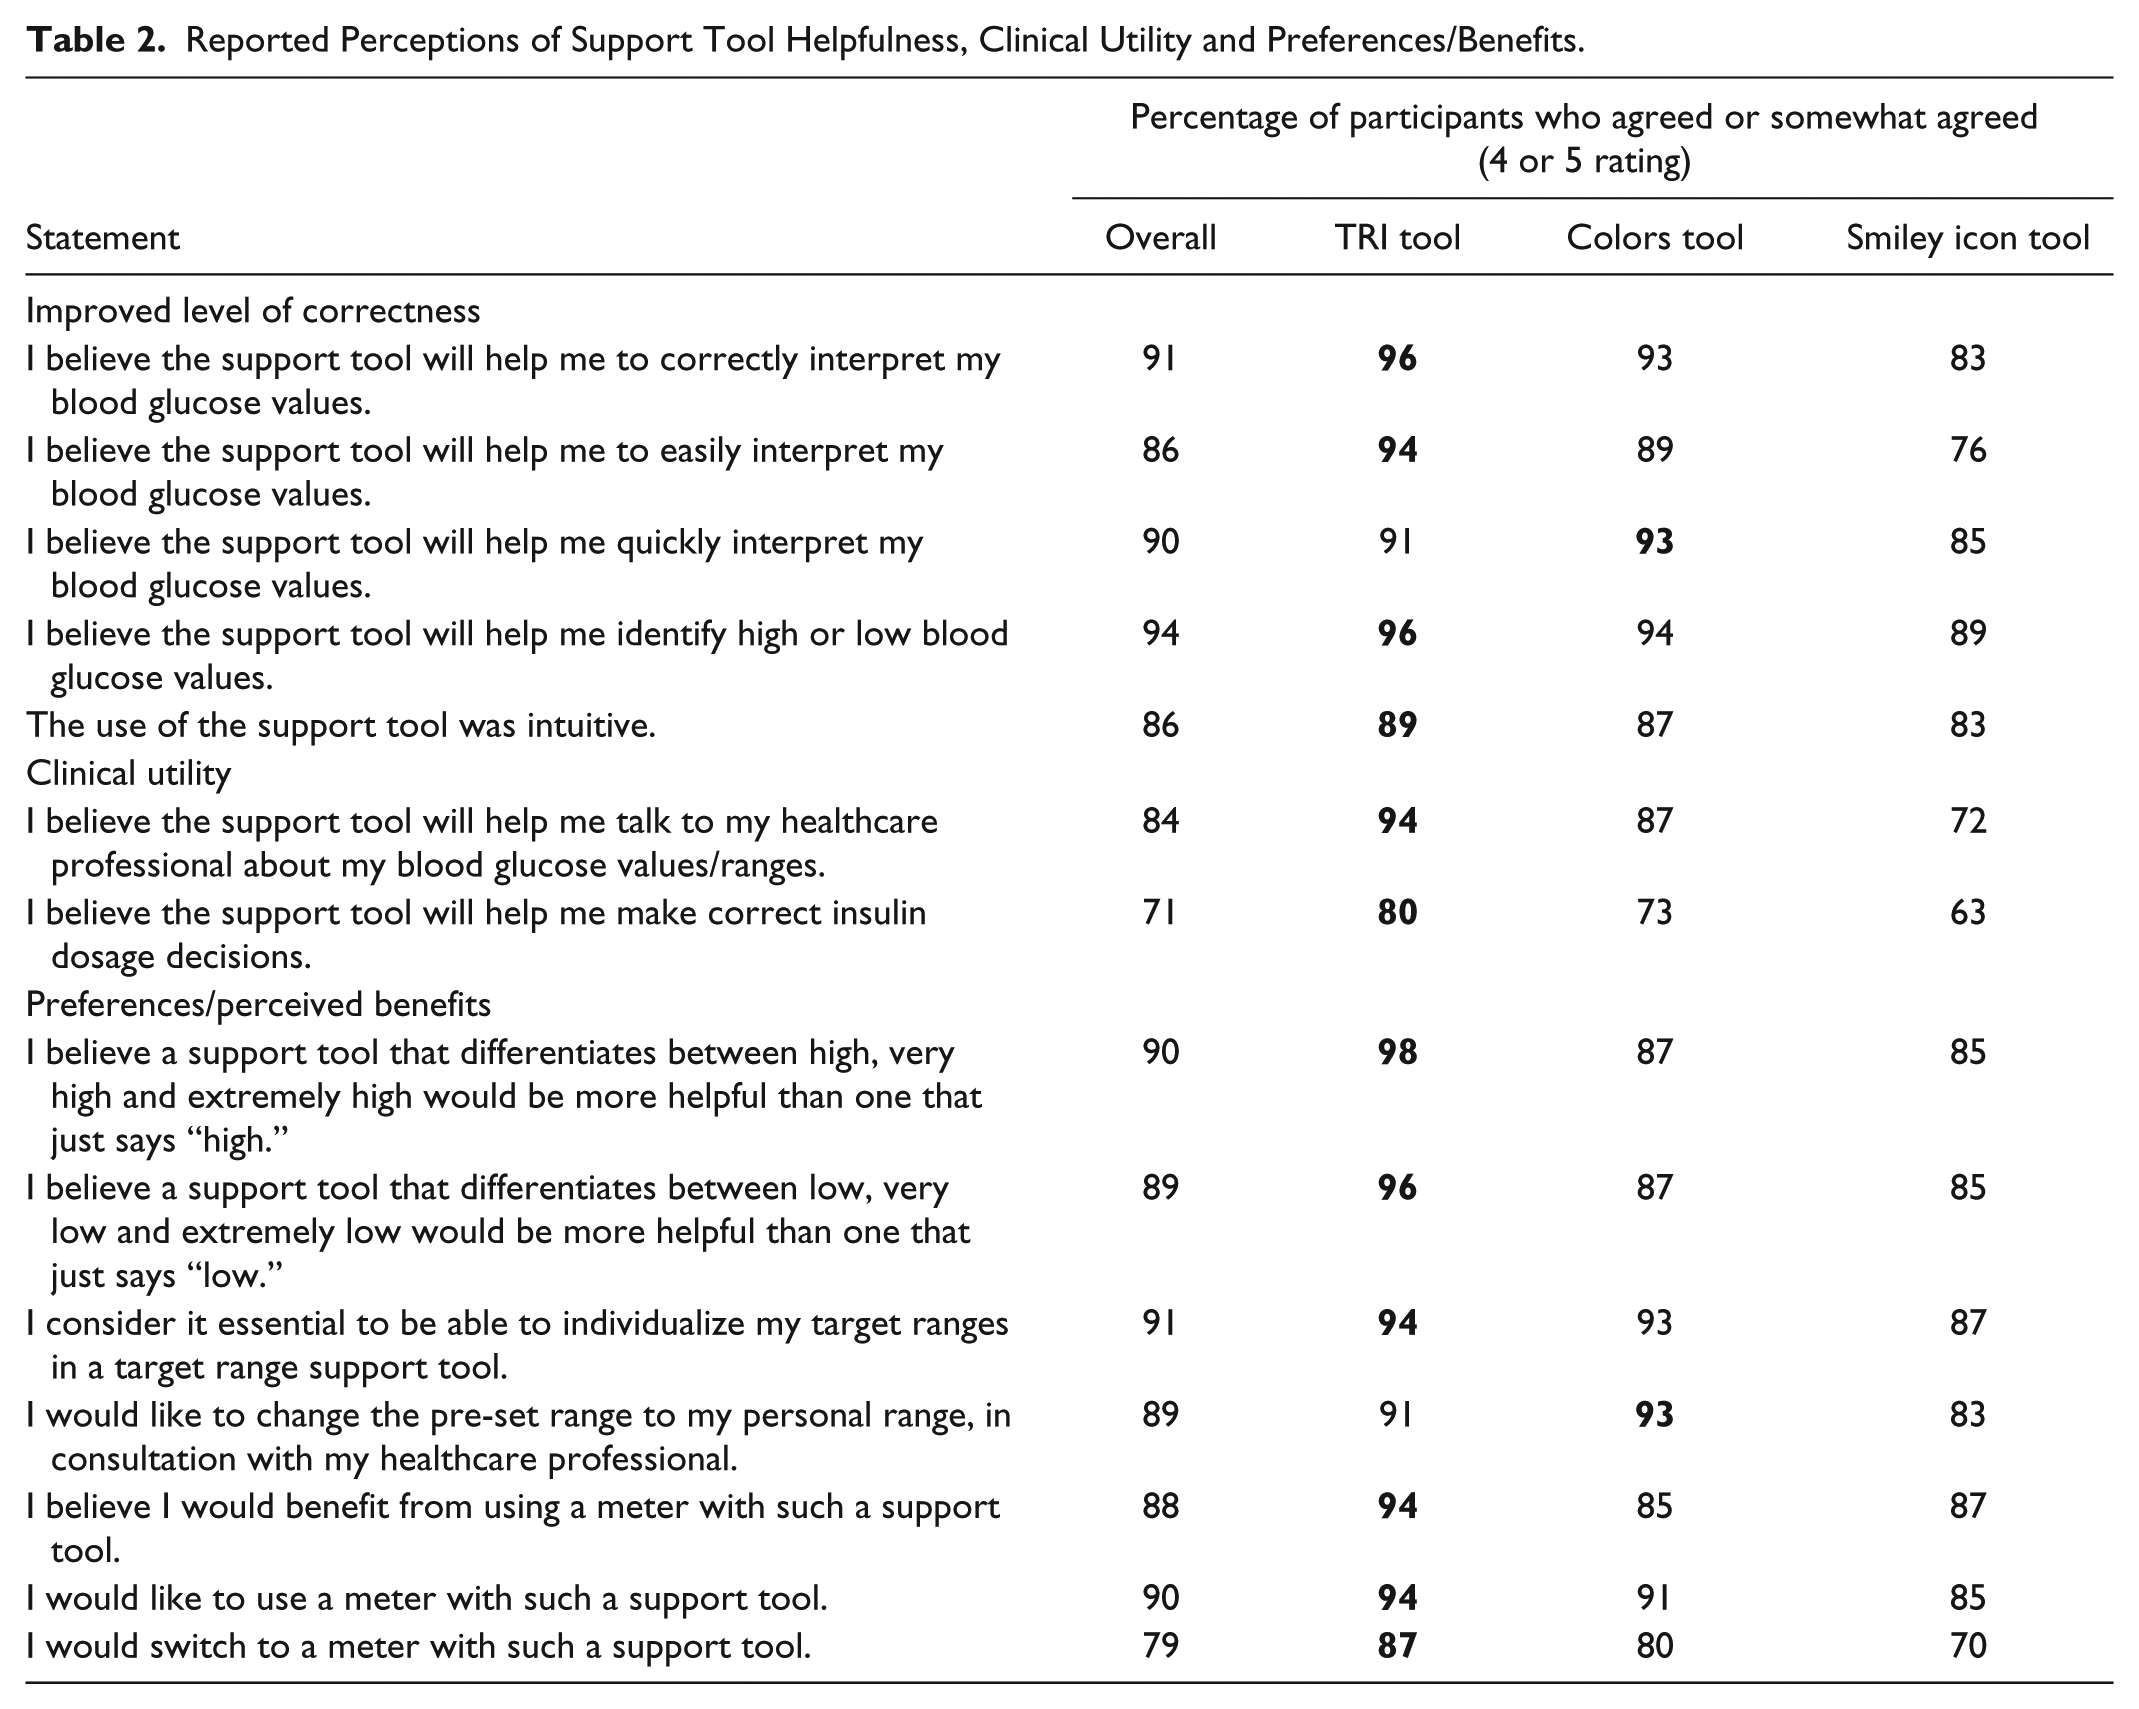
Clinical Utility
The majority of all participants agreed that the support tool configurations would help them talk to their health care professional about their bG data (84%); however, the level of agreement was the highest for the TRI participants (Table 2). Among all insulin-treated participants (n = 84), the majority of participants (74%) reported that they believe use of the support tool will help them make correct insulin dosage decisions; again agreement was the highest among TRI participants (80%).
Preferences/Perceived Benefits
The majority of all participants, particularly TRI participants, agreed that a scale that differentiates between 3 levels each of high and low bG values is more helpful than one that does not (Table 2). The ability to individualize target ranges was also reported as an important feature (91%). Red was considered the strongest warning color by 90% of all participants.
Most participants agreed that they would benefit from use of a support tool (Table 2). A higher percentage of participants preferred the TRI configuration (94%) and reported they would switch to a meter that offers this support tool (87%).
In the Part 3 analysis, participants were asked to rank 7 SMBG meter displays from different manufacturers, all incorporating a support tool. The display of the Accu-Chek Instant system was rated as the most preferred one (Figure 7).
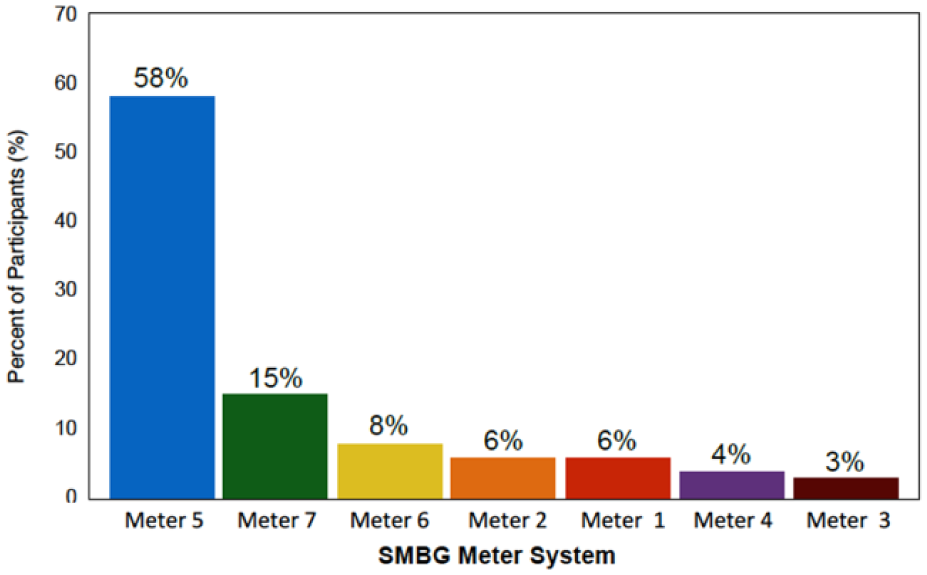
Participant preferences for integrated support tools (n = 140). The majority of participants preferred the TRI support integrated into the Accu-Chek Instant blood glucose monitoring system (Meter 5).
Discussion
Use of SMBG provides immediate feedback and data that enable people with diabetes to assess the impact of food choices, physical activity levels and medications on their blood glucose control. When utilized within a structured testing regimen, SMBG has been shown to improve glycemic control and quality of life in individuals with T1D and T2D.1-6 However, despite the immediate availability of bG information, many patients with diabetes cannot correctly interpret or appropriately act on their SMBG results.8,9 This knowledge deficit can adversely affect adherence to testing and, ultimately, clinical outcomes.10,18
Because correct interpretation of bG values and appropriate subsequent actions are essential for safely achieving desired glycemic control, 7 some manufacturers are now incorporating bG result interpretation tools into their SMBG meters. Although it is reasonable to hypothesize that these support features will improve patients’ ability to correctly assess their glycemic status, our study is the first formal assessment of the clinical utility of different bG interpretation support tools.
As reported here, use of an on-meter support tool increases patients’ ability to quickly, easily and more correctly determine their glycemic risk when self-monitoring their bG levels. Although statistically significant increases in correct categorizations of bG values were observed with all 3 support tool configurations, the 26% increase seen among TRI users was notably significant compared with use of the Colors (3%) or Smiley icon (6%) support tools. Moreover, when assessing the clinical utility of their support tool, a larger percentage of participants reported that the TRI tool was intuitive, would facilitate communications with their health care professional, and would help them make correct insulin dosage decisions.
The study also provides important insights into participants’ preferences regarding support tool design. Specifically, almost all participants reported a preference for a support tool that differentiates various levels of high (90%) and low (89%) bG levels (Table 2). Only the TRI support tool currently offers this differentiation.
The ability to differentiate between various levels of high and low bG is critical to appropriate decision making. For example, in T1D patients, a “high” bG (8.9-13.3 mmol/L [160-239 mg/dL]) should prompt further investigation regarding the need for treatment adjustment (eg, dosage change, health behaviors); whereas, an “extremely high” bG (17.8-22.2 mmol/L [320-400 mg/dL]) should prompt the patient to immediately check ketone levels and seek treatment for diabetic ketoacidosis if required. 19 Conversely, whereas, mild hypoglycemia (low bG) can be self-treated with simple carbohydrate intake, more severe hypoglycemia (very low bG, extremely low bG) may require glucagon injection or assistance from a third party. 20
A key strength of the study was use of correlative and regression models to determine variables that may have influenced changes in correctly interpreting bG values, comparing Part 1 versus Part 2. As reported, neither experience with diabetes (eg, diabetes duration, SMBG frequency, time and effort in self-management) nor the type of diabetes (T1D or T2D) had an impact on participants’ ability to correctly interpret bG results. This supports the generalizability of our findings to the majority of patients with diabetes regardless of their prior experiences, behaviors or type of diabetes.
As reported, the median correctness score seen in the TRI group during Part 1 was only slightly higher than observed in the other study groups; however, the percentage of correct baseline responses within the 60% to 80% ranges was notably higher. This likely created less opportunity for improvement for TRI participants than the other groups, suggesting that improvements may be much greater among individuals who assess their bG results less correctly. Another strength was that the proportion of study participants with type 1 diabetes (12.1%) versus type 2 diabetes (87.9%) was highly representative of the total diabetes population, 21 which, again, supports the generalizability of our findings.
A potential limitation of the study was use of preset target ranges, which may have deviated from participants’ individual ranges. As discussed, this was an influential variable and may have affected some improvement scores. Another limitation is the lack of clinical outcomes data. Our study was designed to measure changes in participants’ ability to correctly categorize bG values but did not assess clinical outcomes related to support tool use.
Conclusions
The study demonstrated that using any of the tested bG interpretation support tools can improve patients’ ability to correctly, easily and quickly categorize bG values according to international recommended ranges. These improvements were especially notable among participants who used the TRI support tool. This suggests that the TRI tool may offer greater clinical value to individuals with T1D and T2D compared with other support tool configurations, regardless of the user’s experience with diabetes.
Footnotes
Acknowledgements
The authors thank all of the individuals for their participation in the study.
Abbreviations
ADA, American Diabetes Association; bG, blood glucose; IDF, International Diabetes Federation; SMBG, self-monitoring of blood glucose; TRI, target range indicator.
Declaration of Conflicting Interests
The author(s) declared the following potential conflicts of interest with respect to the research, authorship, and/or publication of this article: CGP has provided consulting services to Animas, Boston Therapeutics, CeQur, Dexcom, Inc, Insulet Corporation, Roche Diabetes Care, Sanofi. SS, AKO, and TG are employees of Use-Lab GmbH, which received funding for conducting the study.
Funding
The author(s) disclosed receipt of the following financial support for the research, authorship, and/or publication of this article: Funding for this study was provided by Roche Diabetes Care GmbH, Mannheim, Germany.