
Abstract
Background:
This study aimed to evaluate the effects of information management system (IMS) use with individuals with type 1 and type 2 diabetes who were treated in outpatient settings.
Methods:
In this 7-month, prospective, observational study, 965 adults with diabetes, mean (SD) baseline HbA1c 8.61(1.2)% (70.6[13.1] mmol/mol), were recruited from 132 outpatient care centers in Germany and Denmark. HbA1c was measured at baseline, month 4, and month 7. IMS reports were generated from uploaded self-monitored blood glucose data and therapy adjustments were documented at months 1 and 4. Hypoglycemic events were documented.
Results:
Mean (SD) HbA1c decreased from baseline in type 1 and type 2 diabetes patients at month 4 (–0.61[1.03]% (–6.7[11.3] mmol/mol), n = 213; –0.88[1.22]% (–9.6[13.3] mmol/mol), n = 589, respectively) and month 7 (–0.64[1.02]% (–7.0[11.1] mmol/mol), n = 219; –0.93[1.27]% (–10.2[13.9] mmol/mol), n = 594, respectively), all P < .0001, with no increase in hypoglycemic events. Therapy was adjusted in 106(42.7)% type 1 and 349(52.4)% type 2 diabetes patients at months 1 and 105(42.3)% type 1 and 282(42.3)% type 2 diabetes patients at month 4. Physicians used IMS reports to make therapy adjustments in 90% of patients at month 1 and 86% of patients at month 4.
Conclusions:
Integration of the IMS into outpatient care facilitates significant improvements in glycemic control.
New approaches to glucose monitoring and advances in information management technology have shown significant potential to improve diabetes management. Use of structured self-monitoring of blood glucose (SMBG) within collaborative patient-clinician relationships has been shown to improve metabolic control in both insulin-treated1,2 and non-insulin-treated diabetes3-6 and is practical in real-world outpatient settings. 7 However, analyzing and interpreting SMBG data from patient logbooks is often problematic due to inaccurate and/or incomplete information.8,9 In addition, both patients and their clinicians may be overwhelmed by the vast amount of data included in the logbook that must be reviewed. 8
Utilization of a diabetes information management system (IMS) may help overcome these obstacles. Use of an IMS has been shown to enhance glycemic control.10,11 A recent prospective, online survey showed that use of IMS reports by clinicians and patients naïve to diabetes management software facilitates greater accuracy and efficiency in analyzing and acting on patient diabetes data. 12 However, the impact of IMS-supported diabetes management in real-world clinical settings has not been well studied.
We hypothesized that use of an IMS would facilitate adoption of structured SMBG regimens and improve glycemic control in individuals with type 1 and type 2 diabetes. To test this hypothesis, we designed a large prospective, observational study using an IMS in conjunction with structured SMBG.
Materials and Methods
Design
The VISION study was a 7-month, prospective, multicenter, observational investigation of diabetes management supported by use of IMS-supported diabetes management with type 1 and type 2 diabetes patients treated in outpatient settings. The IMS used in the study was the Accu-Chek Smart Pix system (Roche Diagnostics GmbH, Mannheim, Germany). The IMS transfers SMBG data from a compatible blood glucose meters to an office computer. An analysis function generates glucose profiles and statistics, and a reporting function visualizes the data in reports as tables and figures.
In the study, physicians prescribed individualized structured SMBG regimens to patients and uploaded the data to the IMS for analysis and discussion with patients. Based on these analyses, physicians reviewed the findings with patients and adjusted therapy as needed.
The study was conducted in accordance with the International Guidelines for Ethical Review of Epidemiological Studies 13 and pertinent national law. The protocol was approved by Freiburger Ethik-Kommission International (Institutional Review Board/Independent Ethics Committee), and written informed consent was obtained from all patients.
Subjects
The study enrolled 965 patients from 132 primary care, internal medicine, and diabetes-specialized practices in Germany and Denmark. Inclusion criteria included age ≥ 18 years; type 1 or type 2 diabetes for >1 year prior to inclusion in the study; treatment with oral antidiabetic medication (OAD), GLP-1, and/or insulin (but not insulin pump therapy); suboptimal glycemic control (HbA1c ≥7.5% [58.5 mmol/mol]) within 6 weeks prior to study); SMBG frequency ≥4 time per week.
Information Management System
The IMS used in the study comprises a device reader to transfer SMBG data from the blood glucose meter to the office computer, an analysis function that generates SMBG profiles and statistics, and a reporting function that visualizes SMBG results in reports as tables and graphs (Figure 1).
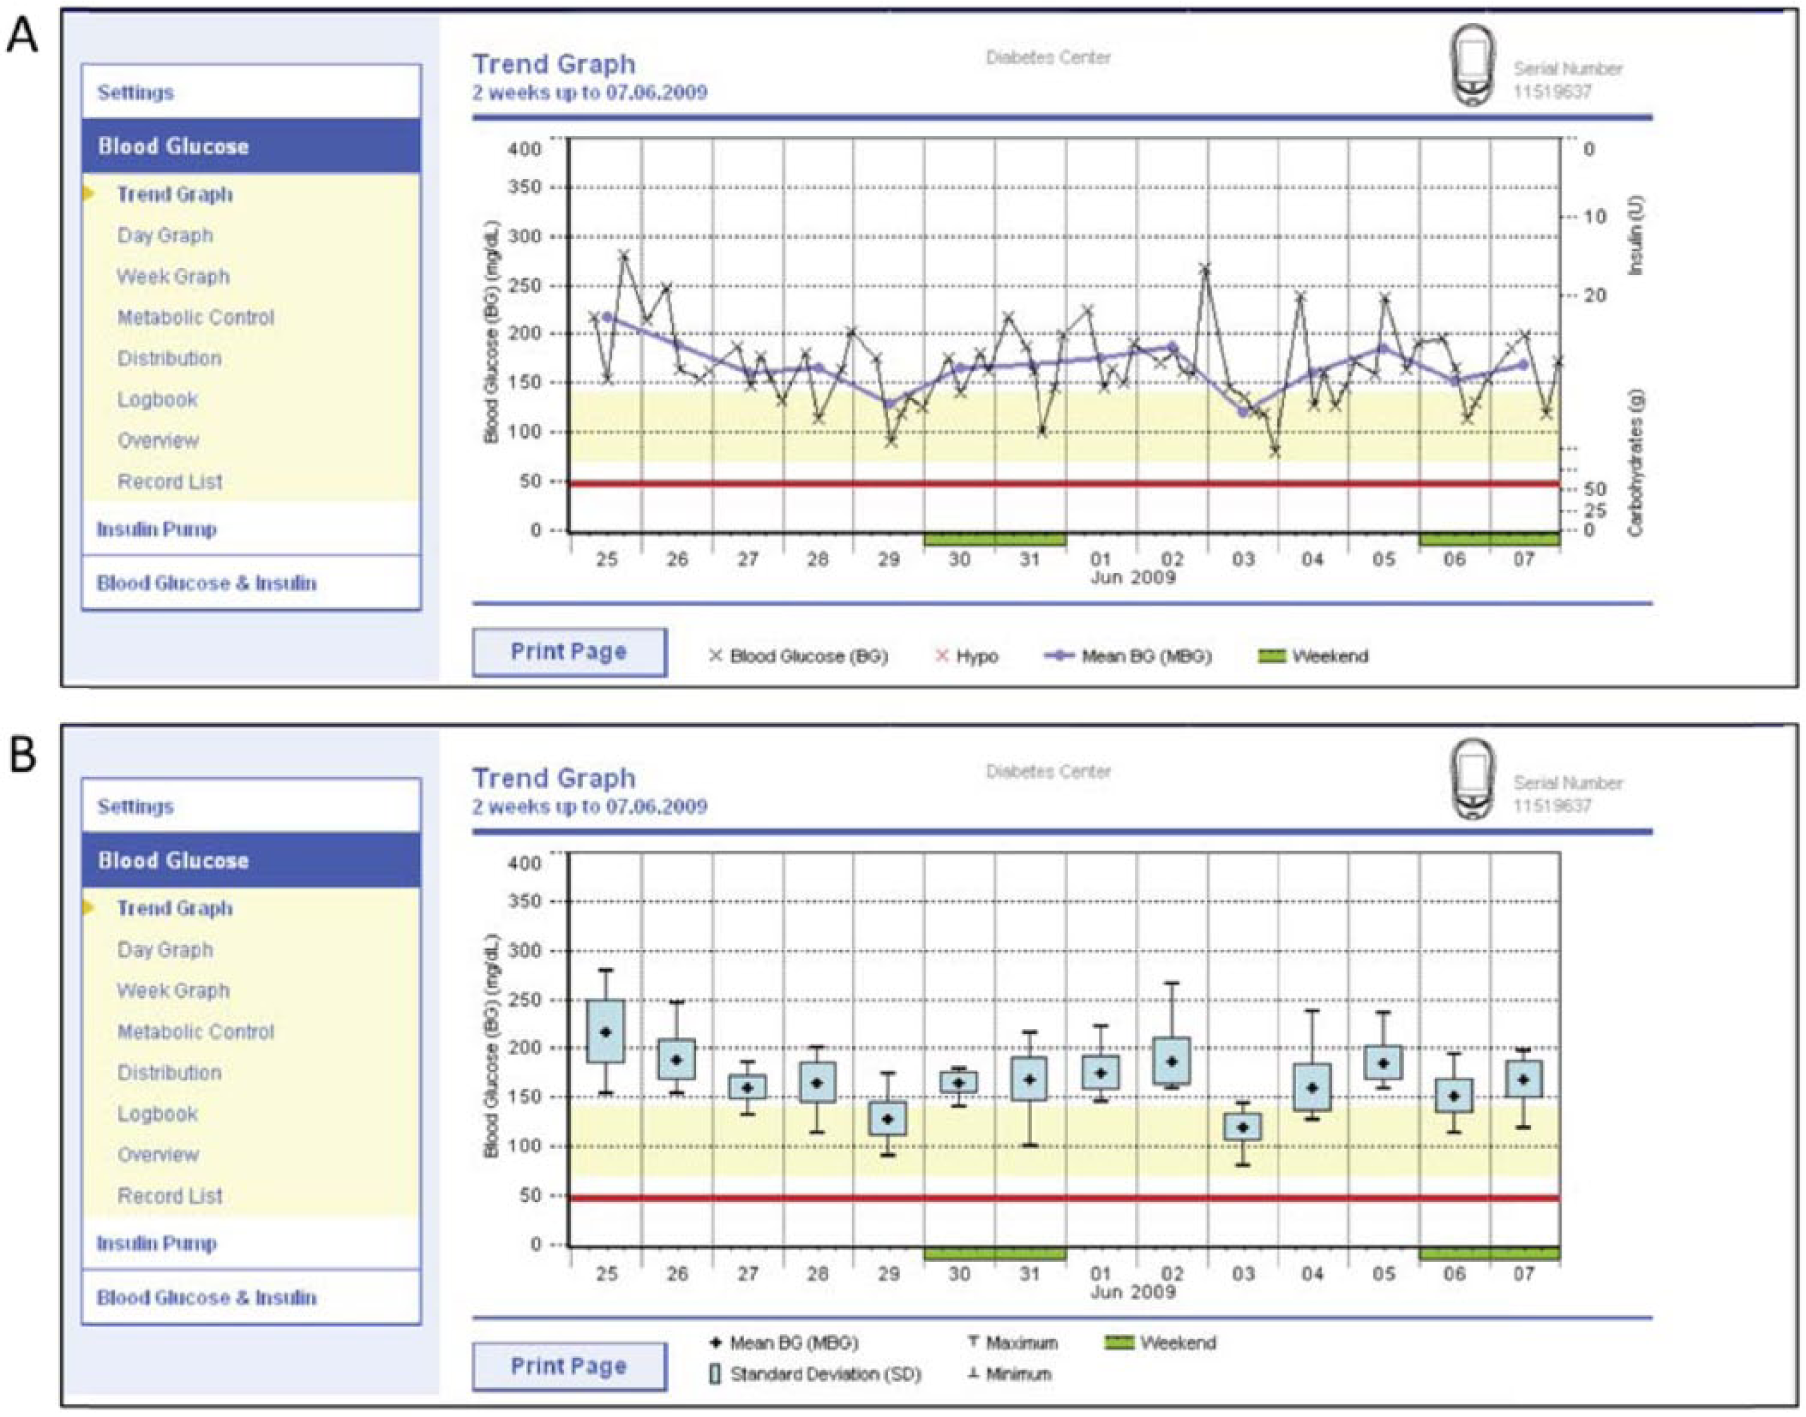
Example of IMS trend graph reports. The trend graphs identify and presents patterns of blood glucose levels for all days over a specified period of time (eg, total, weekly, daily). The detailed style (A) presents glucose data in a linear format with each test result plotted along a time axis according to the time when the test was performed. The trend style (B) presents test results within a certain period assigned to that time block; the figures displayed are the mean value, variance, and minimum/maximum of those test results.
Procedures
At baseline (visit 1), patient characteristics, diabetes history, current therapy, HbA1c value obtained within the previous 6 weeks, current SMBG regimen and number of patient-reported hypoglycemic events during the previous 4 weeks were documented. Physicians recommended individualized SMBG regimens to patients and instructed them to follow the new regimen until the month 1 visit (visit 2). Physicians completed the questionnaire at baseline for each patient assessing glycemic control and patient attitude concerning diabetes therapy.
At months 1 (visit 2) and 4 (visit 3), patient SMBG data were uploaded, analyzed and used to generate reports using the IMS tool. The reports were used for diabetes therapy review, decision making, and discussion with the patient. Physicians documented the reports used. Changes in the current SMBG regimen (eg, frequency and/or timing of testing) and any adjustments to diabetes therapy (eg, changes in insulin or OAD/GLP-1 therapy, lifestyle modification or implementation of diabetes training) and whether these changes were prompted by the reports were documented. The number of patient-reported hypoglycemic events occurring within the 4 weeks prior to the visit and patient attitudes toward their diabetes therapy were documented. Patients were asked to follow their recommended SMBG regimen until the next study visit (month 4). At month 4, physicians assessed the impact of integrating the IMS tool into usual diabetes care.
Measures
The primary endpoint for the study was change in HbA1c from baseline at months 4 and 7. HbA1c values were determined on-site or at local laboratories. Secondary measures included use of IMS reports; number and type of therapy adjustments; hypoglycemic events; and physician assessment of patient glycemic control, patient knowledge/attitudes concerning diabetes therapy and impact of IMS-supported diabetes management, and future use of the IMS tool.
Hypoglycemia was assessed from uploaded SMBG data as percentage of values <70 mg/dL during the 4 weeks prior to the month 1 and month 4 visits. Information regarding use of IMS reports, therapy adjustments and physician assessments were obtained and documented using a questionnaire developed by investigators. The questionnaire asked physicians to rate patient glycemic control (frequency/severity of glycemic variability, frequency/severity of hypoglycemia, intensity of Dawn phenomenon, severity of postprandial peaks); patient knowledge/attitudes/behaviors relevant to therapy (understanding of therapy concepts, self-management motivation, lifestyle, treatment satisfaction); and their own attitudes toward the IMS compared to their previous approach within 5 parameters: time required to make a decision regarding therapy, quality of the decision process, quality of communication with the patient, patient adherence with therapeutic recommendations, and the degree to which SMBG was structured. Assessment questions were scored on a 5-point scale (1 = very good, 5 = very poor).
Statistical Analysis
Descriptive and exploratory statistical methods were used for data analysis after stratification by diabetes type (type 1/type 2). Physician opinions regarding glycemic control and assessment of patient attitudes concerning diabetes therapy were categorized by 5-point Likert-type items with scales from 1 to 5 (1 = very good, 5 = very poor). The physician assessments of the impact of integrating the IMS tool into usual diabetes care versus baseline (ie, without IMS use) were categorized using a 5-point scale from −2 (worst change) to + 2 (best change). Mean and standard deviation (SD) were calculated for continuous and ordinal study variables; percentages were presented for categorical variables. The Wilcoxon signed rank test was used to detect significant changes from baseline to postbaseline visits. All statistical tests were performed 2-sided at a significance level of .05 without adjustment for multiple testing due to the exploratory nature of the study.
Results
Of the 965 patients enrolled into the study, 914 were eligible for analysis (48 from 8 centers in Denmark and 866 from 124 centers in Germany). Among the 51 patients who were excluded, the most frequent reason for exclusion was HbA1c <7.5% (58.5 mmol/mol) at baseline (n = 25), followed by diagnosis of diabetes established <1 year ago (n = 12), age <18 years (n = 5), and other cases where compliance with inclusion criteria were not properly documented. Baseline characteristics of the cohort are presented in Table 1.
Baseline Characteristics: All Eligible Patients.
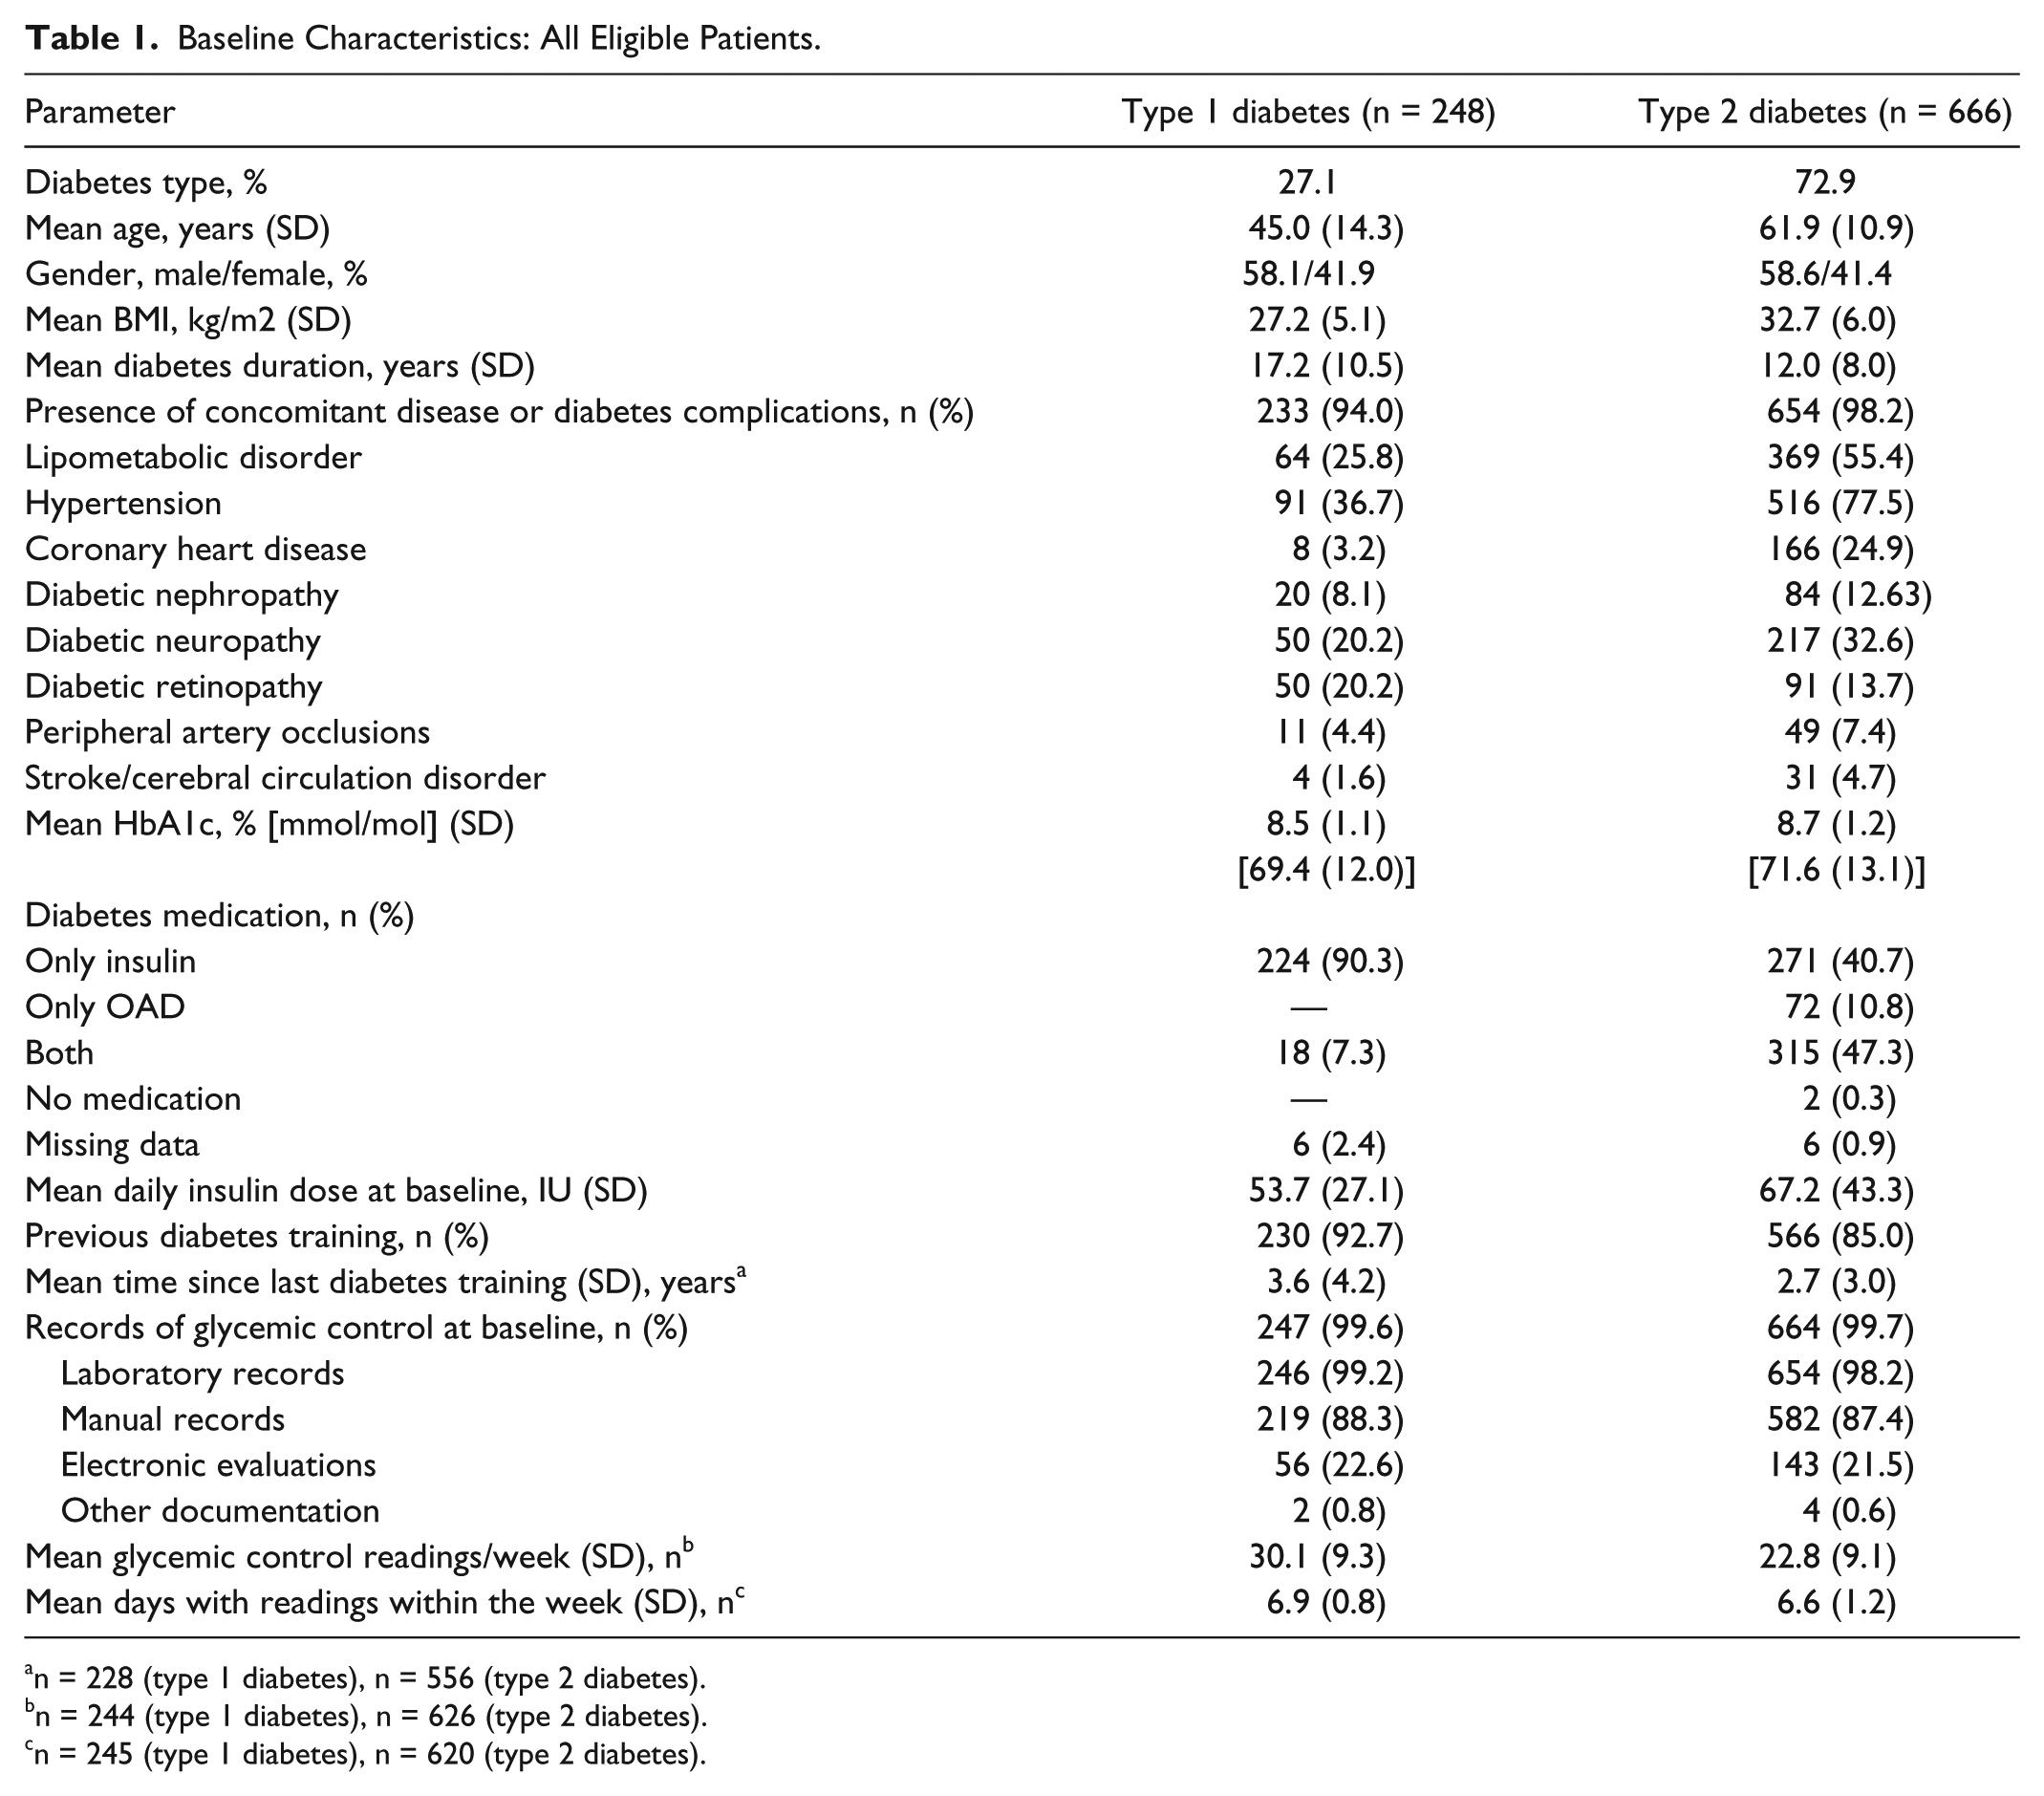
n = 228 (type 1 diabetes), n = 556 (type 2 diabetes).
n = 244 (type 1 diabetes), n = 626 (type 2 diabetes).
n = 245 (type 1 diabetes), n = 620 (type 2 diabetes).
Change in HbA1c
Significant reductions in HbA1c from baseline were seen among all eligible patients at month 4 and month 7, with greater reductions seen among type 2 diabetes patients compared to type 1 diabetes patients (Figure 2).
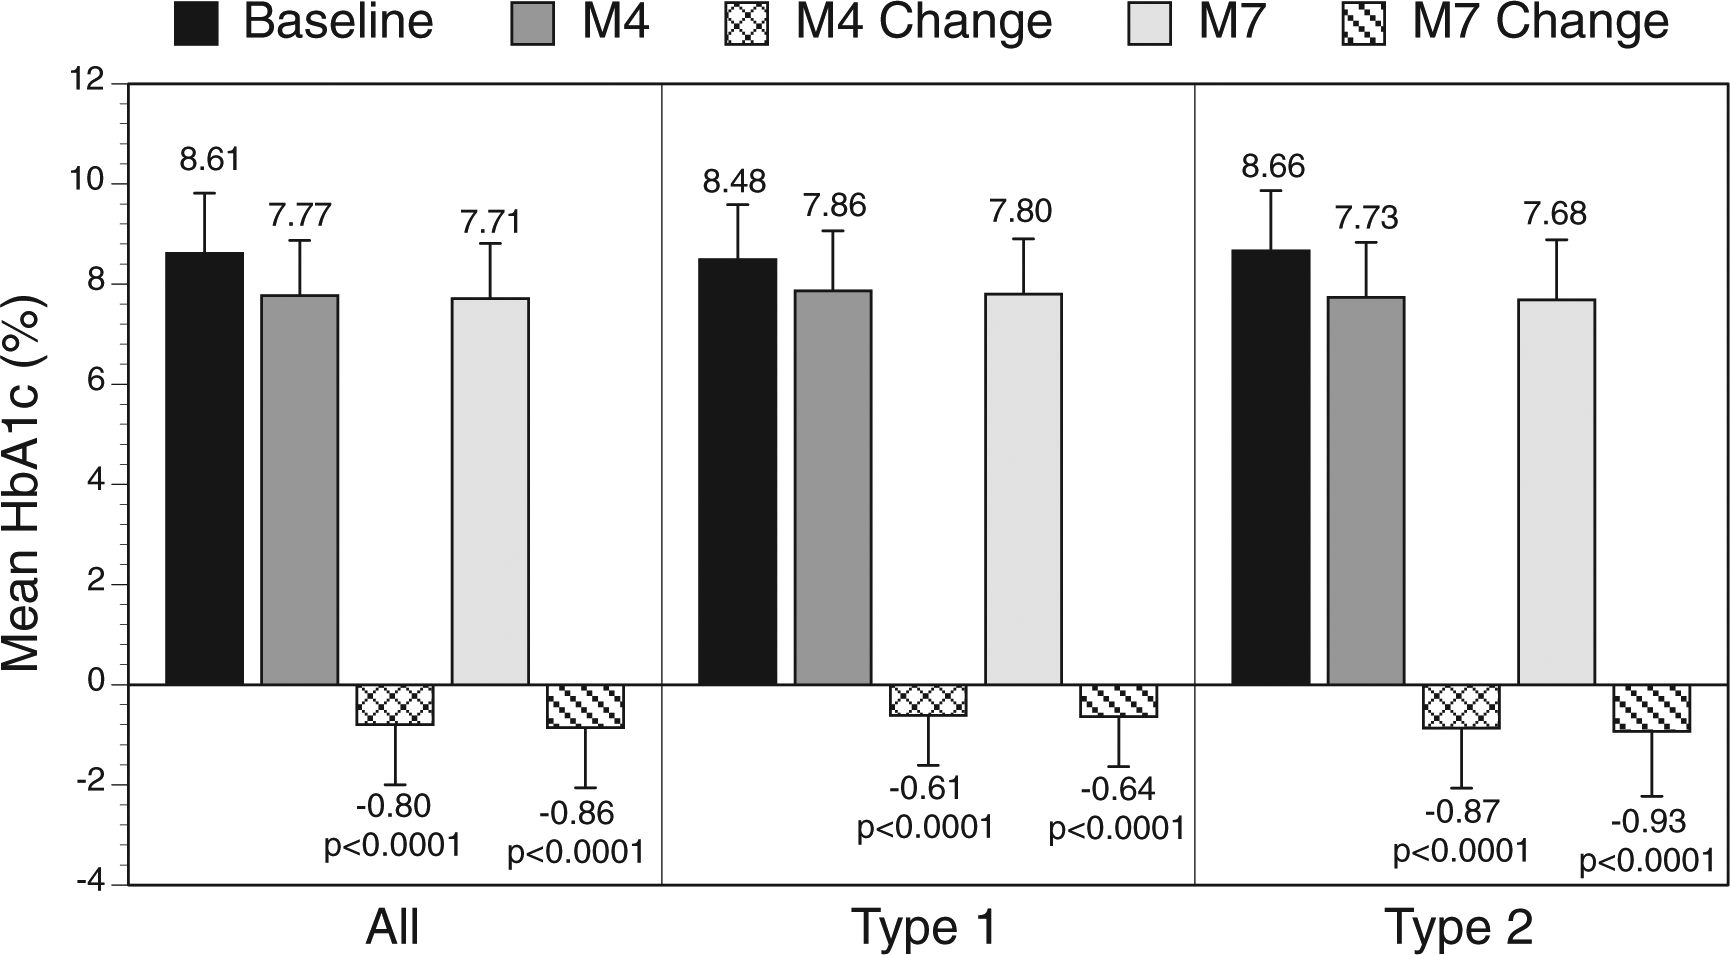
Change in mean HbA1c over time.
Therapy Adjustments
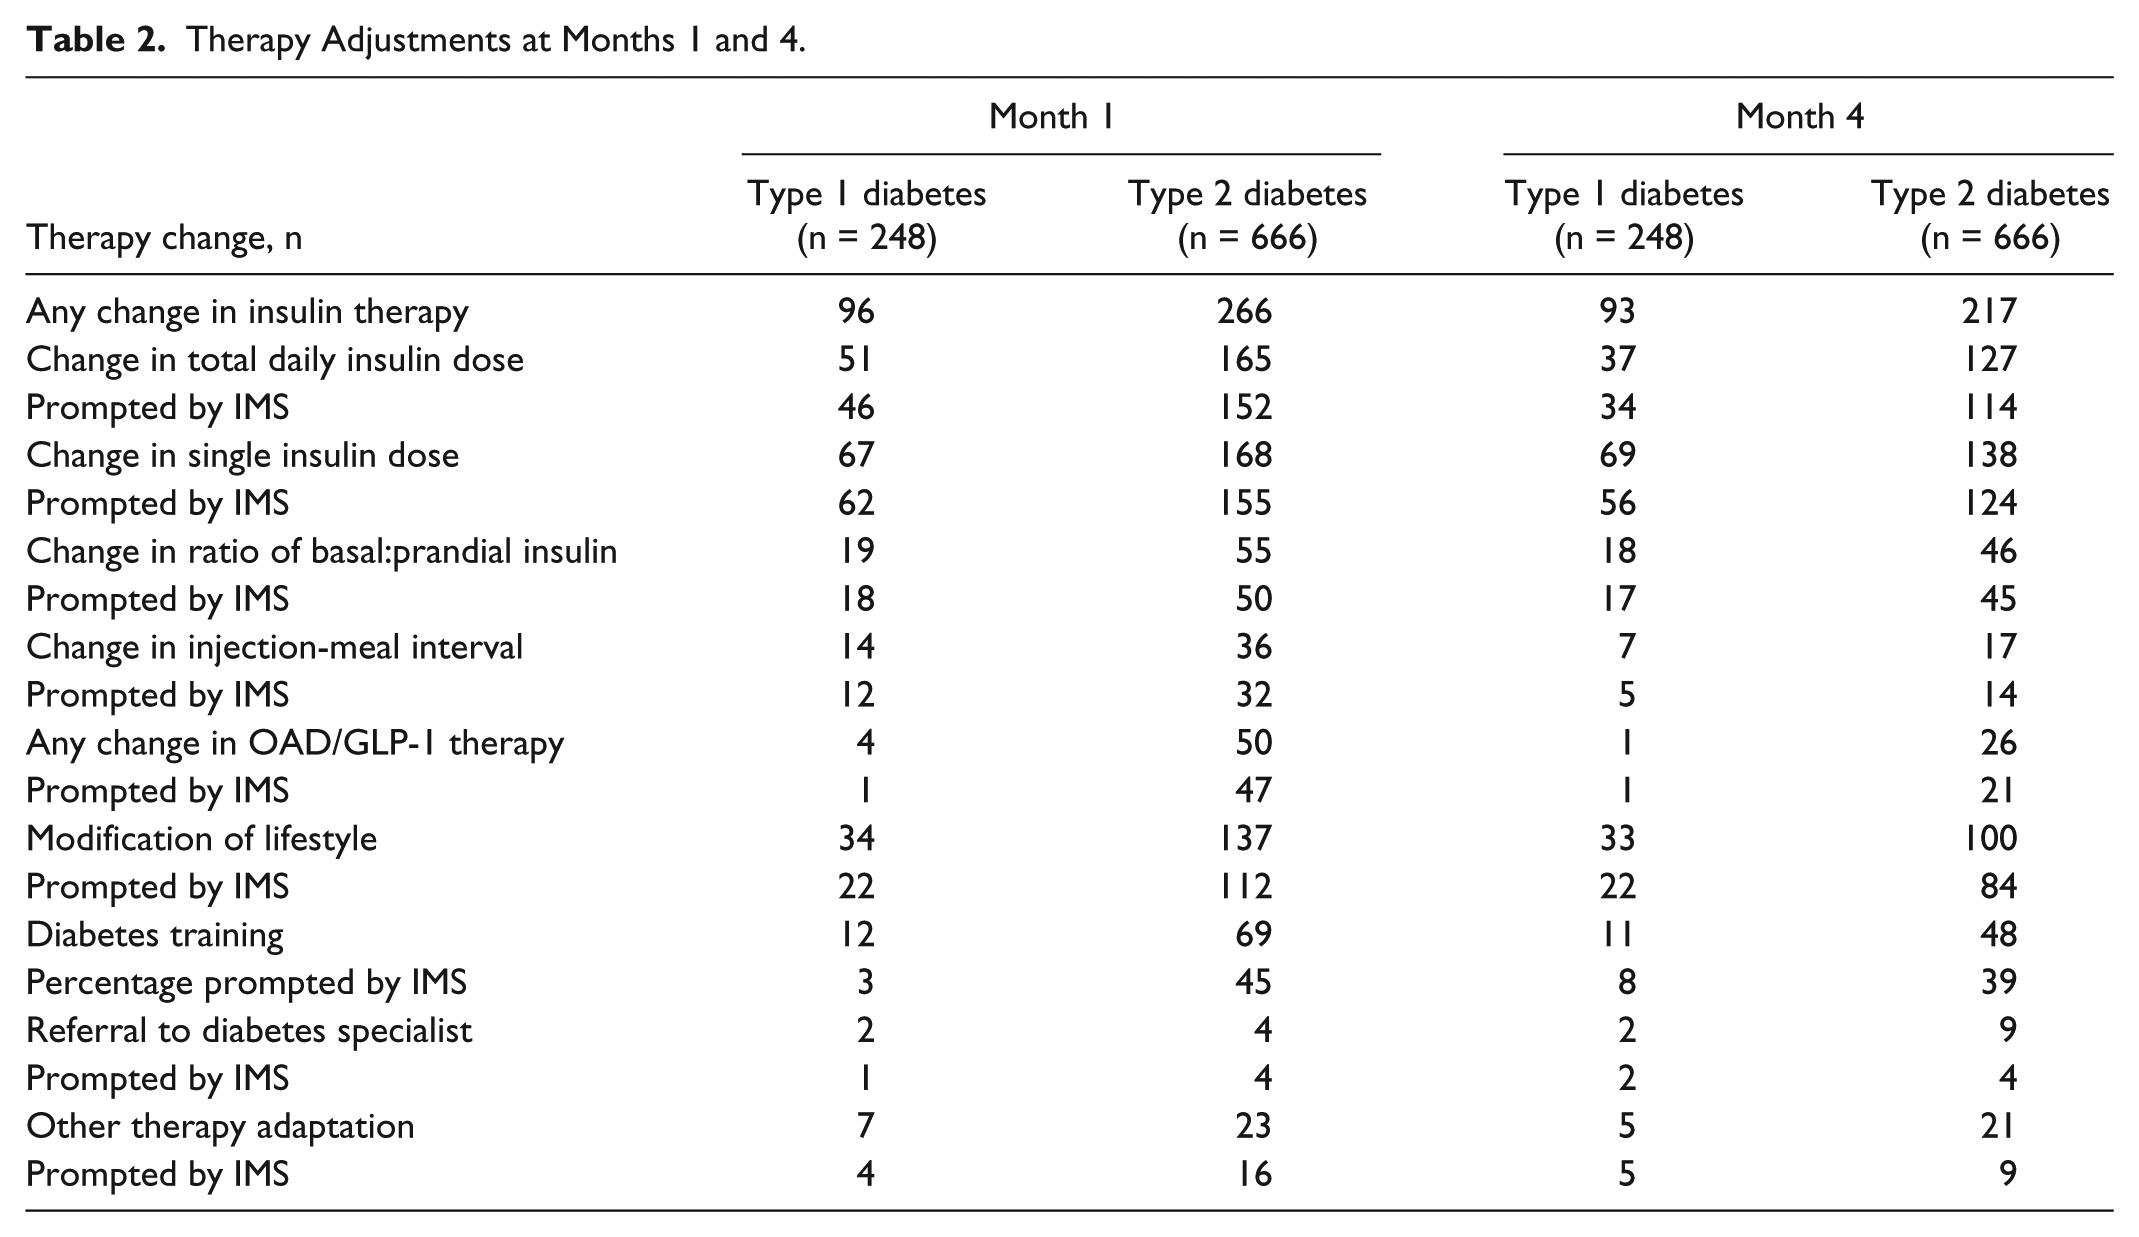
Approximately one-third of patients received changes in therapy at both month 1 and month 4 (Table 2).
Therapy Adjustments at Months 1 and 4.
Use of IMS Reports
IMS reports were used for therapy adjustment in 90% of patients at month 1 and in 86% of patients at month 4 (Table 2). Reports were discussed with 88% of patients at month 1 and 85% of patients at month 4. The reports most frequently used by physicians for therapy adjustments at month 1 and month 4 were trend graph (77% and 76% of patients, respectively), daily graph report (68% and 64%, respectively), diary (65% and 63%, respectively), and weekly graph report (54% and 52%).
Hypoglycemic Events
The average percentage of blood glucose values <70 mg/dL obtained 4 weeks prior to the month 2 and month 4 visits remained relatively unchanged in both type 1 and type 2 diabetes patients: 0.05%, P = .8012; 0.13%, P = .4570.
Physician Assessments
Patient Glycemic Control
Physicians reported improvements from baseline to month 4 in frequency/severity of glucose variability, frequency/severity of hypoglycemic events, susceptibility to elevated early morning blood glucose levels (Dawn phenomenon), and postprandial glucose excursions among type 2 diabetes patients (all P < .0001); however, no significant improvements were reported for type 1 diabetes patients (Figure 3).
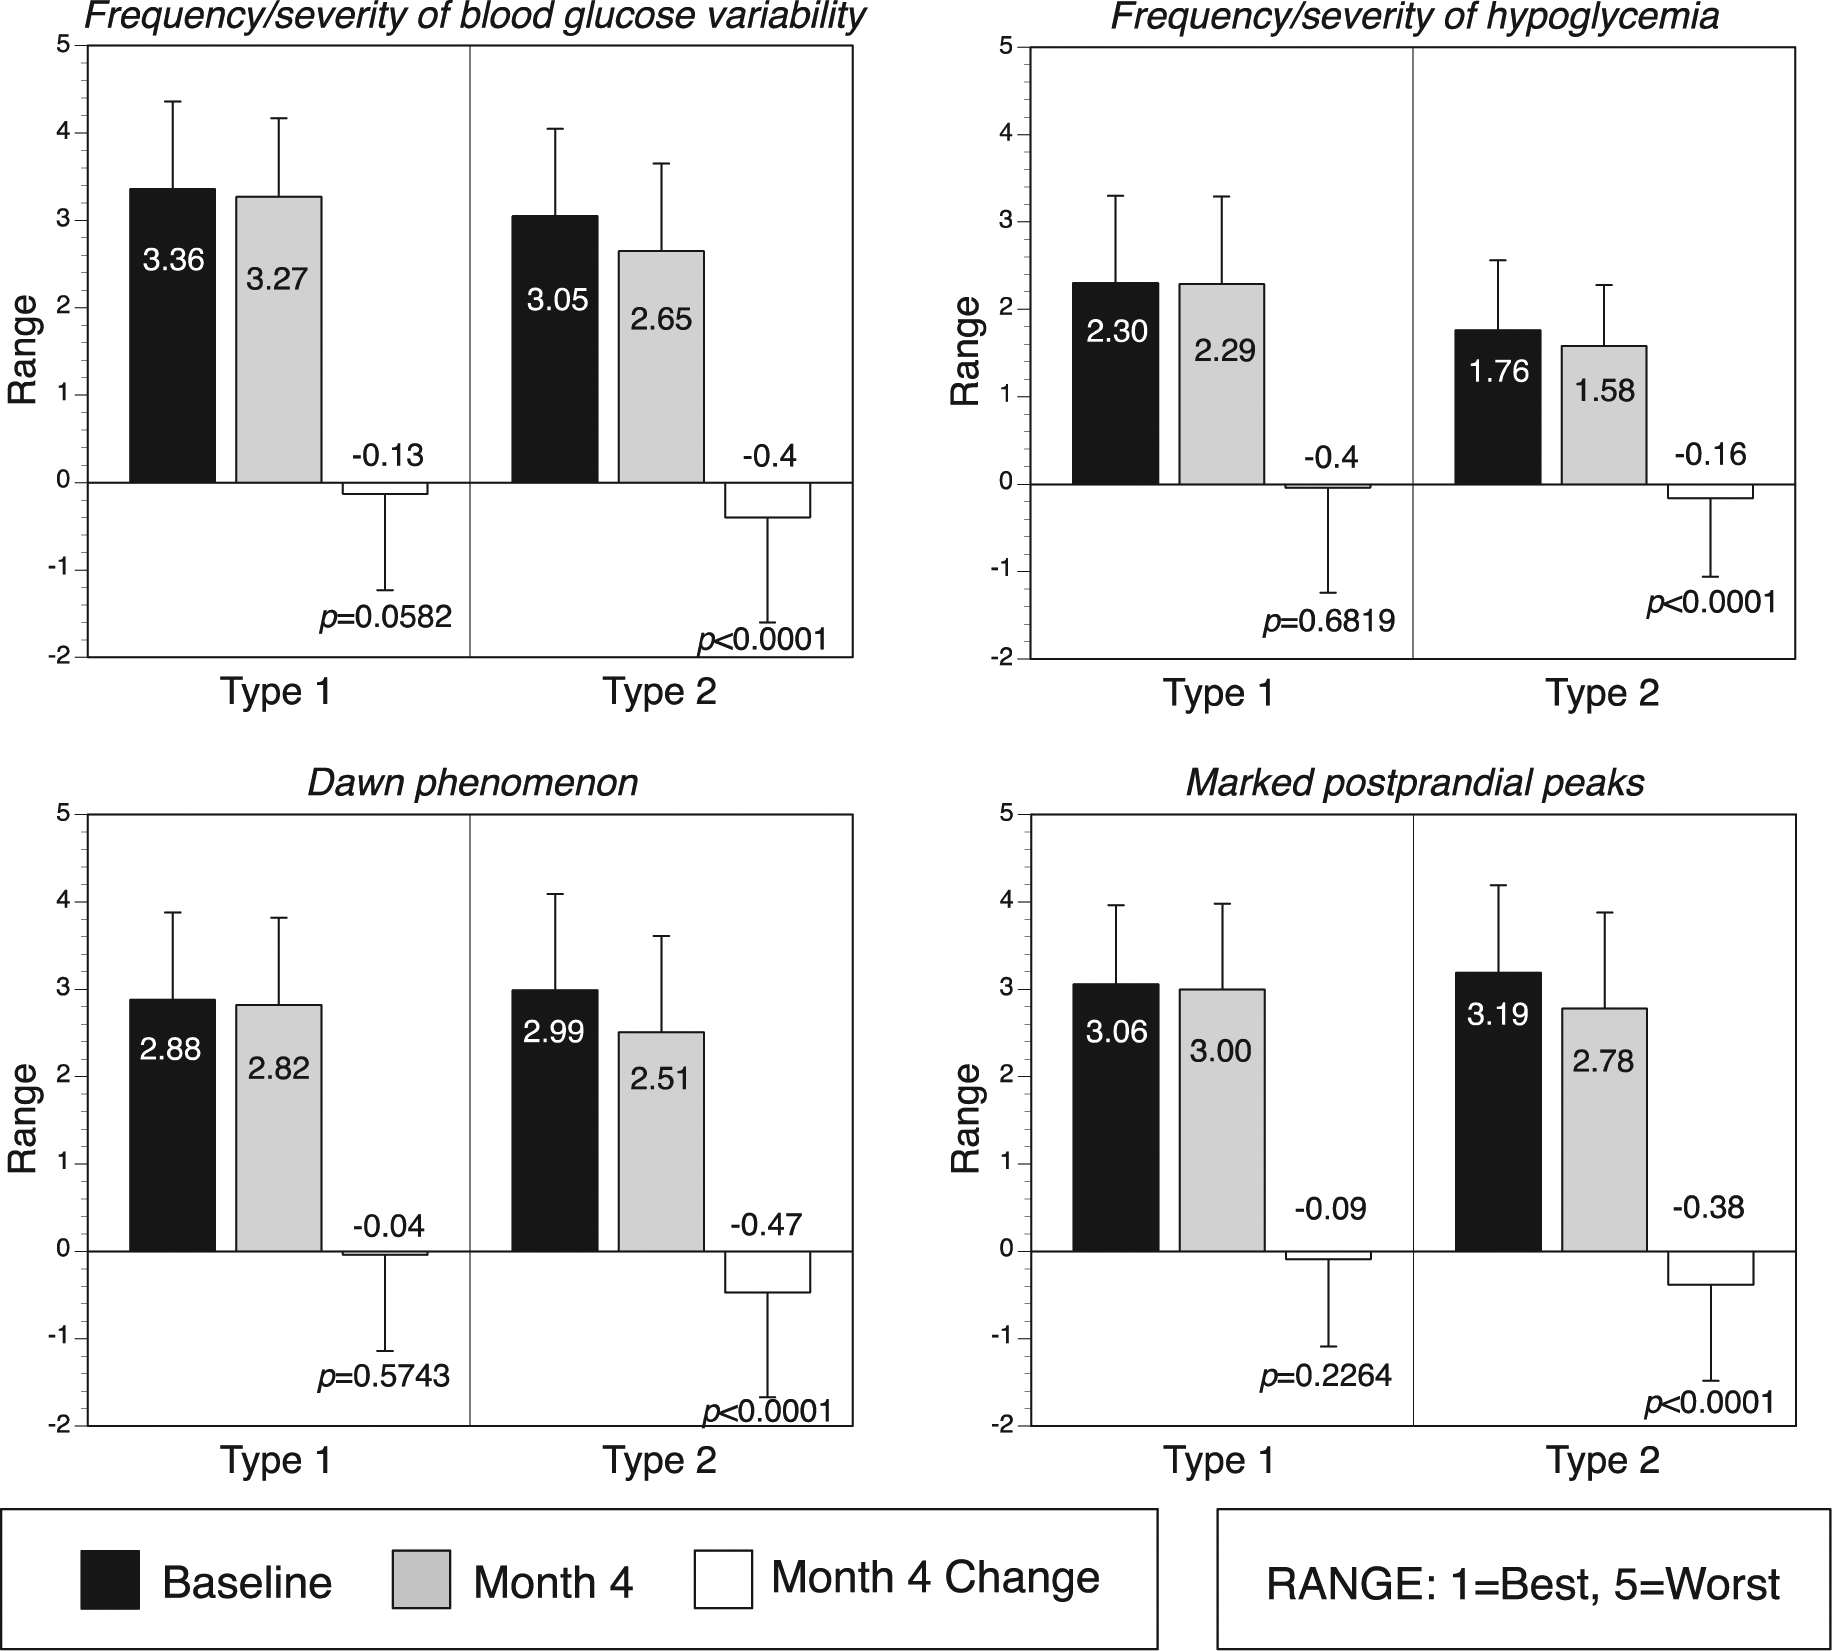
Physician opinion of glycemic control.
Patient Attitudes Concerning Diabetes Therapy
Physicians reported improvements from baseline to month 4 in mean scores for type 2 diabetes patients’ therapy comprehension (from 2.53 to 2.31, P < .0001), motivation (from 2.40 to 2.31, P < .05), lifestyle (physical activity and eating habits) (from 2.95 to 2.72, P < .0001), and satisfaction with diabetes therapy (from 2.90 to 2.52, P < .0001). Physician assessments of type 1 diabetes patient attitudes revealed no changes, with the exception patient satisfaction with diabetes therapy, which did show improvement (from 2.91 to 2.60, P < .0001).
Impact of IMS Supported DM and Future Use of the IMS Tool
Physicians reported that they required less time for therapy decision making in 61% of patients when using the IMS reports compared with their previous approach; however, 10% indicated that they required additional time. Physicians reported that quality of the decision making process was improved in 79% of patients, quality of patient discussions was improved in 76% of patients, self-management adherence was improved in 61% of patients, and SMBG become more structured in 64% of patients. Improvements were generally greater in patients with type 2 diabetes than type 1 diabetes, except for time required for therapy decision making, which was similar between the groups.
Among the 87% of physicians who responded, 79% reported willingness to continue using the IMS in the future. The majority of physicians reported that they were either satisfied or perfectly satisfied with the IMS in terms of using the device for data readings (96%), speed of report generation (99%), comprehensibleness and clarity of records (92%), simplicity of records (91%), and time needed in medical routine (67%).
Discussion
Our study showed that use of the Accu-Chek Smart Pix system was associated with clinically relevant improvements in glycemic control in both type 1 and type 2 diabetes patients. Although HbA1c reductions and improvements in other parameters of glycemic status were more pronounced in type 2 diabetes compared with type 1 diabetes, it is noteworthy that type 1 diabetes patients had lower HbA1c values at baseline than type 2 diabetes patients. In addition, a greater proportion of type 1 diabetes patients had already received training and used SMBG more intensely prior to the study, which may have limited the degree of glycemic improvement compared with the type 2 diabetes patients. Conversely, a higher proportion of type 2 diabetes patients were given diabetes training during the study, and their understanding of the disease and diabetes self-management improved to a greater extent (according to physician assessments), which likely contributed to improvements in glycemic control. Other factors that may have contributed to the greater improvements in type 2 diabetes patients included the greater degree of lifestyle adaptation compared with type 1 diabetes patients.
Use of the IMS tool was also associated with improvements in the frequency and/or severity of the Dawn phenomenon, marked postprandial glucose excursions and overall glycemic variability in patients with type 2 diabetes. Glycemic variability is a known marker of microvascular complications,14-18 and a growing body of evidence suggests that excessive postprandial glycemic excursions may be a significant risk factor for both microvascular 19 and macrovascular disease.20-24 It is noteworthy that improvements seen in glycemic control were achieved with no increase in hypoglycemia in type 1 diabetes patients and a slight reduction in type 2 diabetes patients. This is important given the negative impact of a fear of hypoglycemia on glycemic control, which has been observed in insulin-treated patients. 25
Physicians reported that most of the therapy adjustments were prompted the IMS reports, and that use of the reports reduced the time required to make therapeutic decisions and enhanced communications with patients, suggesting that use of an IMS tool can provide additional support to analyze, interpret and communicate complex SMBG data and patterns, supported by the indication that 4 out of 5 physicians would use an IMS in the future. These findings are similar to those seen in the STeP study, 3 which, in addition to significant HbA1c reductions, showed that use of structured SMBG via a paper data collection form (Accu-Chek 360º View tool, Roche Diagnostics, Indianapolis, IN, USA) resulted in more therapy changes, improved quality and efficiencies in patient-physician discussions in non-insulin-treated diabetes. In a 2-year follow-up survey, the majority of physicians who participated in the STeP study reported that they continue to use the tool with their patients, citing enhanced patient understanding and engagement, better discussions with patients regarding the impact of lifestyle behaviors, improved clinical outcomes and better practice efficiencies as significant benefits of the tool. 26 Our findings are encouraging because many clinicians are reluctant to utilize IMS technology due to concerns about the complexity of integrating an IMS into their practice flow and the perceived commitment of time involved in educating patients about its usefulness. 27
There were several strengths of the study. These included the strong statistical power due to the high number of study subjects as well as inclusion of both type 1 diabetes and type 2 diabetes patients in the cohort. In addition, because the study was carried out over a large number of primary care settings our results may have broad applicability to real-world clinical practice.
There are, however, important limitations of the study. Because there was no control group, it cannot be determined whether the effects are directly related to use of the IMS or simply a study effect, which can lead to improvements in metabolic control and other measures, as has been observed in previous diabetes studies.28,29 Although only 48 patients from Danish sites were included in the analysis, country differences in diabetes education and treatment may have impacted the generalizability of our findings. In addition, because the Smart Pix software does not capture data regarding frequency of bolusing, nor was bolus frequency queried in the PRO questionnaire, it is unknown whether use of the IMS resulted in increased frequency, which would have had a impacted HbA1c outcomes. 30 Finally, because the findings relating to physician assessments of patient health behaviors, motivation/adherence to therapy and quality of the therapy decision process were qualitative and derived from investigator-developed questionnaires, our results may not accurately reflect patients’ attitudes and behaviors. The same limitation applies to physicians’ self-reported assessment of changes in the time required to make therapy decisions when using the IMS. However, as discussed earlier, a recent study did show significant improvements in accuracy of SMBG data interpretation and reductions in time required when using IMS reports. 12 It is noteworthy that a large study program (PDM ProValue) is currently underway, which is partly based on the our findings, utilizes validated instruments (eg, Diabetes Treatment Satisfaction Questionnaire [DTSQ], 31 Problem Areas in Diabetes [PAID]) 32 to more fully explore PRO parameters.
Conclusions
Integration of the IMS technology, such as the Accu-Chek Smart Pix systems, appears to be feasible and beneficial in improving practice effectiveness and efficiencies in real-world clinical settings. Introduction of the IMS was associated with improvements in glycemic control, enhanced patient–physician communications, greater patient understanding, motivation and adherence to therapy, and reductions in the time required by physicians to make therapy decisions. Additional studies that evaluate the everyday benefit of IMS use concerning physician acceptance and effectiveness as to medical outcome and process quality will provide valuable insight into IMS-supported diabetes management.
Footnotes
Acknowledgements
The authors wish to thank all of the clinicians, clinic staff, and patients for their participation in the study.
Abbreviations
DTSQ, Diabetes Treatment Satisfaction Questionnaire; GLP-1, glucagon-like peptide-1; HbA1c, glycated hemoglobin; IMS, information management system; OAD, oral antidiabetic drug; PAID, Problem Areas in Diabetes; SMBG, self-monitoring of blood glucose.
Declaration of Conflicting Interests
The author(s) declared the following potential conflicts of interest with respect to the research, authorship, and/or publication of this article: DM and CGP received consulting fees from Roche Diagnostics GmbH. JW, AM, and IA are employees of Roche Diagnostics GmbH.
Funding
The author(s) disclosed receipt of the following financial support for the research, authorship, and/or publication of this article: The study was funded by Roche Diagnostics GmbH, Mannheim, Germany.