
Abstract
Background:
Insulin infusion set failure resulting in prolonged hyperglycemia or diabetic ketoacidosis can occur with pump therapy in type 1 diabetes. Set failures are frequently characterized by variable and unpredictable patterns of increasing glucose values despite increased insulin infusion. Early detection may minimize the risk of prolonged hyperglycemia, an important consideration for automated insulin delivery and closed-loop applications.
Methods:
A novel algorithm designed to alert the patient to the onset of infusion set failure was developed based upon continuous glucose sensor values and insulin delivered from an insulin pump. The method was calibrated on 12 weeks of infusion set wear without failures recorded by 4 patients in ambulatory conditions and prospectively validated on 18 weeks of infusion set wear with and without failures belonging to 9 other subjects in ambulatory conditions.
Results:
The algorithm, evaluated retrospectively, identified a failure 2.52 ± 1.91 days ahead of the actual event as recorded by the clinical team, corresponding to 50% sensitivity, 66% specificity and 55% accuracy. If set failure alarms had been activated in real time, the average time >180 mg/dl would be reduced from 82.7 ± 40.9 hours/week/subject (without alarm) to 58.8 ± 31.1 hours/week/subject (with alarm), corresponding to a potential 29% reduction in time spent >180mg/dl.
Conclusion:
The proposed method for early detection of infusion set failure based on glucose sensor and insulin data demonstrated favorable results on retrospective data and may be implemented as an additional safeguard in a future fully automated closed-loop system.
Infusion set failure resulting in prolonged hyperglycemia or diabetic ketoacidosis 1 can occur with pump therapy in type 1 diabetes. Set failures are frequently characterized by variable and unpredictable patterns of increasing glucose values despite increased insulin infusion. Early detection may minimize the risk of prolonged hyperglycemia, an important consideration for automated insulin delivery and closed-loop applications. 1
Despite the recommendation of the manufacturers (see, eg, Medtronic Diabetes 2 ), it is not an uncommon occurrence for an infusion set to be left in longer than 3 days, for both practical and economical reasons. Patients may only change the infusion set when they notice a persistent increase in their blood glucose level meaning that the set is not properly working.
Infusion set failure can occur when there is local inflammation at the infusion site, when the catheter is occluded, kinked or has simply dislodged from the subcutaneous space.3,4 In all these cases, metabolic decompensation and development of ketoacidosis can occur due to insufficient insulin delivery. 5 Clearly, infusion set failure prediction is a critical safety issue for a closed-loop insulin delivery system. Early detection of infusion set failures would also be useful for current open-loop systems.
We propose a new strategy to recognize the development of an infusion set failure in advance and activate an alarm warning the patient to check and replace the infusion set. This approach is unique in that we do not explicitly use a model of the patient glucose regulatory system to make predictions of future blood glucose concentration trajectories. We also do not use inputs from the subjects such as meal announcement. Thirdly, we do not aim at detecting the fault, rather we anticipate it. Last, this method was developed and validated using outpatient clinical data as opposed to in silico methods.
Methods
Experimental Conditions
Twenty-three subjects with type 1 diabetes recruited at 2 clinical sites wore a teflon infusion set6,7 in ambulatory conditions for 7 days or until there was an infusion set failure as defined in Table 1. Study participants returned to the investigators weekly over 3 weeks for a clinical examination. At each visit the infusion sites were inspected and new infusion sites were initiated.
Definition of an Infusion Set Failure.
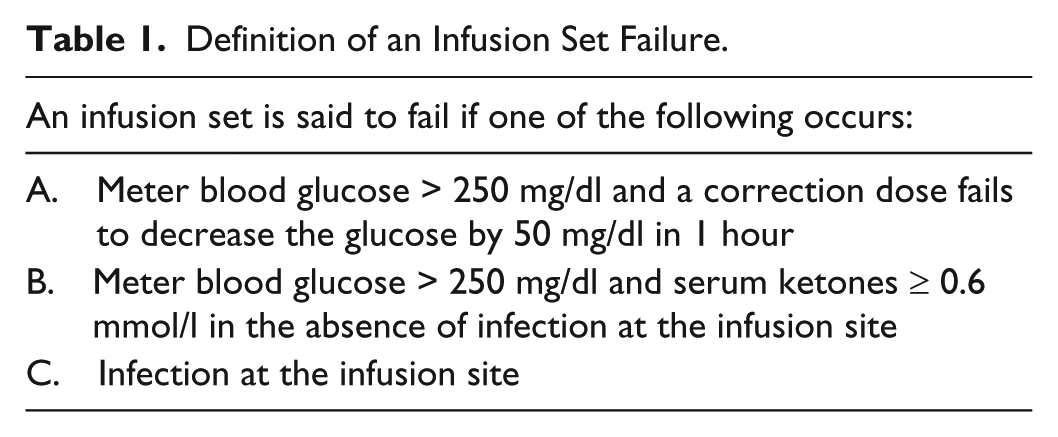
All subjects used Silhouette 6 or Comfort 7 teflon infusion sets. For the duration of the study the subjects monitored their blood glucose with the Dexcom G4 Platinum sensor 8 that was worn for 2 weeks or until there was a sensor failure on the screen and the sensor shut down or there was pain, itching, or redness at the site suggesting an infection. In that case the sensor was replaced. Subjects were instructed to never make an insulin dose decision or treat hypoglycemia based on a sensor glucose value, but instead to do a meter blood glucose test with a Bayer Next home 9 device and use this value to make their treatment decisions. Patients were asked to record when the infusion sets were removed and document the reason for set removal. The study ended with the clinical examination of the subject at day 21. If a failure had occurred before day 7, subjects were instructed to replace the infusion set at home to ensure insulin delivery until the new set provided by the investigators was inserted at day 7.
Clinical data acquisition provided us with 69 patient-weeks of data. However, 39 weeks were not suitable for our analysis because either the CGM data were not available at all at the time of the failure or in the 24 hours prior to the failure or because the CGM measurements were too scarce over the whole week. Developing the method required an uninterrupted stream of subcutaneous glucose assessments from the sensor, hence only 30 weeks from 15 subjects were selected and explored for our purposes. A first subset of 12 weeks without set failures from 4 patients were used to calibrate the algorithm and a second subset of an additional 18 weeks (13 with verified set failures and 5 without) from 9 patients were used for validation.
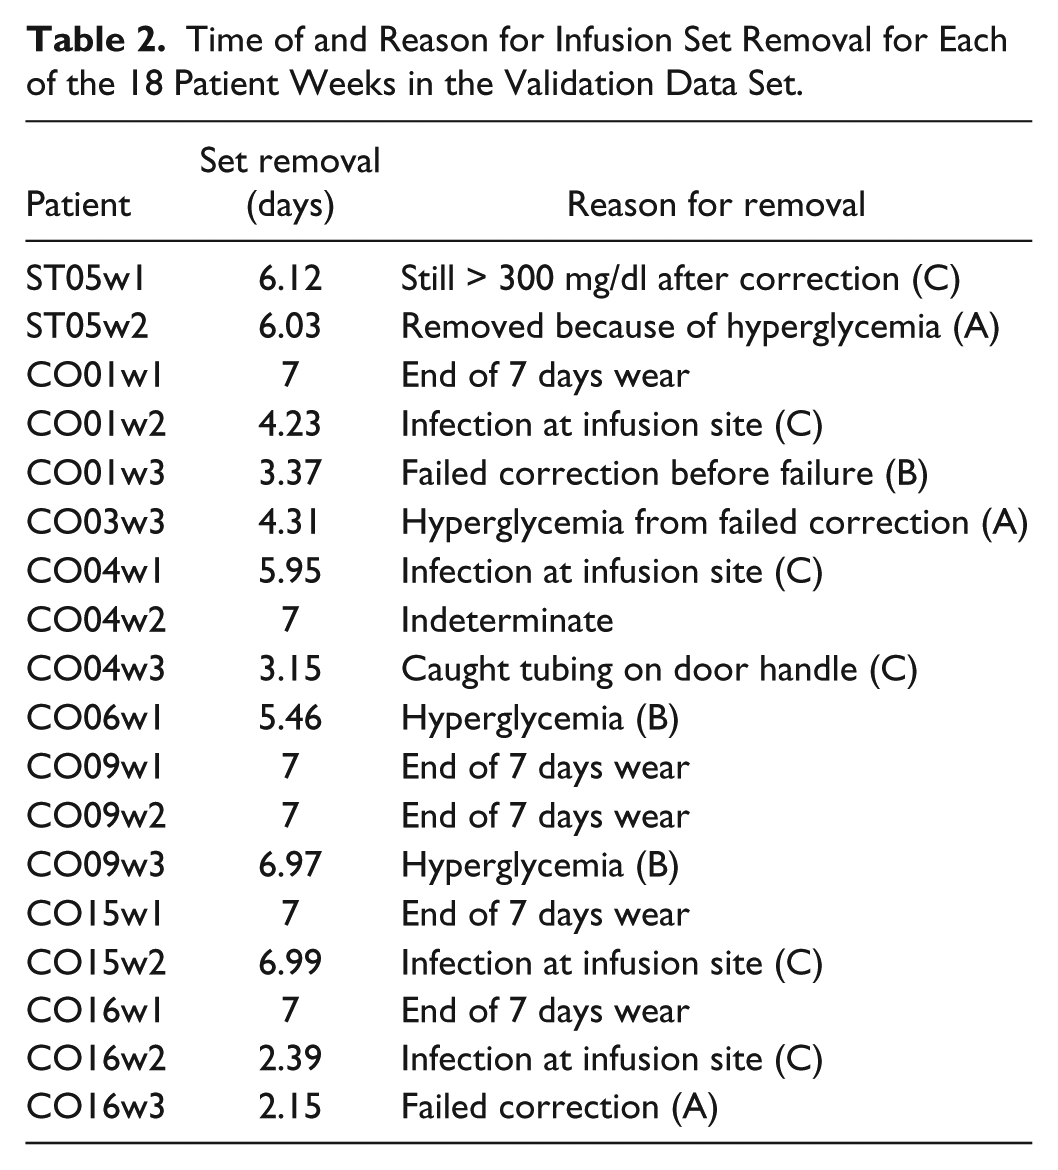
With regard to the second subset, overall, 17% of the sets failed due to a failed correction dose, 17% failed because of the presence of serum ketones ≥0.6 mmol/l with hyperglycemia, 28% had erythema or induration > 1 cm in diameter at the infusion site, 5% were removed because of bleeding and 5% were pulled out by accident. The main predictor of length of wear was the individual subject. Table 2 shows the time of failure occurrence and the reasons of the failures for all the patients in the second subset.
Time of and Reason for Infusion Set Removal for Each of the 18 Patient Weeks in the Validation Data Set.
Early Detection and Alarm Generation Method
In case of a developing failure, the patient glucose-insulin dynamics is slowly changing, presenting variable patterns of increasing glucose levels. At the same time, more insulin is being infused by the patients outside of their ordinary therapy because insulin is not as effective in lowering blood glucose (see Figure 1 for a representative subject). Based on these facts and bearing in mind that the failures need to be anticipated and not simply detected, we set the problem in a performance-monitoring framework. The rationale behind our strategy is, therefore, to be able to capture the degradation of control performances (ie, higher glucose concentration is registered over time despite the larger doses of insulin being infused) due to an infusion set fault.
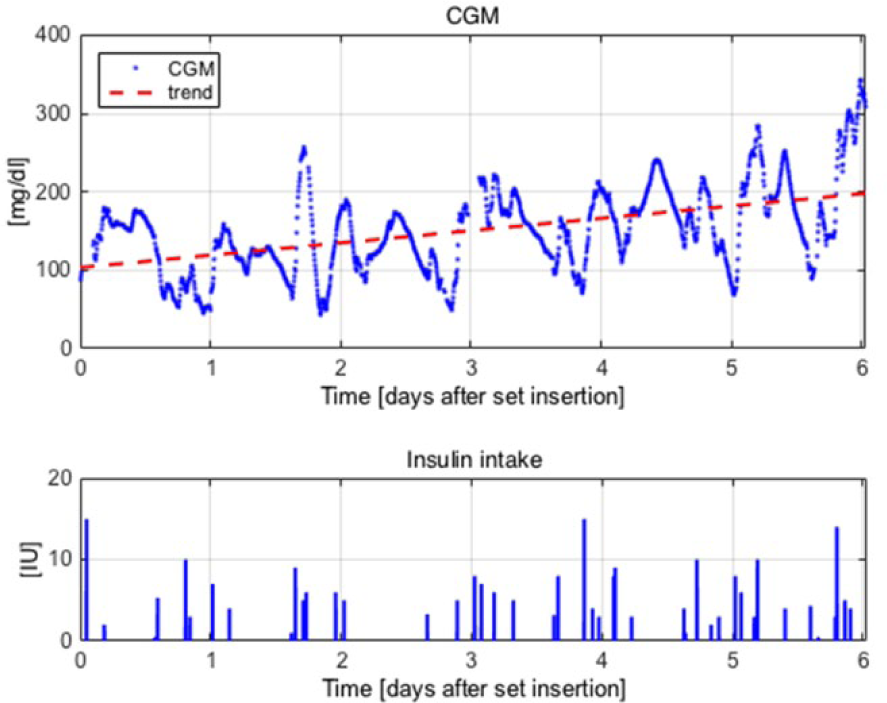
ST05w1 patient data from infusion set insertion to infusion set removal due to failure after 6.12 days. Top: CGM time series (blue) and linear trend (red dashed) (mg/dl) versus time (days after insertion). Bottom: insulin intake (IU) versus time (days after insertion).
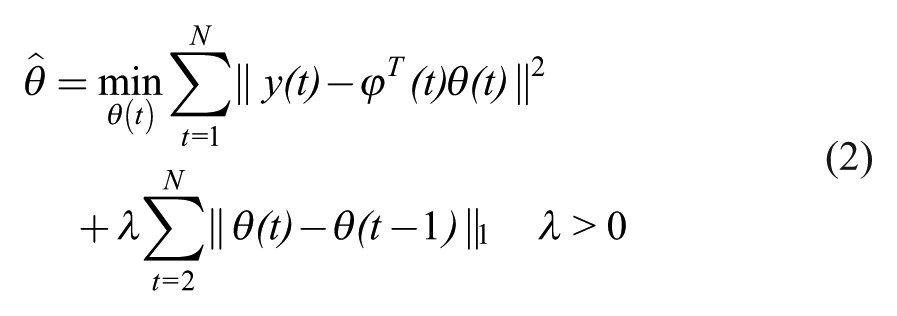
The CGM data sequences can be split in segments corresponding to different modes of operations. A mode could be, for instance, the dynamical system describing variations of blood glucose concentration resulting from the morning carbohydrate intake, reproducible over the days. When a new mode is found, the linear trend of the CGM series is calculated. If the linear trend is consistently upward, it means that the patient has not been able to control glycemia around the target zone, either because the insulin injected was too little or because the insulin is not working as it should. The quantity of insulin infused is checked and when this is larger than a certain threshold an alert is given. The flowchart in Figure 2 illustrates the strategy. This strategy is not suitable for abrupt failures, such as those failures resulting when the tubing is caught on door handle or suddenly ripped off which are unpredictable and can happen at any time.
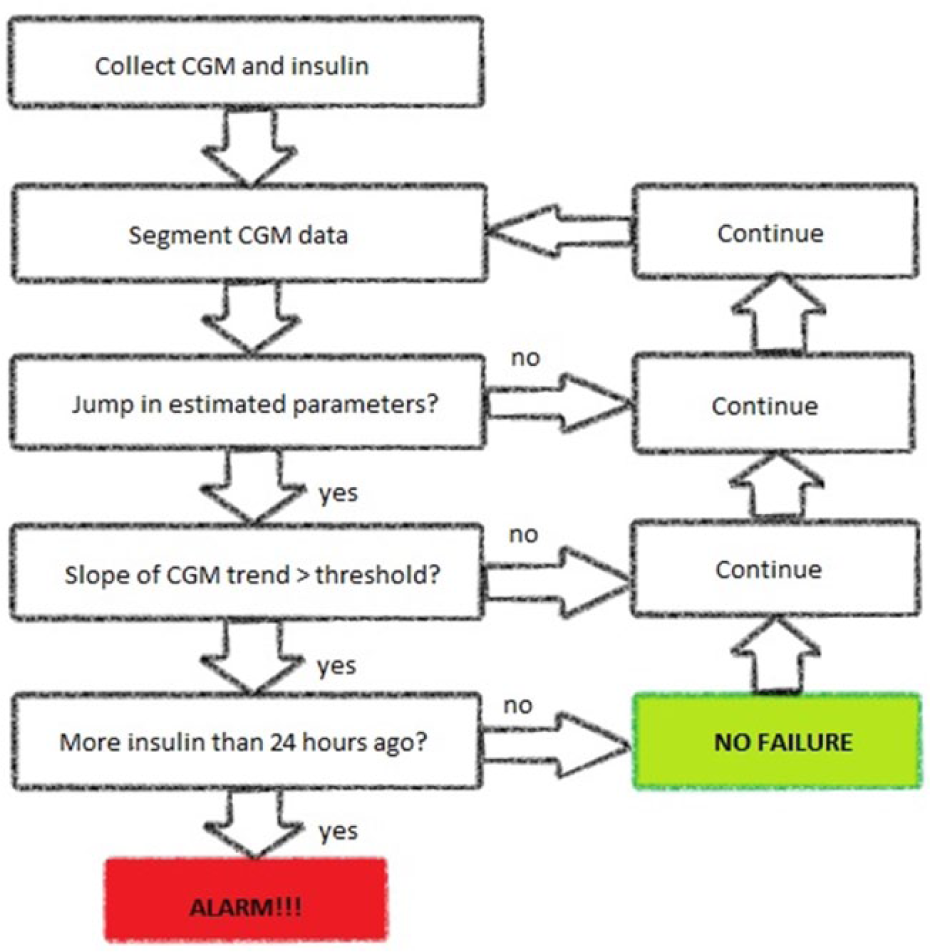
Flowchart of the proposed method.
Our method is comprised of 3 core components: the data segmentation, the CGM linear trend calculation, and the insulin counting.
Data Segmentation
As previously mentioned, the CGM data were divided into segments representative of a certain insulin-to-blood glucose system dynamics. The changes in such dynamics due to shortage of circulating insulin as a result of infusion set failure are relatively slow and as such we described the sensor time series with a time-varying autoregressive (AR) model 10 whose parameters were piecewise constant in time, changing only rarely:
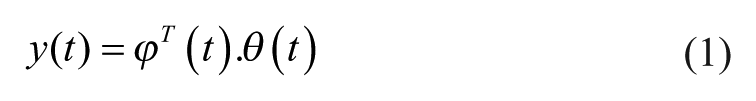
where
with
Linear Trend Assessment
Retrospective analysis of the collected data highlighted a persistent ramp-like increase in glycemia levels for those weeks presenting an infusion set failure, as opposed to no increase for weeks fault-free (see Figure 1). Our idea was, then, to consider the linear trend in the CGM time series (red dashed line in Figure 1), more specifically its slope, and exploit it to our purposes. A positive slope or, more precisely, a slope crossing a certain user-defined threshold, would lead to persistently increasing glycemia levels and hence to a possible failure.
Insulin Intake Calculation
Failures of the infusion set cause the insulin taken not to be effectively delivered through the subcutaneous tissue into the blood stream, resulting in rising glucose concentrations (see Figure 1). As a consequence, the patient’s reaction is to give additional insulin dose to correct the hyperglycemia. In the case of a failure, these corrections do not compensate for the hyperglycemia as it would be expected. The result is an overall increment in correction doses and ultimately in the quantity of insulin infused (see Figure 1, bottom plot). Using this as a basis, we have developed an algorithm which compares the number of bolus insulin applications and the total insulin infused in a user-specified time interval with the same interval 24 hours earlier. We would like to highlight that both the number of insulin boluses and the quantity of infused insulin need to be taken into account, under the assumption that neither the time of the meal nor the meal content are available. One single larger insulin injection may indicate the subject had a bigger meal, while several closely-spaced small injections with total insulin the same as the larger dose are more likely to indicate that a failure is developing.
The 3-step procedure ensures an increased degree of robustness to the method. The data segmentation captures variations in dynamic behavior of blood glucose levels which are due to multiple causes, not only set faults. A new segment is found, for instance, when subjects eat a bigger meal than usual without compensating for it with the expected insulin, forget to bolus or conversely they overestimate the insulin needed and may enter the hypoglycemic region. In order to distinguish this latter type of segments from those representing a potential failure, the assessment of the trend was introduced. A positive slope of the glucose trend indicate potential hyperglycemia if the same trend continues. Last, the calculation of the insulin intake was finally added to rule out all those sections exhibiting an increase in glycemia which is not due to loss of insulin effectiveness.
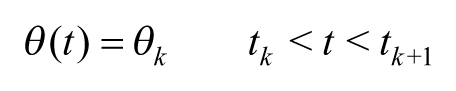
The Final Failure Alert Algorithm
The final failure alert algorithm as depicted in Figure 2 is given as follows:
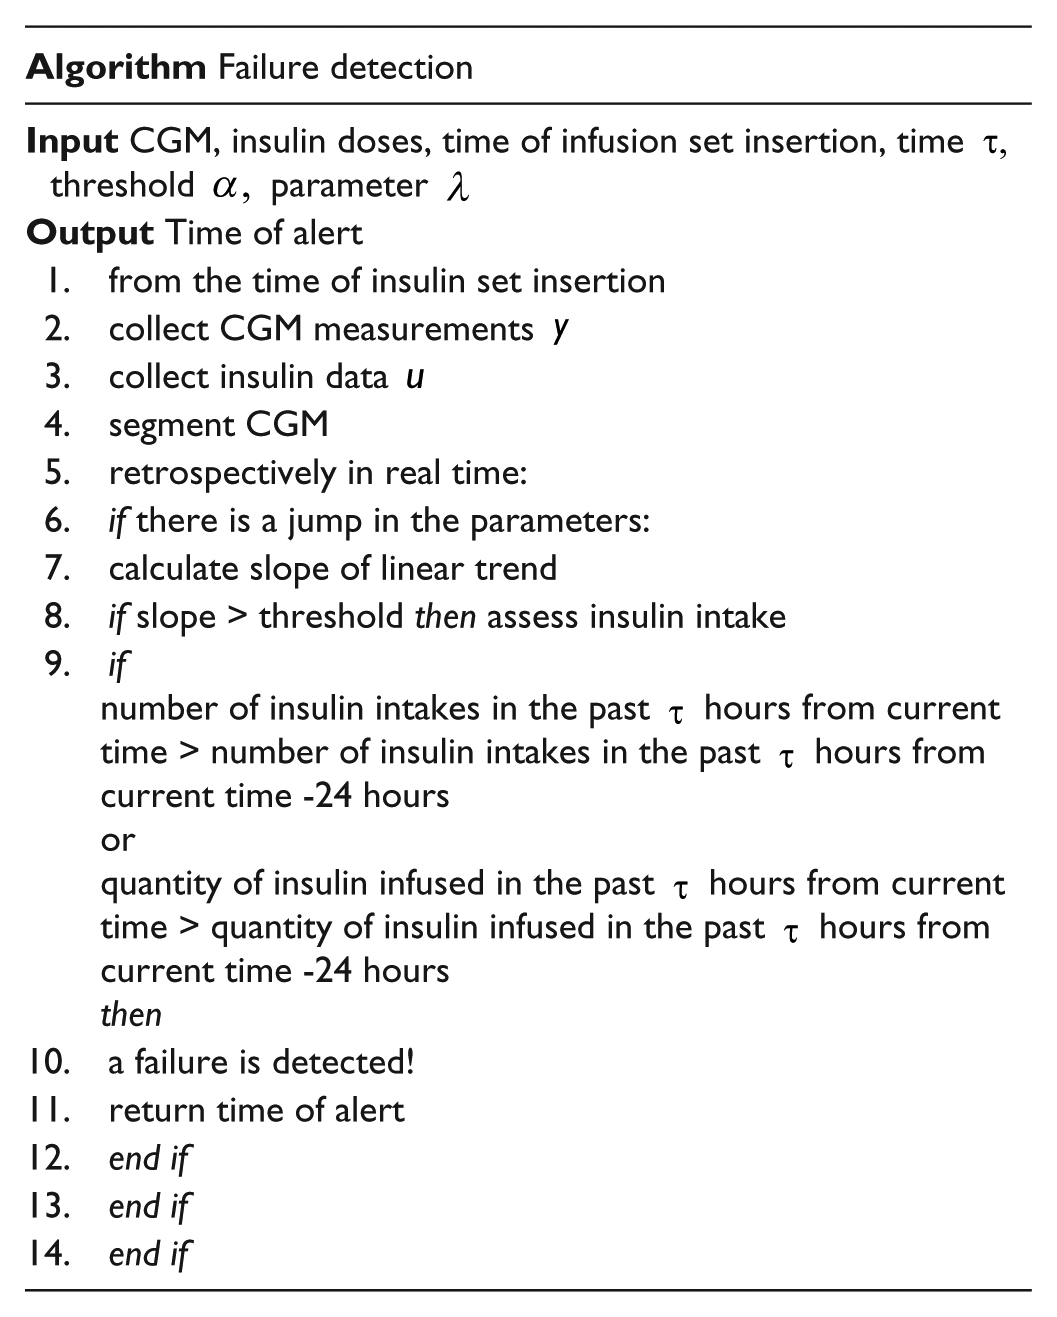
where the values of the user input parameters were:
Performance Evaluation
The proposed algorithm was evaluated on 18 weeks of data from 9 patients in a retrospective and blind to the failures manner. Each time a new set was initiated by the clinical investigators upon a patient study visit, the algorithm was initialized and let run until either a failure alert was generated or the 7 days wear were completed as per protocol. Information regarding the CGM sensor insertion and/or replacement were not considered at this stage.
We computed sensitivity, representing the fraction of failures correctly predicted, specificity, representing the fraction of non-failures correctly recognized, and accuracy.
In addition, we compared the time spent in hyperglycemia, that is, above 180 mg/dl, if the failure alert algorithm would have been applied in real time, to that recorded by the clinical team.
Results
The algorithm achieved 50% sensitivity, 66% specificity and 55% accuracy, with 6 TP, 2 FP, 6 FN, 4 TN. Figure 3 shows boxplots of average time above 180 (mg/dl) across the population, where the median (red) and the 25th and 75th percentiles (edges of boxes) are displayed.
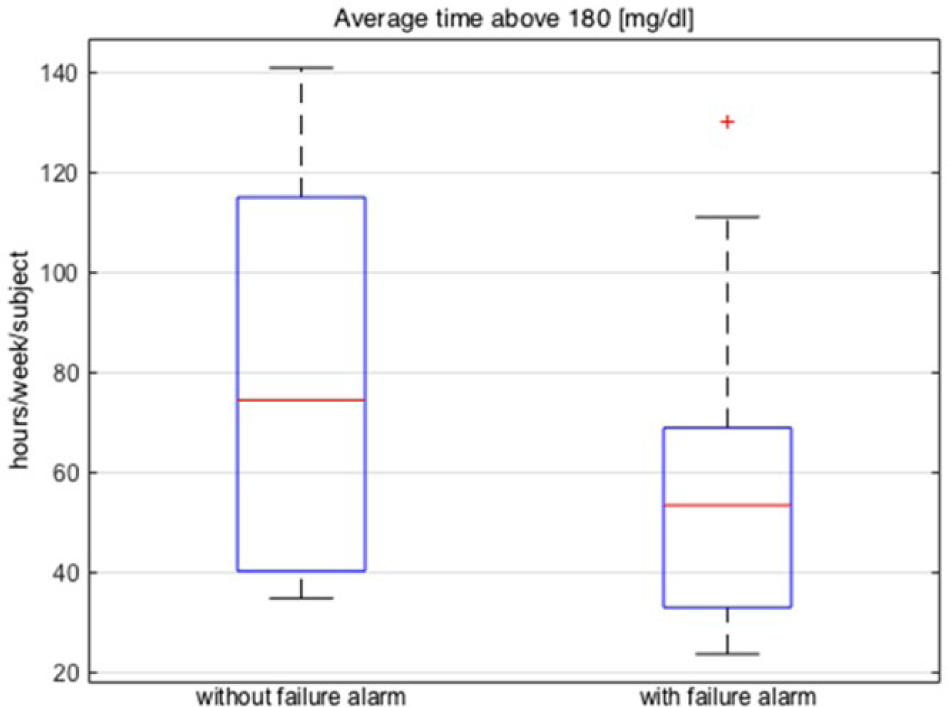
Boxplots of average time (hours/week/subject) above 180 (mg/dl). Left: without failure alarm activated; right: with failure alarm activated in real time.
Figure 4 shows the time of set removal recorded by the clinical team compared to the time of alert if the proposed algorithm would have been implemented in real time, for the validation data. The failures were identified 2.52 ± 1.91 days ahead of the actual event. In Figure 4 gray bars indicate the time of potential set removal if the algorithm would have been activated in real time and the patients would have reacted to it and replaced the infusion set, while black bars denote time of set failure recorded by the clinical team. If a gray bar extends beyond a black bar, the alert was given after the time of actual set removal by the subjects. These events were classified as missed failures. If a gray bar stops prior to the end of a black bar, the alarm occurred before clinical set failure. If there is no gray bar, no alarm was given.
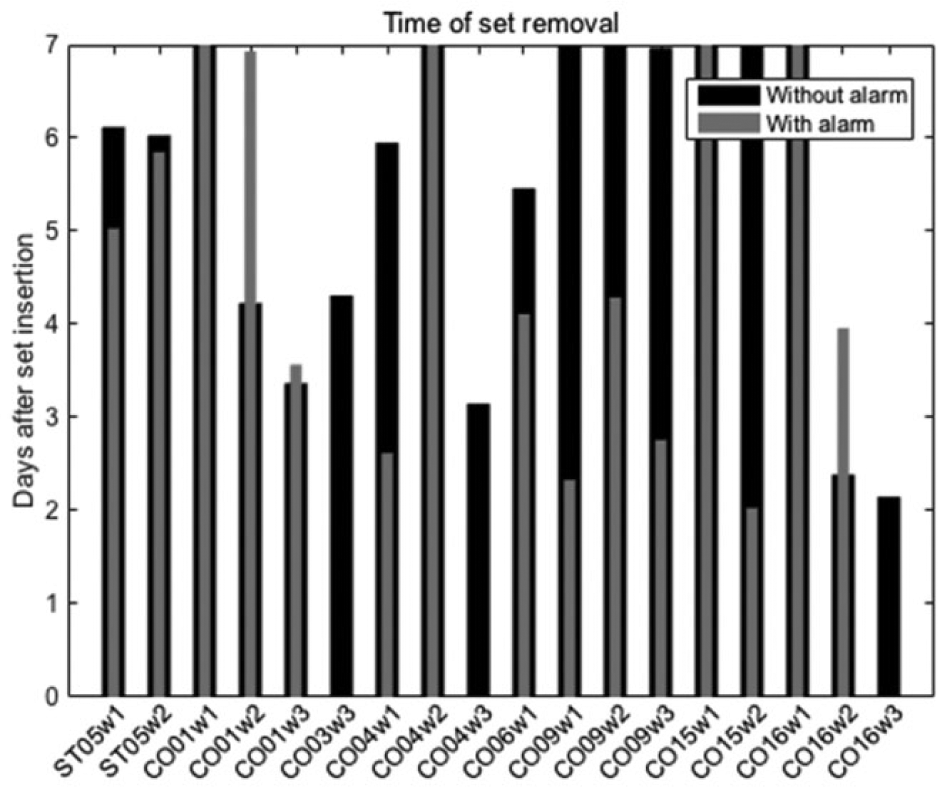
Time of infusion set removal across the population (days after insertion). Actual case recorded by the clinical team (black) versus potential case if the set failure alarm would have been activated in real time (gray).
If the set failure alarm had been activated in real time, a potential 29% reduction in the time spent above 180 (mg/dl) would have been achieved, from 82.7 ± 40.9 hours/week/patient to 58.8 ± 31.1 hours/week/patient. This reduction of time spent in hyperglycemia is “potential” and was analyzed as intent to treat in the sense that we assume the patient would have acknowledged the alert and reacted taking appropriate actions. Figure 5 gives a visual representation of the result, where the times were calculated from insertion to removal and from insertion to alert, respectively, disregarding what happened after the failure/ alert. This was in agreement with the protocol, prescribing patients to replace the set after the failure, and with our assumption of alert acknowledgment by the subjects.
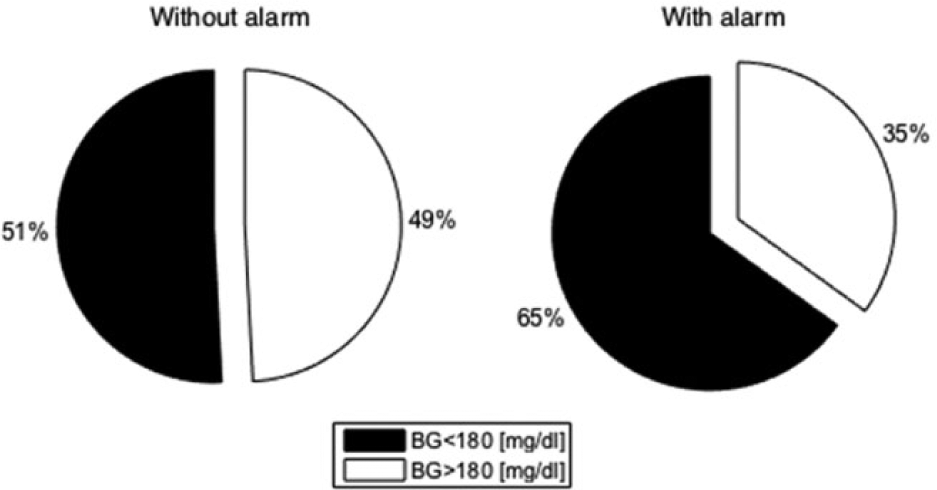
Pie charts of average time across the population spent in glycemic zones. White denotes time in hyperglycemia. Left: without set failure alarm activated; right: with set failure alarm activated in real time.
Last, Figure 6 summarizes results for 2 representative subjects.
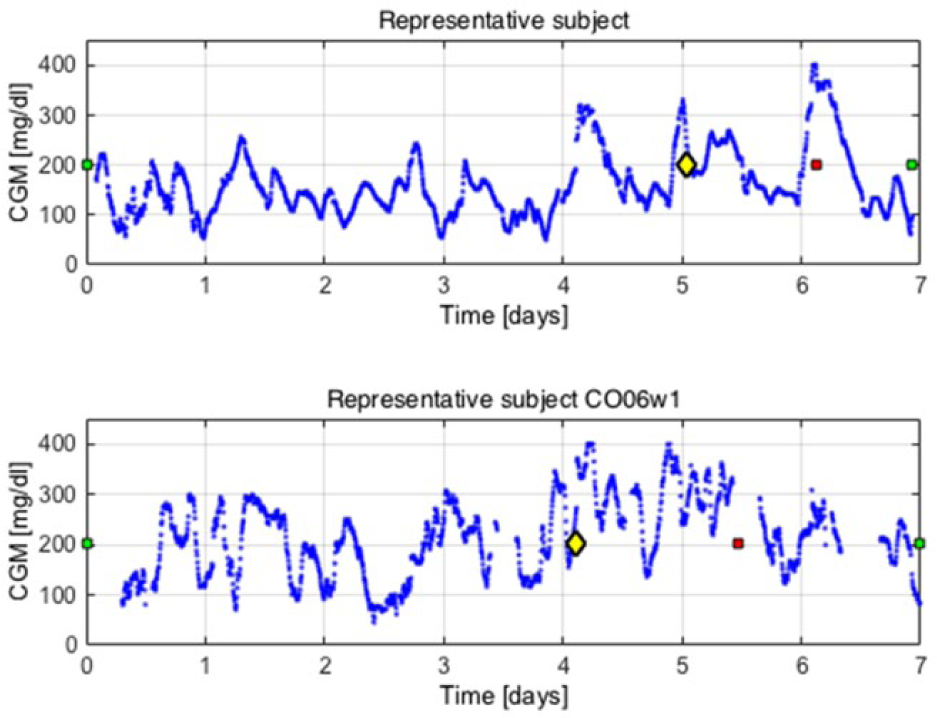
Representative subjects. CGM (mg/dl) (blue dots) versus time (days). The green squares indicate time of infusion set insertion whereas the red square denotes the time of infusion set removal due to failure. The yellow diamond shows the alert time if the proposed algorithm would be activated in real time.
Development of Parameters Used in the Proposed Algorithm
Our study describes a new alert method capable of predicting the development of an infusion set failure event. It was developed and retrospectively validated on actual patients data collected in ambulatory conditions. A performance monitoring approach was taken, as opposed to the more traditional failure detection approach.12-18 Within our framework, an alert was risen when a degradation of control performances was observed persistently over time.
The algorithm required 4 user parameters to be chosen, namely, the model order
The model order corresponds to the dimension of the parameter vector
For each of the patients in the calibration data set, different auto-regressive (AR) models
10
with order
The model FIT
10
and the minimum description length (MDL)
19
were calculated exploiting the model on the remaining weeks from the same subject, that is,
The models scoring the highest FIT and the lowest MDL, respectively, for each subject, were selected.
Next, the percentage of the output variance that was not explained by such models was computed across the calibration population in order to get an estimate of the model misfit. In addition, histograms of model orders were created, in order to understand which model order was more consistently selected in step 3.
Analyzing the model misfit and the distribution of model orders, the choice fell on
A more parsimonious model would have not captured the underlying dynamics with sufficient accuracy, conversely, a higher order model might have been more accurate for some patients but would have lead to overparameterization for some other patients. Since our objective was not to individualize the method, but rather have an algorithm working for the largest possible number of subjects, we decided to be more conservative and avoid overparameterization.
As already mentioned, the parameter
The parameter
The last parameter is the time interval for insulin counting. In Del Favero et al
18
it was proposed by the authors to use time intervals of duration 4 hours, to the purpose of retrospective evaluation of their method. In the current study we opted for the same choice, hence
Of course, the set up discussed above can be refined to suit the individual subject rather than a whole population, leading to less false alarms. However, this was not the objective of the work and is left to future investigations.
The algorithm was initiated every time a new infusion set was inserted. A difficulty encountered was represented by the fact that the patients were changing the set and the glucose sensor at the same time at the beginning of week 2, as per protocol. This means that our algorithm was initially fed with a data stream coming from a poorly calibrated device, affecting negatively the performances. At this stage we didn’t take any actions to mitigate the issue and left it to future work.
Overall, application of the method showed that it is possible to extend the length of wear of infusion sets beyond 3 days with associated benefits, without incurring in an increase time spent in hyperglycemia.
Discussion
The detection of infusion set failure in insulin pump therapy combined with continuous glucose monitoring (CGM) has been considered in the past by several investigators. Vega-Hernandez et al 20 used the mathematical model developed by Hovorka and collegues 21 to simulate different fault scenarios and a non linear observer with proportional and integral correction factors to generate the residual signals indicating the presence of faults. In order to reduce the risk of false alarms, the residuals were averaged in moving windows. Rojas et al employed bivariate classification based on the last 2 hours’ mean glucose slope, the first principal component of the PCA decomposition in their 2011 paper 12 and a combined approach 13 to detect insulin infusion set failures on 10 patients generated in silico with the FDA-accepted UVA/Padova T1DM metabolic simulator.22,23 A composite metabolic model formed by the Bergman minimal model 24 and the subcutaneous insulin infusion model 21 was employed by Herrero et al 14 to produce a set, that is, a band, of admissible trajectories of blood glucose. For the purpose of testing the fault detection technique, the T1DM simulator 22 was then used to generate data for 10 adults presenting evidence of faults in the insulin delivery system. A fault was detected when the measurements of glycemia were not contained in the estimated output band. Cameron et al 15 modified a standard continuous glucose monitor high glucose alarm as a method for detecting set failures. The researchers set the high glucose threshold at 300 mg/dl and prolonged the alarm silencing period to 5 hours, ignoring at the same time false alarms at the start, that is, glucose levels starting above 250 mg/dl. A model-based approach to generate a failure alert when the glucose values measured by the CGM sensor were not within the confidence interval of their Kalman filter 16 predicted values was proposed by Facchinetti et al 17 and Del Favero et al 18 and tested on 100 patients simulated with the UVA/Padova model.22,23
The advantage of our algorithm compared to the above cited works is that it does not require an explicit description of the glucose-insulin regulatory model, nor does it exploit user information such as meal announcement or physical activity. To the best of the authors knowledge this is the first time that a method with these features has been applied to actual outpatient data.
Moreover, the proposed method is aiming at anticipating faults rather than recognizing them after they have happened. Existing approaches based on physiological models generate a failure alert when the actual measurements given by the CGM sensor are not consistent with the corresponding retrospective predictions of glucose concentration obtained using a Kalman predictor which was previously identified offline. It is apparent, hence, that when a fault presents abruptly the measured glucose concentration differs from the predicted glucose concentration and the alert may be given. However, there is no anticipation in such detection. Our method was designed to be proactive and to be able to deal with the harder constraint of slow occlusions in a predictive manner rather than to detect abrupt faults like catheter disconnections, which are unforeseen events and as such cannot be predicted.
The results obtained with the proposed failure detection algorithm are independent of the type of insulin infusion system.
Currently, insulin pumps are equipped with in-built mechanisms to detect catheter-related problems, such as dislodgement, dislocation, kink/occlusion, or disconnection of catheters. 25 A pressure sensor embedded at the inlet of a throttling microvalve regulating the insulin flow from the reservoir, can be used to monitor the reservoir pressure. This pressure which provides the mechanical force for the drug delivery, diminishes as the reservoir is depleted and gives a measure of the residual volume. Thus, monitoring the volume changes over time provides the flow rate. Catheter-related problems, hence, can be recognized by analyzing the flow rate or, alternatively, the pressure. The proposed method offers several advantages over these mechanisms. In the first place, it is proactive in nature being able to anticipate a kink/occlusion before it accrues. Moreover, it can predict the event prior to a full block which may be detected by the devices after some time. Last, it is able to deal with faults caused by infections at the infusion site which are not detected by the pressure sensors in the pumps.
Inter-current illness, medication (eg, glucocorticoids), hormone cycles and physiological stress are known to cause changes in insulin sensitivity which in turn may have similar effects on glycemic control compared to infusion set failures. Assessing a similarity in dynamic behavior of these perturbations with that of failures would require additional studies. That said, however, at this stage we can anticipate a difference in the time constants. The proposed method is robust and is able to deal with this fact because its design was based on machine learning tools. Long term clinical studies will be needed to minimize the false positive rate. However, the alerts on an infusion site failure will reduce the complications and glucose swings associated with this type of events.
The method we presented provides alerts to the user whom may or may not decide to remove the current infusion set. Subjects may elect to deliver a bolus and subsequently verify whether the set is working on not, or check the site prior to replacing the set. The clinical benefit of removing a set is significant and overcomes the time spent in hyperglycemia. On the other hand, in case of a false positive alert with set replacement by the patient, the downside of such a replacement, is represented by the loss of an infusion set. Future investigations and a long clinical study will be able to address this economical question.
Last, we have presented a method to alert of the potential of a failure. Additional data and clinical work may improve the specificity and accuracy. However, earlier replacement of a set or a check of the infusion site by the user may prevent sever hyperglycemia. Since this is a manual operation an early alert is balanced against no action.
Disclosure: a limitation of the method is represented by the need of an uninterrupted stream of CGM data from the sensor, in order to be able to detect an increasing glucose trend accurately.
Conclusions
Insulin infusion set failures are multifactorial and can occur acutely or gradually with insulin pump therapy in T1DM. There are various etiologies of faults, such as kinking, local inflammation, infection at the infusion site, insulin precipitation and displacement of the infusion set. In all the cases, faults have variable patterns of increasing glucose levels which results in prolonged hyperglycemia or DKA. Early detection and mitigation of such failures are critical safety issues not only for a closed-loop (artificial pancreas) system, but also for current open-loop systems. The objective of this study was, therefore, to recognize the development of an infusion set failure and activate an alarm warning the patient to check and take appropriate actions.
The task was accomplished by exploitation of data-driven techniques capturing the degradation of control performances due to an upcoming failure. The method was evaluated retrospectively on a validation data set collected from patients in ambulatory conditions and demonstrated favorable results detecting the onset of faulty events before they become severe with enough time to react to them. Failures were identified 2.52 ± 1.91 days ahead of the actual event as recorded by the clinical team. The algorithm achieved 50% sensitivity, 66% specificity and 55% accuracy, with 6 TP, 2 FP, 6 FN, 4 TN. If activated in real time, under the assumption that subject would have reacted to the alerts, the algorithm would have contributed to a potential 29% reduction in the time spent above 180 (mg/dl), from 82.7 ± 40.9 hours/week/patient to 58.8 ± 31.1 hours/week/patient, Results are independent of insulin infusion system used. These fault detection algorithms require further validation and application with real-time clinical data to further establish their clinical utility.
Footnotes
Abbreviations
AP, artificial pancreas; AR, autoregressive; CGM, continuous glucose monitor; CSII, continuous subcutaneous insulin infusion; DKA, diabetic ketoacidosis; FN, false negative; FP, false positive; TN, true negative; TP, true positive.
Declaration of Conflicting Interests
The author(s) declared the following potential conflicts of interest with respect to the research, authorship, and/or publication of this article: MC: None. DJD: None. TTL: None. DMM: Insulet Corporation, Dexcom, Inc, Medtronic, Inc. LHM: Medtronic, Inc. BAB: Medtronic, Inc, Animas Corporation, BD Medical Diabetes Care, Tandem Diabetes Care, Inc, Sanofi US, Novo Nordisk Inc, Hylenex, Dexcom, Inc. FJD: Insulet Corporation. ED: Animas Corporation, Insulet Corporation.
Funding
The author(s) disclosed receipt of the following financial support for the research, authorship, and/or publication of this article: JDRF Grant 17-2013-471 and National Institutes of Health Grant DP3DK094331.