
Abstract
The clinical benefits of real time continuous glucose monitoring (rtCGM) use have been well demonstrated in both CSII- and MDI-treated individuals in large clinical trials. However, recommendations for patient use of rtCGM in everyday life situations are lacking. This article provides guidance to clinicians and patients with type 1 diabetes (T1D) in effective use of rtCGM data, including glucose rate of change (ROC) arrows, for insulin dosing adjustments and other treatment decisions. The recommendations presented here are based on our own clinical experiences as endocrinologists, our personal experiences living with T1D using rtCGM, and findings from a recent survey of T1D patients who have successfully used rtCGM in their self-management. It is important that both clinicians and people with diabetes understand the utility and limitations of rtCGM. Maintaining a collaborative clinician-user relationship remains an important factor in safe, successful rtCGM use.
Keywords
The clinical benefits of real-time continuous glucose monitoring (rtCGM) use have been well demonstrated in both CSII- and MDI-treated T1D individuals; however, few studies have specifically looked at how individuals utilize rtCGM data.1,2 Although CGM management algorithms were established for subjects in clinical trials,3 -5 recommendations for patient use of rtCGM in everyday life situations are lacking.
The purpose of this article is to provide guidance to clinicians and patients with type 1 diabetes (T1D) in effective use of rtCGM data, including glucose rate of change (ROC) arrows, for insulin dosing adjustments and other treatment decisions. The recommendations presented here are based both on our own clinical experiences as endocrinologists and our personal experiences living with T1D using rtCGM. Our recommendations also are based on findings from a recent survey 1 we conducted to explore how 222 individuals with T1D used rtCGM successfully, defined as having a good A1c and minimal hypoglycemia, in their everyday self-management. Findings from the survey will be discussed throughout the article. It is important to note that the recommendations presented here are specific to the Dexcom Platinum G4 and G5 Mobile (Dexcom Inc, San Diego, CA, USA), both of which use the Software 505 algorithm. However, these recommendations can be adapted to other rtCGM systems.
Background
SMBG is recognized as a core component of effective self-management of insulin-treated diabetes.6 -10 However, given the recent advances in the accuracy, reliability, and usability of rtCGM systems that have alerts and ROC arrows, many clinicians and patients feel strongly that SMBG does not provide adequate information to effectively manage insulin-treated diabetes to avoid extreme hyperglycemia and safeguard against hypoglycemia, which remains an ongoing threat to personal safety and well-being.11 -16
Whereas SMBG presents only a single point-in-time measure of glucose, rtCGM displays continuous information about the current glucose level and glucose trends, and provides the user with ROC arrows, which indicate the direction and velocity of changing glucose. Another key feature differentiating rtCGM from SMBG is the ability to program alerts that warn the user when glucose levels increase or decrease beyond a defined glycemic threshold, individualized for each patient. The around-the-clock vigilance with rtCGM provides a significant safety advantage relative to SMBG and other technologies that do not automatically alert the patient if the glucose values go above or below a predetermined level.
Historically, rtCGM users have been instructed to verify their glucose value with SMBG before taking insulin or adjusting other components of therapy. Currently, all rtCGM systems in the United States are still indicated for “adjunctive use” with SMBG, which simply means that patients are always encouraged to confirm their CGM result with a fingerstick test before making management decisions. However, the accuracy of some current rtCGM systems is now at levels similar to SMBG, 17 and a growing body of evidence shows that use of glucose data (with MARD <10%) in combination with ROC arrows and alerts/alarms largely mitigates potential hypoglycemia risks associated with rtCGM-based dosing decisions and often improve glycemic outcomes.18,19 One rtCGM system (G5 Mobile, Dexcom, Inc, San Diego, CA) recently received CE-mark approval to replace SMBG for routine diabetes treatment decisions outside the United States. Recent in silico studies support this indication.19 -21 However, regardless of the status of this indication to replace SMBG confirmatory results, patients are currently using these devices to make many treatment decisions. 1 It is our clinical experience, however, that patients started on these devices are given instructions on how to wear them (calibrations, applying the sensor, day to day wear, etc), but they are provided little to no guidance on how to use the information they provide. Providers may review the data retrospectively and hope to identify patterns, but little information is provided on how to respond to the information in real-time. Moreover, several studies have demonstrated that use of professional (blinded) CGM does not confer significant benefits in improving patient care.22 -25 Given that the majority of clinical benefits associated with CGM use come from real-time treatment decisions, we feel strongly that general guidelines on how to use real-time CGM should be provided to patients.
Evidence for Efficacy of rtCGM Use
Numerous studies have shown that use of real-time rtCGM improves glycemic control as measured by HbA1c, improves time in range, reduces hypoglycemia, and improves quality of life in both children and adults with T1D.26 -35 However, the benefit of rtCGM is primarily seen in patients who regularly wear their devices and appropriately utilize the glucose data provided.26,27 Interestingly, many studies have reported that rtCGM users performed SMBG notably less frequently than non-rtCGM users,27,30,32,36 A recent survey of 1613 rtCGM users who are enrolled in the T1D Exchange registry found that approximately 50% of respondents performed SMBG “less often” or “much less often” when using rtCGM. 29 This suggests that patients are currently relying on their rtCGM data to make therapy decisions including dosing timing and adjustments, diet modifications, and exercise timing and intensity in real-time.
As mentioned earlier, we conducted a survey of 222 T1D individuals who were successfully using rtCGM; success was defined as “minimal hypoglycemia, no severe hypoglycemia” and good glycemic control (mean HbA1c 6.9%), and found that they rely on their rtCGM system features, particularly the alerts and glucose ROC arrows, when making insulin dosage adjustments. 1 Survey respondents reported that use of ROC arrows prompted significantly greater dosage adjustments (increases and reductions), resulting in improved HbA1c and reduced frequency/severity of both hyperglycemia and hypoglycemia. These dosage adjustments were significantly greater than the 10-20% adjustments in insulin dosing used in the JDRF Trial, DirecNet trial, and other studies.3 -5
In stark contrast, when survey respondents were provided a situation with a current glucose of 220 mg/dl that was rapidly increasing (2 arrows up), they reported a dramatic 140% mean increase in their typical correctional insulin dose. With the same glucose level (220 mg/dl), subjects would decrease their dose by mean 42% in response to a falling glucose (2 arrows down). Therefore, with the same blood glucose value, insulin doses varied significantly, depending on the trend, ranging from 1.6-6.7 units. It is important to note that this survey was not intended to elucidate the “right” answer, but rather to identify the gap in our current clinical care and knowledge of patient behaviors. Patients are using these devices to make major changes in their insulin dose, yet no guidance is given to them. Therefore, there is a clear need to provide a framework to patients and clinicians on how to make these adjustments. 37
Using rtCGM Data for Insulin Dosing Decisions
Important Conceptual Shift in Treatment Decision Making
Utilizing rtCGM data for therapy adjustment requires a conceptual shift from “point-in-time” testing (SMBG) to “anticipated” glucose levels, using the glucose goal, current glucose value, trend graph, actionable alerts and ROC arrows. Figure 1 provides an example of how these components appear in the rtCGM display. Note that these components are not standardized among rtCGM systems. For example, among the 3 commercially rtCGM systems available worldwide that offer ROC arrows, there are differences in how ROC is defined and displayed (Figure 2). Again, the recommendations included in this article are based on the ROC arrows utilized in the Dexcom rtCGM systems. Therefore, it is very important that users and their clinicians become familiar with these differences when choosing an rtCGM device or switch from one system to another.
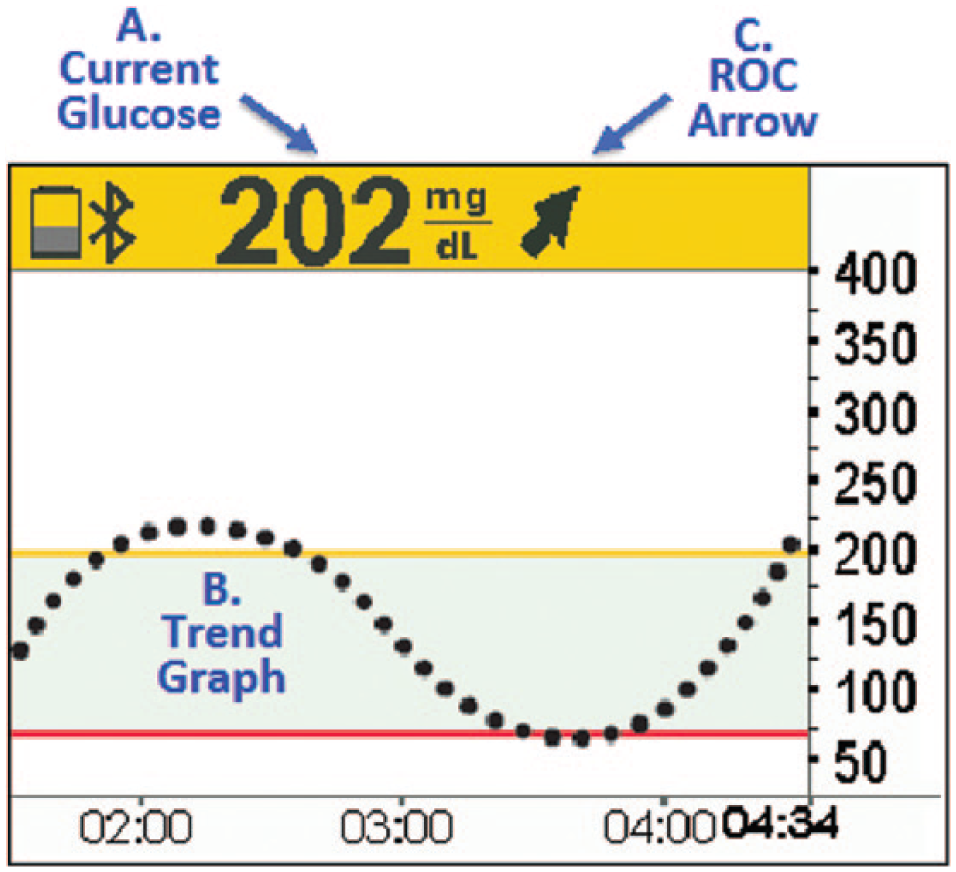
Data components of rtCGM-based therapy adjustments. (A) Current glucose: The rtCGM displays the current sensor glucose as a numerical value. (B) Trend graph: The rtCGM systems display trend graphs that visualize glucose levels over the past 1-24 hours. This information provides information that can help users prevent recurrence of specific problems. (C) Rate of change (ROC) arrows: The ROC arrows indicate the direction and rate of change (increase/decrease) within a specified time period. Note that the current commercially available rtCGM systems use slightly different arrow configurations and time periods.
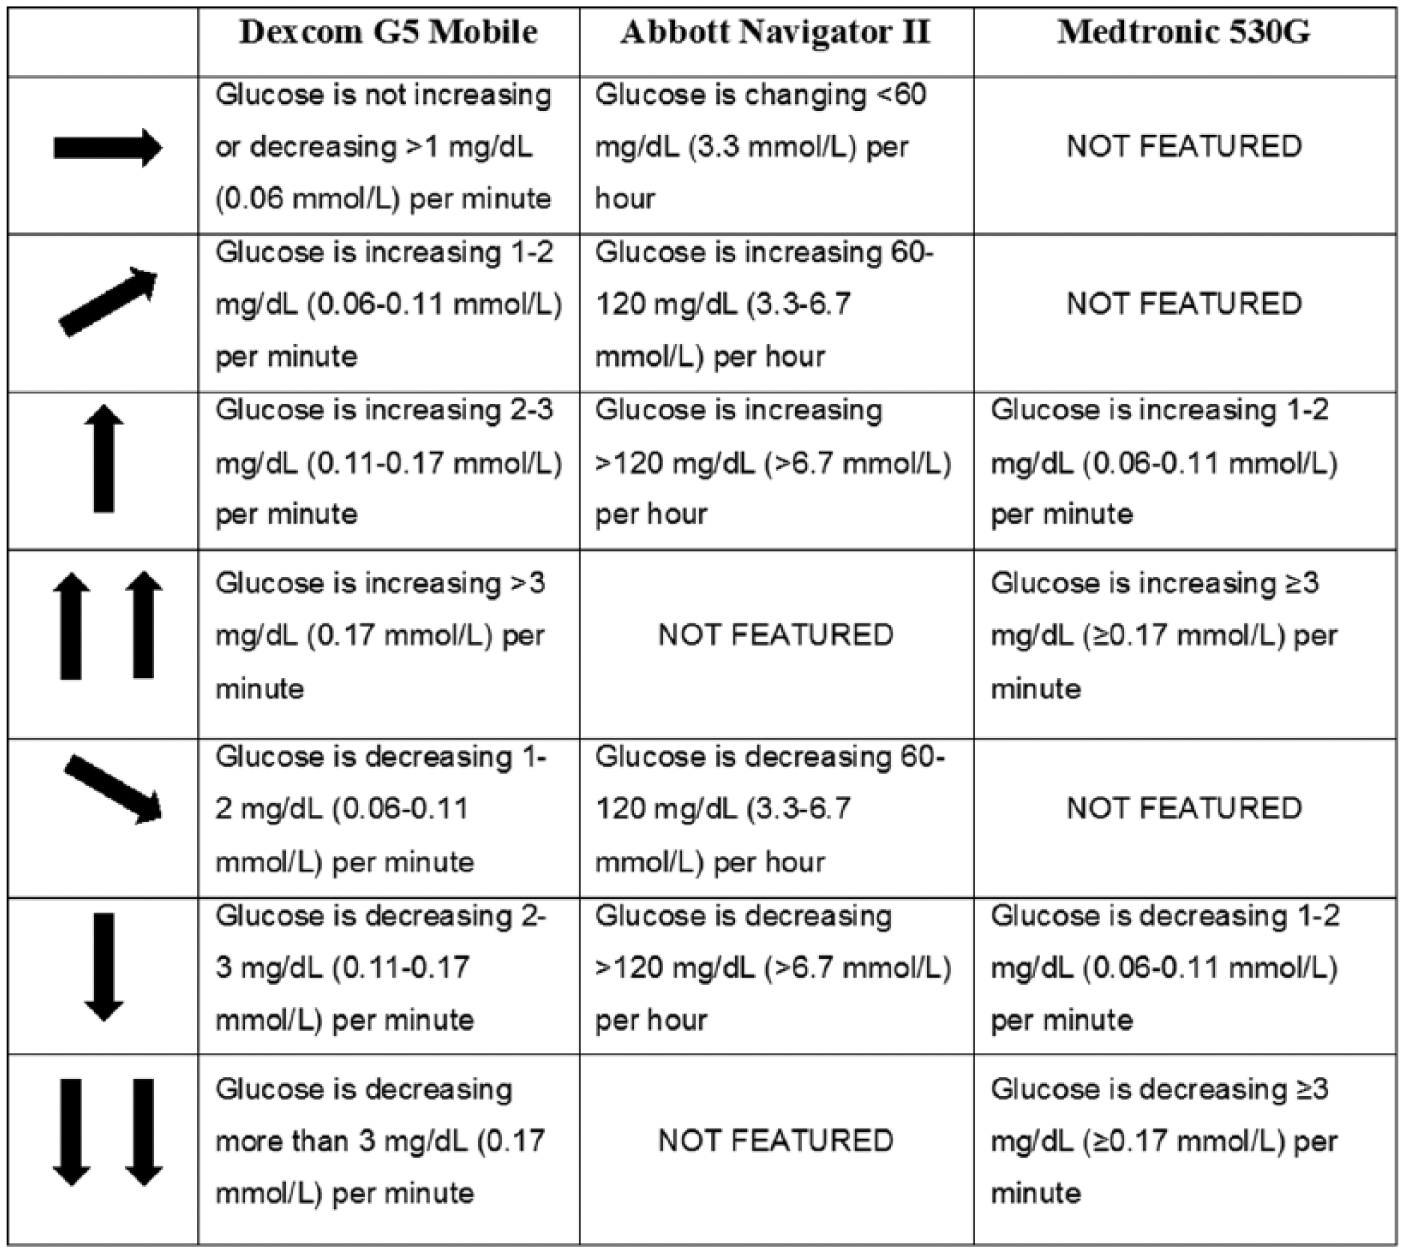
System differences in ROC arrows.
Utility of ROC Arrows
As discussed previously, rtCGM-based therapy adjustments should focus on the anticipated glucose by using the ROC arrows in addition to the current glucose level. Calculations of insulin dosages are then based on the anticipated glucose and each user’s individualized glucose goals and insulin parameters, such as insulin-to-carbohydrate ratios (ICR) and insulin sensitivity factors (ISF), often referred to as “correction factor” (CF). For example, if the rtCGM displayed a glucose value of 120 mg/dl with 1 up ROC arrow, the anticipated glucose would be between 180 mg/dl and 210 mg/dl in 30 minutes. The calculated insulin dose would then be based on this anticipated glucose range. The 30-minute time frame was selected because the pharmacokinetics and pharmacodynamics of current rapid acting insulin analogues require roughly this amount of time to meaningfully affect glucose levels. In our experience, the trend information is reliable in predicting a glucose 30 minutes in the future.
An easy way to determine the 30-minute anticipated glucose is to use the calculations presented in Figure 3. For example, if the rtCGM displays the current glucose as 120 mg/dl with 1 UP ROC arrow, the insulin dosage would be based on an anticipated, 30-minute glucose of 180 mg/dl (most conservative approach). The user can decide based on other variables mentioned below to use the higher target (up to 210 mg/dl).
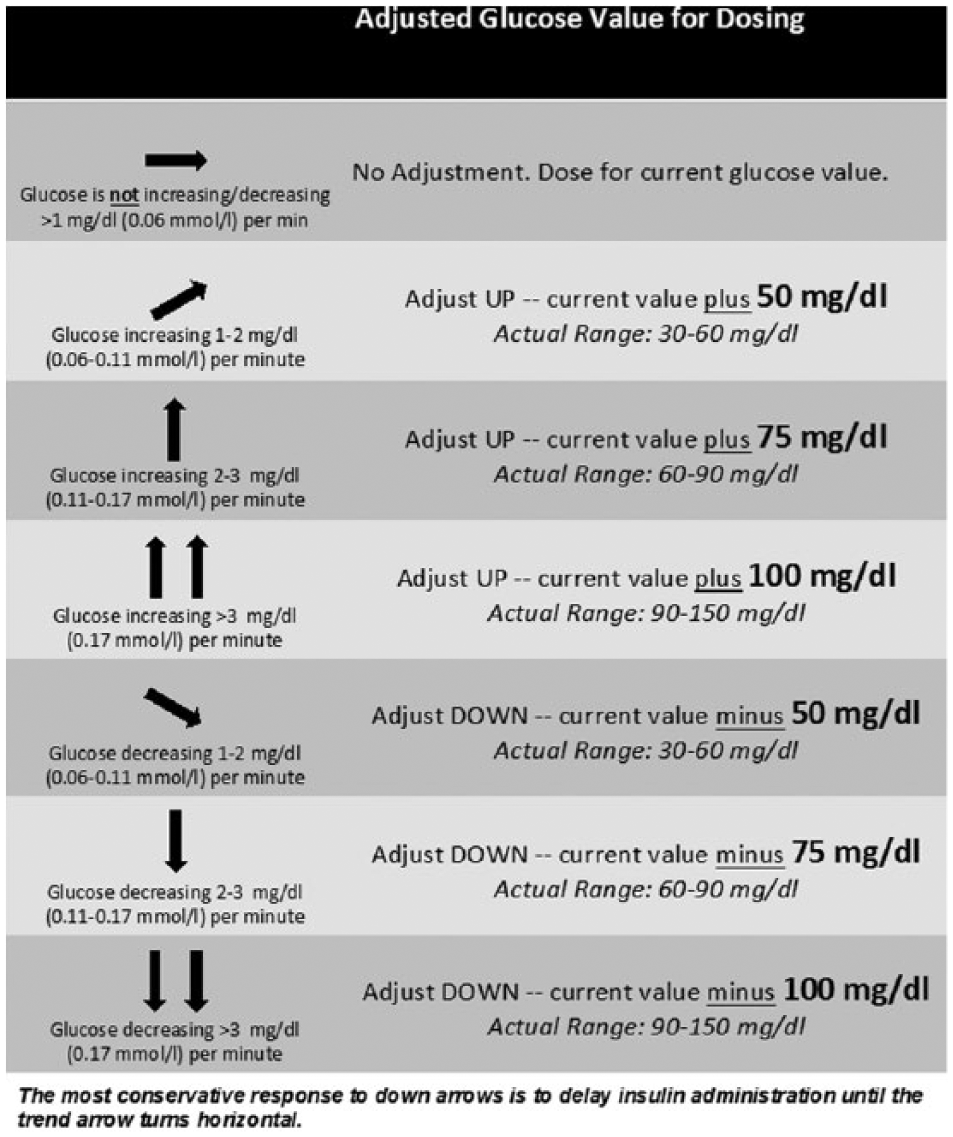
Flow sheet for prandial and correction dosages.
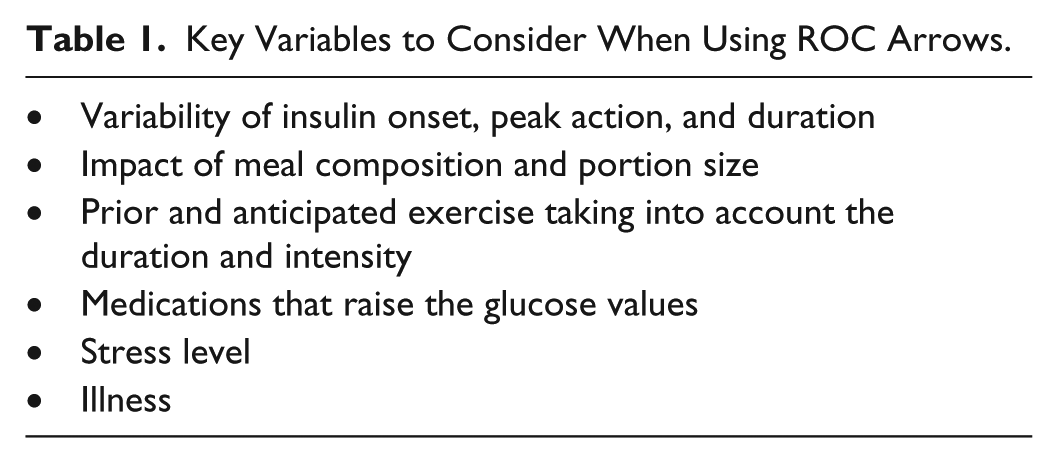
This method allows for appropriate (albeit conservative) treatment decision-making given the numerous factors that can affect the degree and duration of glucose excursions. For example, it is known that subcutaneous injections of identical insulin doses in the same body location can lead to considerable intra- and interindividual differences in glycemic response. 38 Studies have also shown that analog insulin absorption and activity with CSII varies significantly over 3 days of continuous infusion.39 -42 Table 1 presents some of the main variables to consider when using ROC arrows to calculate insulin dosages.
Key Variables to Consider When Using ROC Arrows.
Although accurate prediction of an exact glucose level at any future time is unrealistic, the anticipated 30-minute glucose range indicated by the ROC arrows provides a narrow enough estimate to make appropriate treatment decisions. An alternative method of insulin adjustment would be to use a percentage increase or decrease depending on the ROC curve as we reported in our initial survey, however we felt using the anticipated glucose method would be simpler and easier to use.
Moreover, because rtCGM provides continuous feedback (eg, alerts, trending and current glucose data), the user has the ability to “fine-tune” treatment as needed and make any follow-up adjustments if the dose given was too high or too low. However, users should be cautioned about stacking their doses (taking multiple boluses too close together in time). If a user gives a correction dose within 2 hours of the last bolus, the risk of hypoglycemia is increased because subcutaneously delivered rapid-acting insulin can take up to 90-120 minutes to peak and may still be working 4 to 5 hours after the injection. The time course of action of rapid acting insulin will vary from patient to patient and from day to day, and needs to be individualized. One set of recommendations does not apply to all, and this is especially true when it comes to calculating insulin doses in T1D. Although patient education can provide the principles of intensive insulin management, the most effective learning will come from trial and error and user experience over time. Wearing a CGM continuously protects the user from “mistakes” and the unpredictable nature of insulin pharmacodynamics.
Clinical Scenarios
The following scenarios represent examples of how ROC arrows can be used for both prandial and correction dosing, using the glucose percentage method. The insulin parameters used for the scenarios are 110 mg/dl for target glucose; 1:15 grams insulin-to-carbohydrate ratio (I:CHO); and a CF of 1:50 mg/dl. The planned meal for the prandial dosing scenarios is 45 g carbohydrate.
Prandial Dosing With Angle UP ROC Arrow
As shown in the rtCGM display, the current glucose is at target with an angle-up ROC arrow (Figure 4). Using the simpler method, the patient would calculate the 30-minute anticipated glucose to be 160 mg/dl. The first step in prandial dosing is to calculate the insulin dose needed to cover the planned carbohydrate intake, which, in this case, would be 3.0 units. The next step is to calculate the insulin needed to cover the 30-minute anticipated glucose, which would be 1.0 units. Therefore, the total prandial dose would be 4 units, depending on other variables that the patient should consider discussed in Table 1. The process is easier for insulin pump users, who would simply enter the anticipated CHOs and selected 30-minute anticipated glucose. The bolus calculator will then determine the insulin dose. As previously mentioned, there are now a glucose meter and phone apps that can make the same bolus calculations with more coming on the market almost daily.
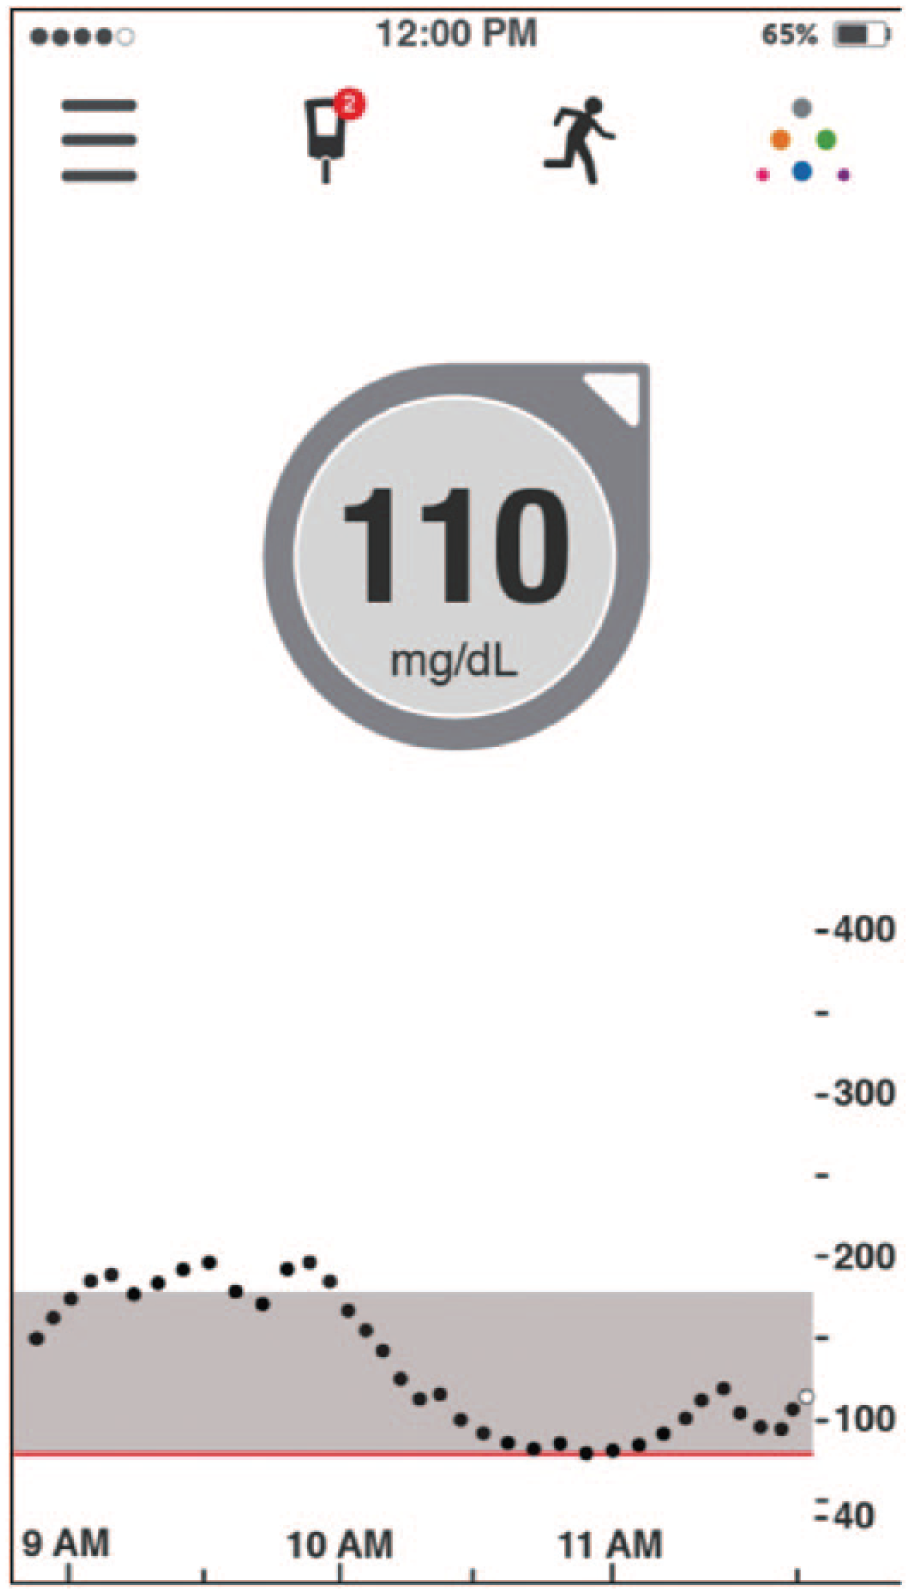
110 mg/dl with angle UP arrow (phone app display).
It is important to note that in this particular situation, even taking the most “extreme” adjustment recommended would be an increase in dose by 1.2 units. We feel that these recommendations are a conservative starting point that can then be adjusted based on postprandial results. The key message, however, is that patients need to understand the concept that blood glucose numbers are not static, and, therefore, dosing for anticipated changes is required. It is for this reason that mealtime dosing with analogue insulin is advised 20 minutes before eating.
In situations where the glucose is rising more rapidly (1 or 2 UP arrows), it is sometimes recommended that the patient administer the insulin but wait to eat the meal until the ROC arrows start to angle or level off, indicating the rate of change of glucose is slowing down. This strategy is referred to as “waiting for the bend” on the CGM display, which indicates insulin action. Patients can be instructed to use this as a cue for timing of meals. 43 Early administration of prandial insulin and waiting to consume the meal has been shown to reduce the post meal glucose level and negate the need for a correction dose, thereby minimizing the risk of insulin “stacking” and delayed hypoglycemia. 44
Prandial Dosing With Angle DOWN ROC Arrow
In this scenario, the rtCGM shows that the current glucose is at target (110 mg/dl) with the angle DOWN arrow (Figure 5). The patient would calculate the 30-minute anticipated glucose, which in this case would be 60 mg/dl. The patient would calculate the insulin needed to cover the planned carbohydrate intake (3.0 units). However, in situations such as this, in which the expected glucose trend could take this patient into a hypoglycemic level, patients are advised to eat the meal first and closely monitor the glucose trend to confirm mitigation of the impending hypoglycemia. Insulin may or may not be needed depending on the size and nutrient composition of the meal, the amount of insulin onboard, the current glucose level, and the rate of glucose fall. Therefore, in some situations, it is advised that the patient eat first and then, wait for the glucose to stabilize, and then administer insulin only if the glucose begins to rise or stabilizes (horizontal ROC arrow) at a higher then desired level.
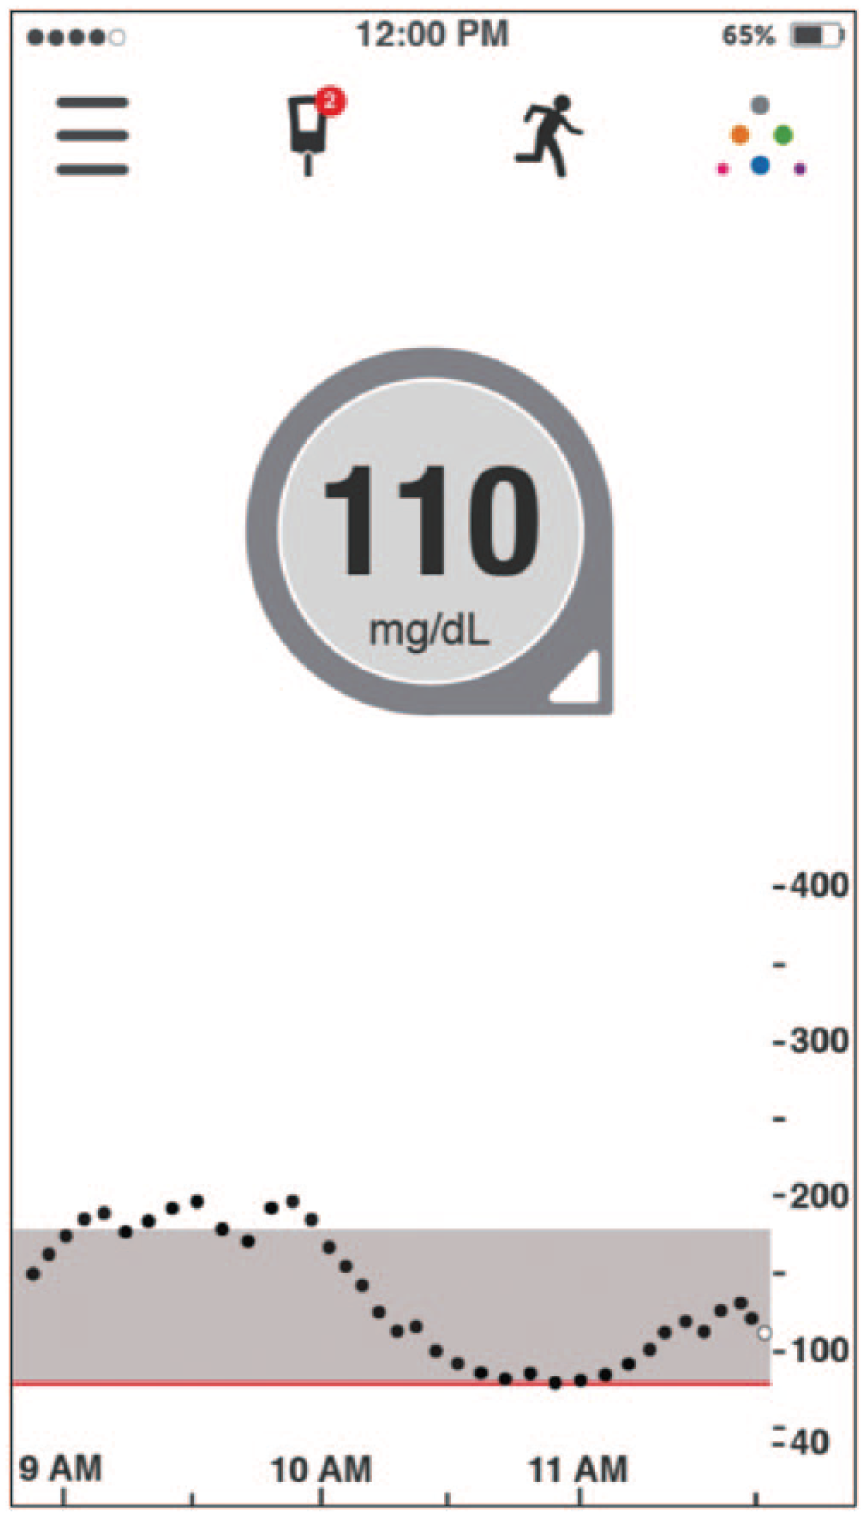
110 mg/dl with angle DOWN arrow (phone app display).
It is important to note that in the 2 prandial scenarios discussed, not only did the insulin dose recommendations change (ranging from adding a correction component to no correction) but so did the meal timing (ranging from waiting to eat to eating immediately). Notably, in each situation, the current blood glucose level was identical (110 mg/dl), yet the management recommendations are drastically different, again highlighting the importance of ROC information.
Correction Dosing With 1 UP ROC Arrow
In this scenario, the rtCGM shows that the current glucose is 220 mg/dl with 1 UP arrow (Figure 6). This indicates a 30-minute anticipated glucose of 295 mg/dl, using the simpler method. Based on the CF of 1:50 with a goal of 110 mg/dl, the patient would give a correctional dose of 3.7 units to achieve the glucose target of 110 mg/dl. Insulin pump users simply enter the 30-minute anticipated glucose into their pump and the correction dosage will be calculated automatically. Had this patient used the static glucose value of 220 mg/dl alone (horizontal ROC arrow), the calculated dose would be 2.2 units. Therefore, this recommendation would result in a 70% dose increase. We believe this is a conservative adjustment based on our personal and clinical experience, as well as our survey results, which showed an average increase of 110%. Another variable that should be considered by users is that when the glucose value is very high such as above (>300 mg/dl), they become resistant to the administered insulin and that their normal CF becomes inadequate. For example, one’s CF may be 1:50 mg/dl when the glucose value is below 250 mg/dl, however it changes to 1:35 mg/dl when the glucose value is above 250 mg/dl. Once again, these variables affect each individual differently and it is impossible to come up with formal recommendations to fit all patients with diabetes.
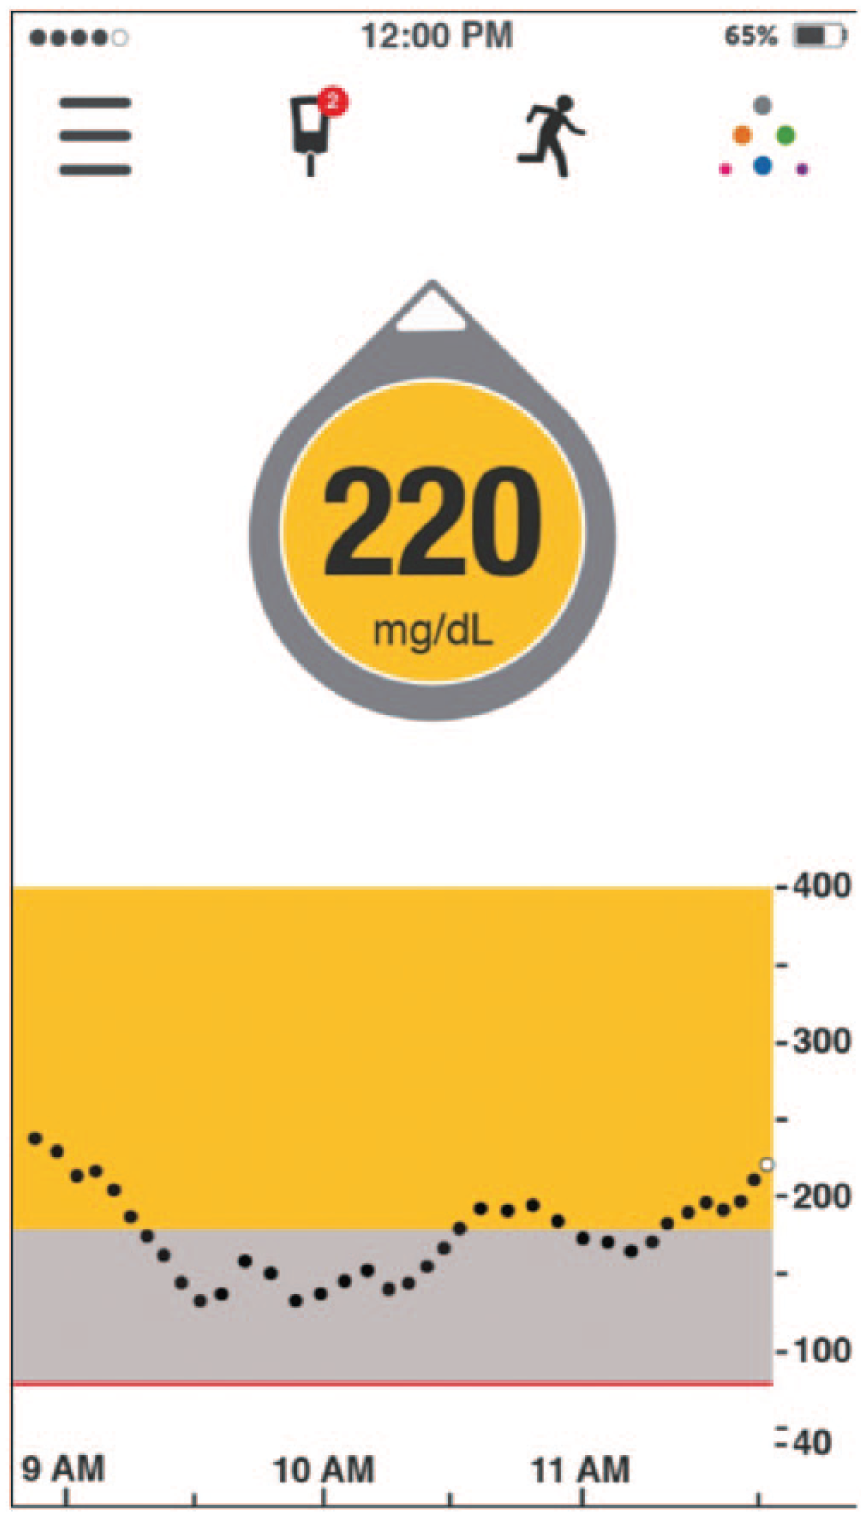
220 mg/dl with UP arrow (phone app display).
Correction Dosing With 1 DOWN ROC Arrow
In this scenario, the rtCGM shows that the current glucose is 220 mg/dl with 1 DOWN arrow (Figure 7). This indicates a 30-minute anticipated glucose of 145 mg/dl. In this situation, many patients would wait until the ROC arrow levels off (horizontal) before giving additional insulin. If the arrow levels off above goal, the patient can then calculate and administer a correction dose accordingly. If the arrow levels off below the target range or does not level off, the patient should obviously take appropriate actions to prevent impending hypoglycemia. This example highlights, again, the importance of incorporating the ROC information, as in these 2 correctional scenarios with identical glucose of 220 mg/dl, recommendations range from not taking any insulin to taking a larger than “usual” dose.
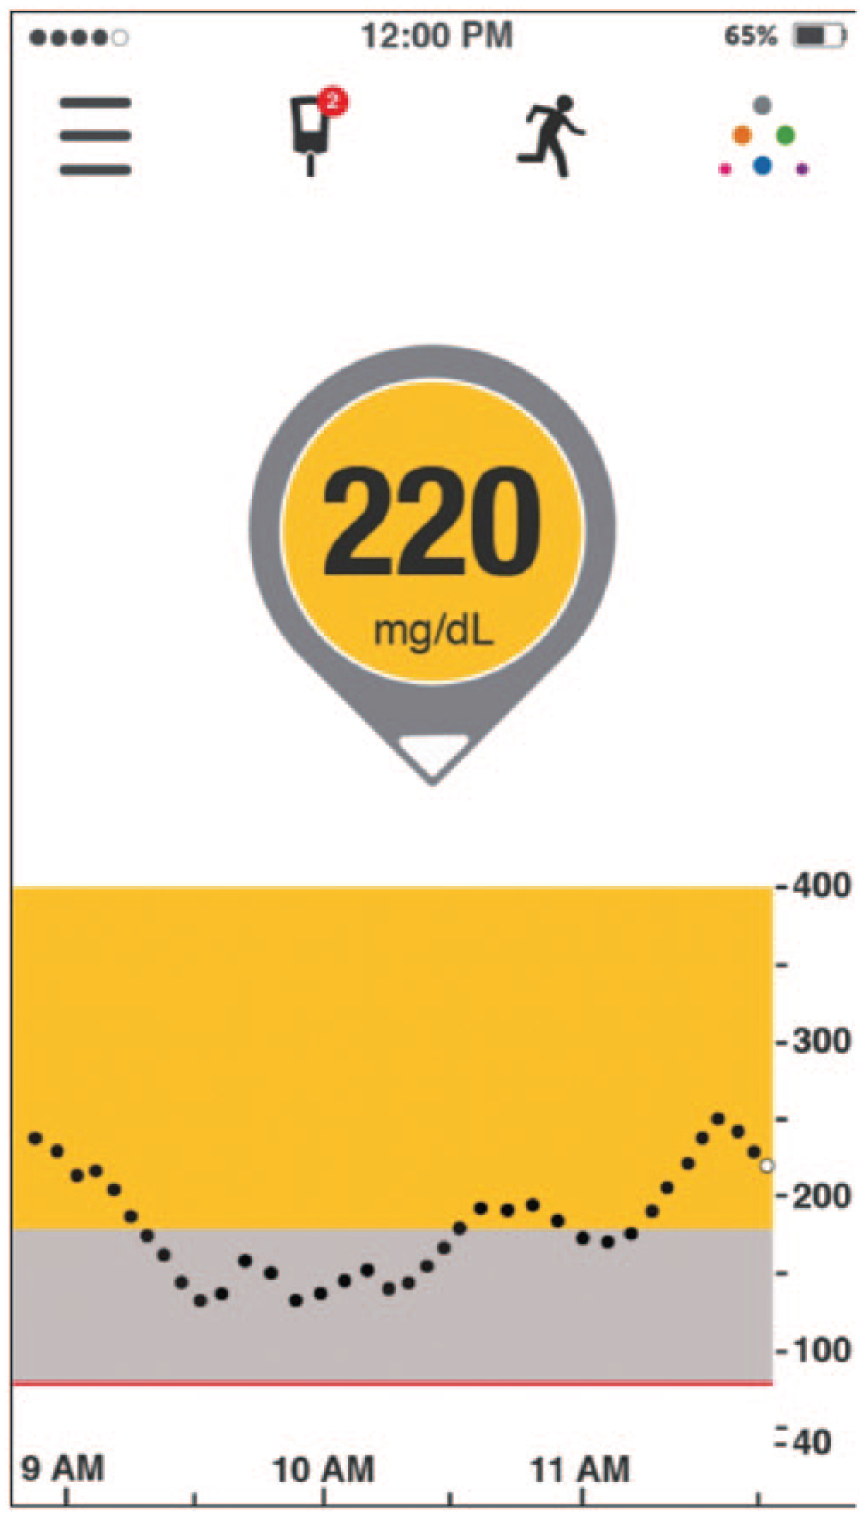
220 mg/dl with DOWN arrow (phone app display).
Practical Considerations
Although the above recommendations focus primarily on making insulin adjustments based on ROC arrows, it is important to note that these are intended only as a starting point. Multiple variables must be considered when determining whether and/or to what degree an insulin adjustment is warranted. These include but are not limited to:
Previous exercise: Patients will be more insulin sensitive after exercise and may have to adjust their insulin needs on the more conservative side. In addition the intensity and duration of exercise performed in important. Walking for 30 minutes at a slow pace is obviously quite different than a 5-mile ocean swim.
Planned exercise: Depending on the duration and intensity of exercise, this may lower or raise the patient’s glucose, especially after the exercise is concluded, and affect the insulin dosing. Users should be adjusting any prandial insulin dosing, nutrient consumption and basal rate alterations for pump users, and so on.
Meal composition (previous or planned): High CHO meals will affect the patient’s glucose immediately, and thus the above recommendations are probably the most accurate for CHO containing meals. However, high fat/protein meals have delayed absorption and lead to delayed hyperglycemia, meaning that insulin doses may have to be adjusted accordingly. 44
Active insulin: The duration of rapid-acting insulin activity is generally 3-5 hours. When administering correction doses within this time period, patients must consider this additional insulin action and, thus, consider reducing the correction dose. Otherwise, this can result in insulin “stacking,” which can lead to hypoglycemia.
Limitations of Dosing Adjustments Based on ROC Arrows
Although we have seen significant improvements in the accuracy rtCGM within the past few years, a few challenges remain that can impact sensor reliability and performance. In other words, there are situations when patients will need to confirm their rtCGM data with SMBG.
Use of acetaminophen. Acetaminophen treatment impacts rtCGM accuracy, resulting in erroneously high glucose readings and causing a falsely elevated ROC arrow. 45 Use of acetaminophen can also cause a false increase in the rate of glucose change, affecting ROC arrows.
Symptoms do not match the rtCGM trend information. It is critical that patients perform a fingerstick test whenever their rtCGM data, such as the glucose value or trend information, do not match their symptoms or expectations. Patients also need to know that SMBG values also can be false, and hand washing before lancing the finger is strongly advised.
When trend graph is showing a change in glucose direction. The ROC arrows are based on the average rate of change over the preceding 20-30 minutes. If the trend graph shows a change in glucose direction, the dosing adjustments should not be based on the ROC arrows. For example, following treatment of hypoglycemia, the trend arrows, which had been pointing down, may lag behind the trend graph. So, although the glucose may be rapidly rising as seen on the trend graph, the trend arrows may be horizontal.
At initiation of rtCGM monitoring. Using the information provided by these devices is a gradual learning curve. We do not advise patients to immediately begin following these recommendations until they are comfortable with the device and feel that the results accurately match their SMBG results. Once they gain confidence in their rtCGM data, they can begin using the information to make treatment decisions.
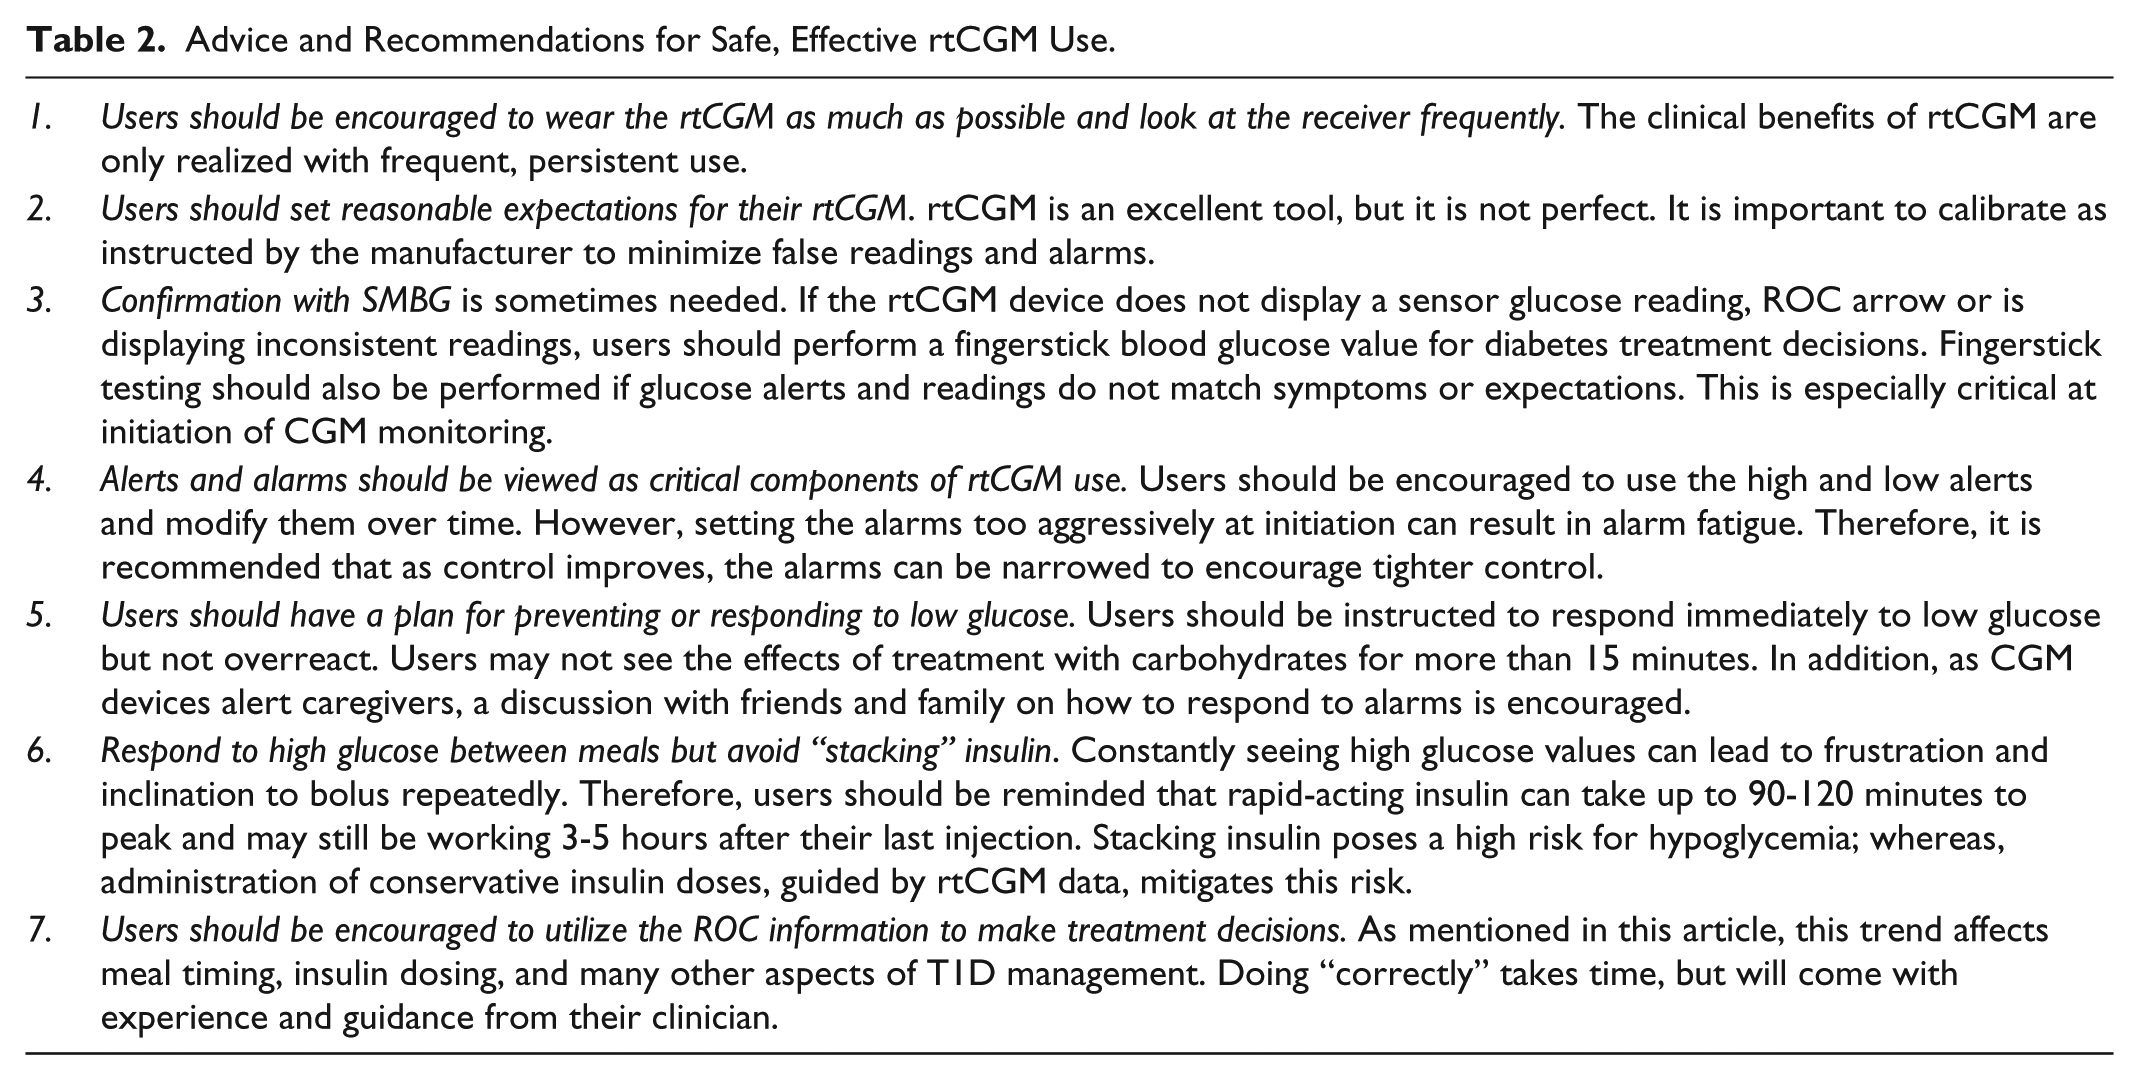
Users should be encouraged to think about their decisions that worked well and what they could do differently to prevent high, low, or rapidly changing glucose. Table 2 presents additional advice and suggestions for safe and efficacious use of rtCGM.
Advice and Recommendations for Safe, Effective rtCGM Use.
Discussion
CGM has been available for over 10 years, and until now, there has been a scarcity of recommendations on how to adjust premeal and correction insulin doses based on the ROC or trend arrows. T1D is a condition in which many variables can affect glucose values. Thus, patients must experiment; “trial and error” is the norm rather than the exception.
Preventing the duration and severity of hyperglycemia, while avoiding hypoglycemia is the goal in T1D. We feel that the introduction of CGM is one of the most important advances for people with T1D since the discovery of insulin in the early 1920s.
The recommendations given in this article are primarily from our validated questionnaire of 222 successful rtCGM users (mean HbA1c of 6.9% with minimal, mild, and no severe hypoglycemia), but also from our own personal experience living with T1D for a combined 68 years, and from seeing patients in clinic as well as from the multiple large patient oriented conferences we present around the country (Taking Control of Your Diabetes, www.tcoyd.org).
Our idea of using the anticipated glucose in 30 minutes is a very straightforward and conservative approach to increasing and decreasing the insulin does before meals and for correction. For example, the subjects in our survey made greater percentage changes in their dose based on the ROC arrows compared to the anticipated glucose method we have proposed.
The main point of our recommendations is to have users of rtCGM devices, and providers that prescribe them, start to think about these concepts and make adjustments in their diabetes management based on where their glucose values were coming from and the direction that they are going. Merely using a static glucose value to calculate insulin doses along with the grams of carbohydrates has limited value.
We do not think it is possible to give precise formulas for insulin dosing in people with T1D, but only general guidelines as a place to start from. It is also not feasible to provide exact recommendations for the many variables that can and commonly do affect glucose control, including the composition, amount and timing of food ingestion, exercise (type, timing, intensity, duration), prior insulin dose, other illnesses, other medications, stress, seasonal and diurnal variations in insulin sensitivity, mild to moderate gastroparesis, and so on. Added to these variables is the fact that subcutaneously injected insulin has a tremendous day-to-day intrapatient variability that creates a greater degree of unpredictability.
It is our hope that our recommendations provide a starting point for how to use the trend information. More important than the specific recommendations is the concept that insulin doses must be modified based on this valuable trend information. This concept applies not only to patients using these devices in real time but to the providers who will be guiding patients throughout the “lifespan” of these devices, from initiating use to perfecting it.
We believe that previous recommendations on insulin dosing have been far too rigid for far too long and fail to incorporate useful rtCGM information. As proof of this, our recommendations and previous work highlight that not all glucoses are created equal. Advice on how to respond to a given glucose value varies drastically based on where the glucose level is heading. If this information is not incorporated into insulin management, then we are not using these devices to their fullest potential, and in fact, missing their benefit entirely.
Having access to an accurate glucose value every 5 minutes with high and low alerts and ROC arrows is the most valuable tool people with type 1 diabetes have to help predict the unpredictable. We hope our recommendations to adjust insulin dosing based on the anticipated glucose in 30 minutes for mealtime and corrections will be helpful to people living with T1D and providers who take care of them.
Footnotes
Acknowledgements
The authors wish to thank Christopher G. Parkin, MS, for editorial support in developing this article.
Abbreviations
CF, correction factor; CGM, continuous glucose monitoring; CSII, continuous subcutaneous insulin infusion; HbA1c, glycated hemoglobin; I:CHO, insulin-to-carbohydrate ratio; ICR, insulin-to-carbohydrate ratio; ISF, insulin sensitivity factor; MDI, multiple daily insulin injections; ROC, rate of change; rtCGM, real-time continuous glucose monitoring; T1D, type 1 diabetes.
Declaration of Conflicting Interests
The author(s) declared the following potential conflicts of interest with respect to the research, authorship, and/or publication of this article: JP and SVE have served as a consultants and advisory board members for Dexcom, Inc, and received research funding from Dexcom, Inc.
Funding
The author(s) disclosed receipt of the following financial support for the research, authorship, and/or publication of this article: Funding for the development of this article was provided by Dexcom, Inc, San Diego, CA.