
Abstract
Hypoglycemia is defined by an abnormally low blood glucose level. The condition develops when rates of glucose entry into the systematic circulation are reduced relative to the glucose uptake by the tissues. A cardinal manifestation of hypoglycemia arises from inadequate supply of glucose to the brain, where glucose is the primary metabolic fuel. The brain is one of the first organs to be affected by hypoglycemia. Shortage of glucose in the brain, or neuroglycopenia, results in a gradual loss of cognitive functions causing slower reaction time, blurred speech, loss of consciousness, seizures, and ultimately death, as the hypoglycemia progresses. The electrical activity in the brain represents the metabolic state of the brain cells and can be measured by electroencephalography (EEG). An association between hypoglycemia and changes in the EEG has been demonstrated, although blood glucose levels alone do not seem to predict neuroglycopenia. This review provides an overview of the current literature regarding changes in the EEG during episodes of low blood glucose.
Hypoglycemia is usually defined by a blood glucose level below 70 mg/dL. As the glucose level drops, hormonal defense mechanisms, such as glucagon and epinephrine are normally activated, increasing the release of glucose from the liver and producing the typical hypoglycemic symptoms of, for example, sweating, tremor and dysphoria. 1 Spontaneous blood glucose values lower than 50 mg/dL may, however, frequently be measured in diabetes patients or following long-term fasting in healthy individuals with limited or no symptoms.1,2 Diabetes patients with a long diabetes duration or with tight glycemic control may experience recurrent episodes of hypoglycemia and lack typical warning symptoms even at very low glucose levels. 3 These patients are considered as having impaired awareness of hypoglycemia and are at increased risk of developing severe hypoglycemia.
The rat brain has been shown to store a supply of glucose in the form of glycogen. Insulin-induced hypoglycemia promotes a gradual glycogenolysis, and when plasma glucose levels are below 36 mg/dL, the brain glucose concentration is close to zero. 4 In the early stage, neuroglycopenia may be apparent only during systematic cognitive testing. As the blood glucose concentration falls, the cognitive function continues to decline, resulting in slower reaction time, blurred speech, loss of consciousness, seizures, and ultimately death. 1
The metabolic state of the brain cells can be measured by electroencephalography (EEG). EEG is traditionally measured on the scalp, using surface electrodes at specified locations in accordance with the international 10-20 system. 5 EEGs are often analyzed in the frequency domain, where signals are subjected to spectral analysis. For clinical purposes, EEG is subdivided into bandwidths denoted as beta (16-31 Hz), alpha (8-15 Hz), theta (4-7 Hz), and delta (<4 Hz), see Figure A1 and A2 in the appendix. Most of the cerebral signal observed in the scalp EEG falls in the range of 1-20 Hz.
Hypoglycemic episodes are associated with measurable changes in the EEG. Analysis of EEG changes as a predictor of severe hypoglycemia was proposed decades ago. 6 The clinical applicability of a hypoglycemia alarm device based on analysis of EEG changes is reliant on the extent, reproducibility and spatial location of the EEG changes, as well as the time from onset of EEG changes to cognitive decline. This review provides an overview of what is currently known about the hypoglycemia-induced changes in the EEG on these matters.
Study Selection
The electronic database MEDLINE was searched in 2013 using the search terms “Hypoglycemia and EEG.” The search was repeated in March 2016. Studies included for review were English language studies investigating the clinical effect of hypoglycemia on the background EEG. Both medically induced and noninduced episodes of hypoglycemia were eligible, but only studies recording EEG during episodes of low blood glucose were included. Study selection was conducted independently by the 2 authors. Figure 1 illustrates stages of the study selection process, leading to the review of 65 full texts, with 42 publications matching the selection criteria.
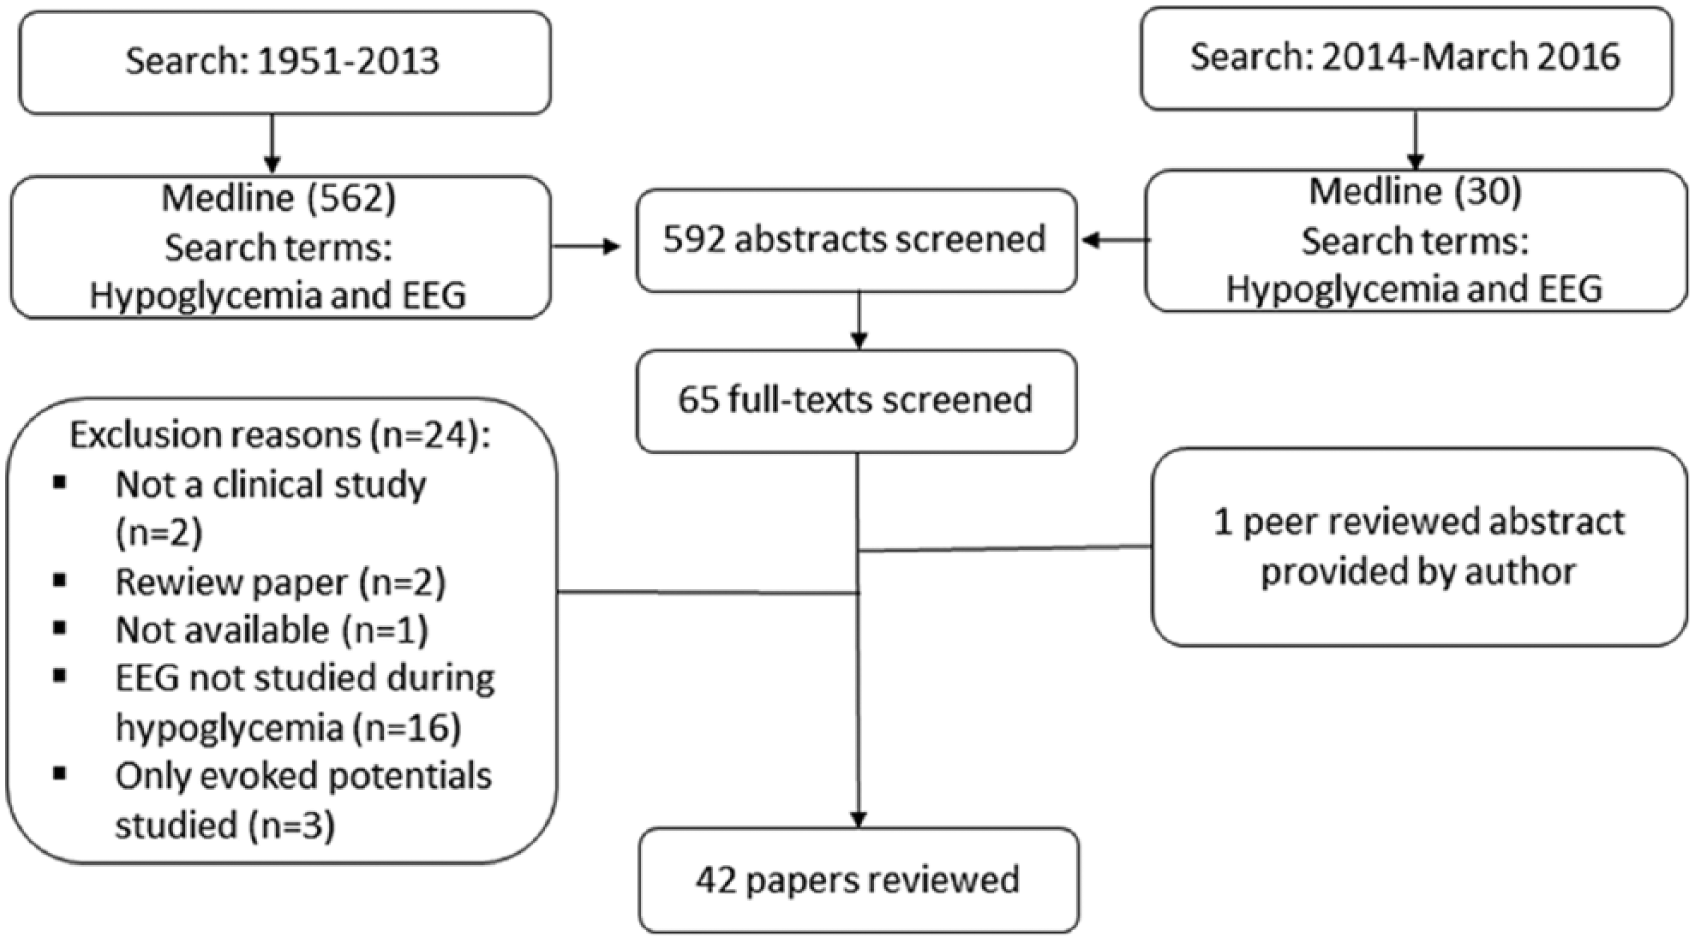
Search strategy and study selection.
EEG Parameters Affected by Hypoglycemia
Ross and Loeser 7 were the first to record EEG time series simultaneously with blood glucose levels back in 1951. This was followed by Regan and Browne-Mayers, 6 who observed a decrease in alpha frequencies and an increase in delta frequencies following insulin injection, with a gradual aggravation in the EEG changes as the hypoglycemia progressed—an association between hypoglycemia and changes in the EEG was demonstrated. Many others have since supported these observations (Table 1). An example of an EEG recorded during normoglycemia and hypoglycemia is shown in Figure 2.
Overview of Studies Investigating Hypoglycemia-Induced EEG Changes.
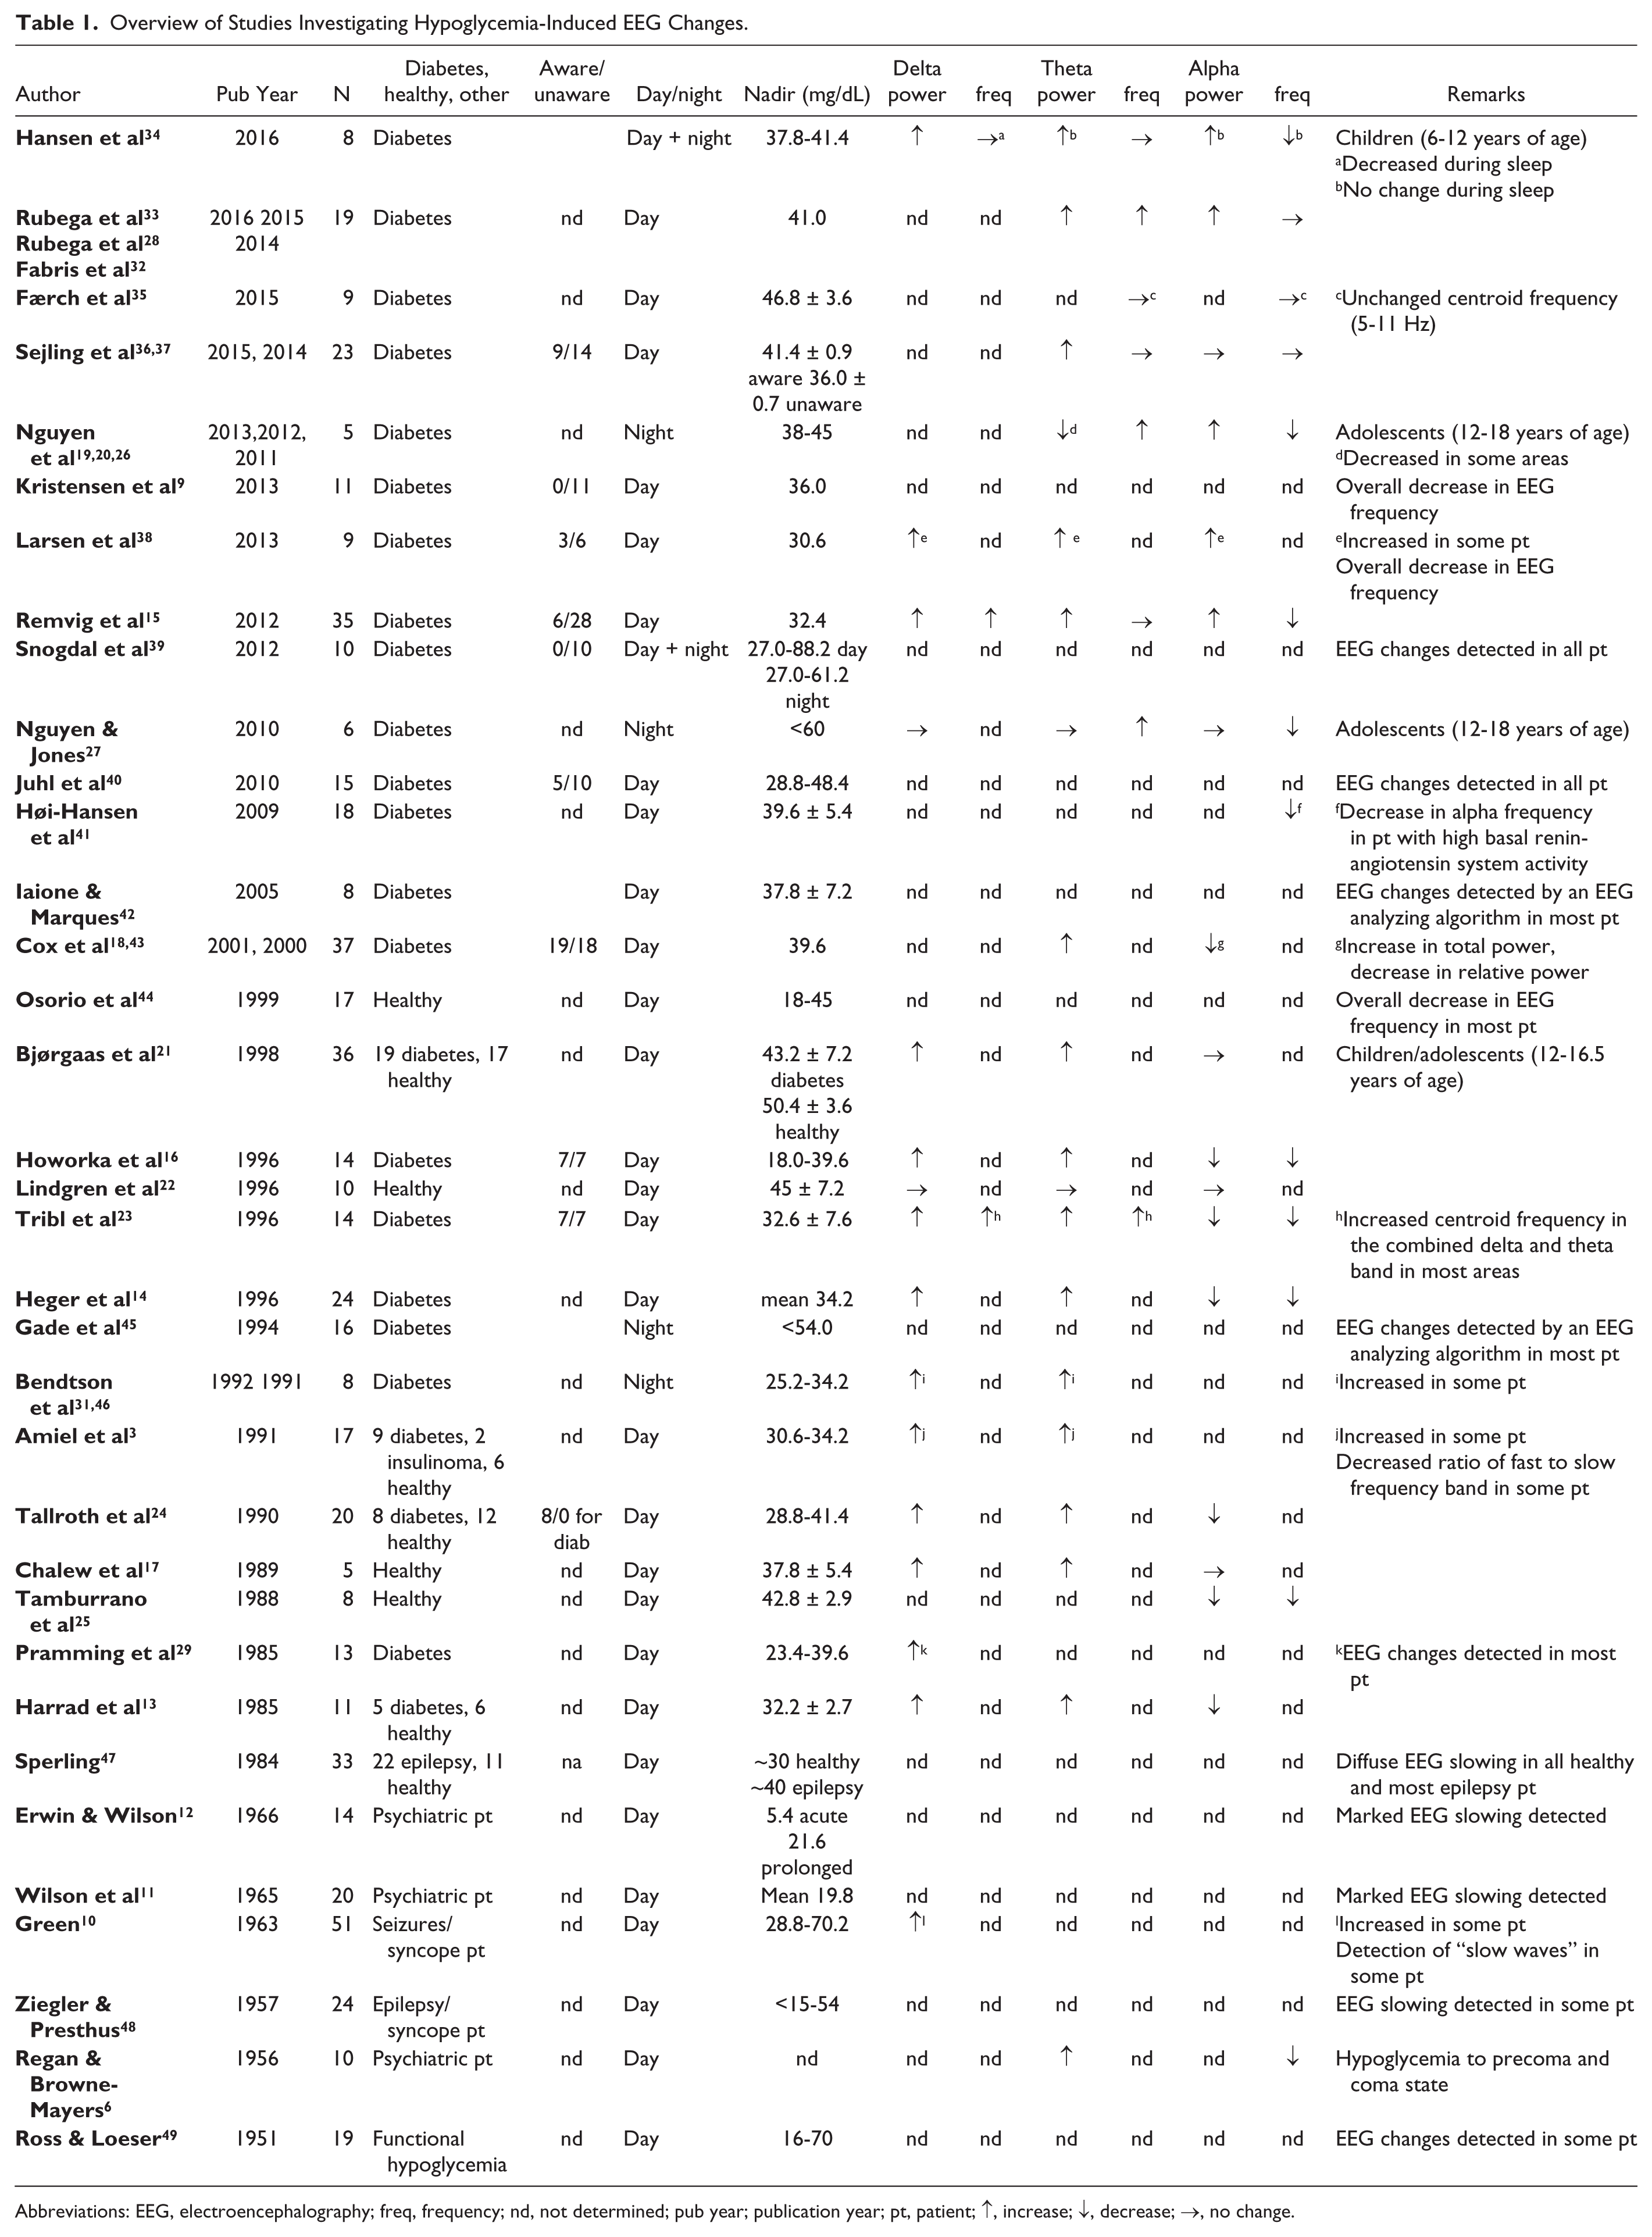
Abbreviations: EEG, electroencephalography; freq, frequency; nd, not determined; pub year; publication year; pt, patient; ↑, increase; ↓, decrease; →, no change.
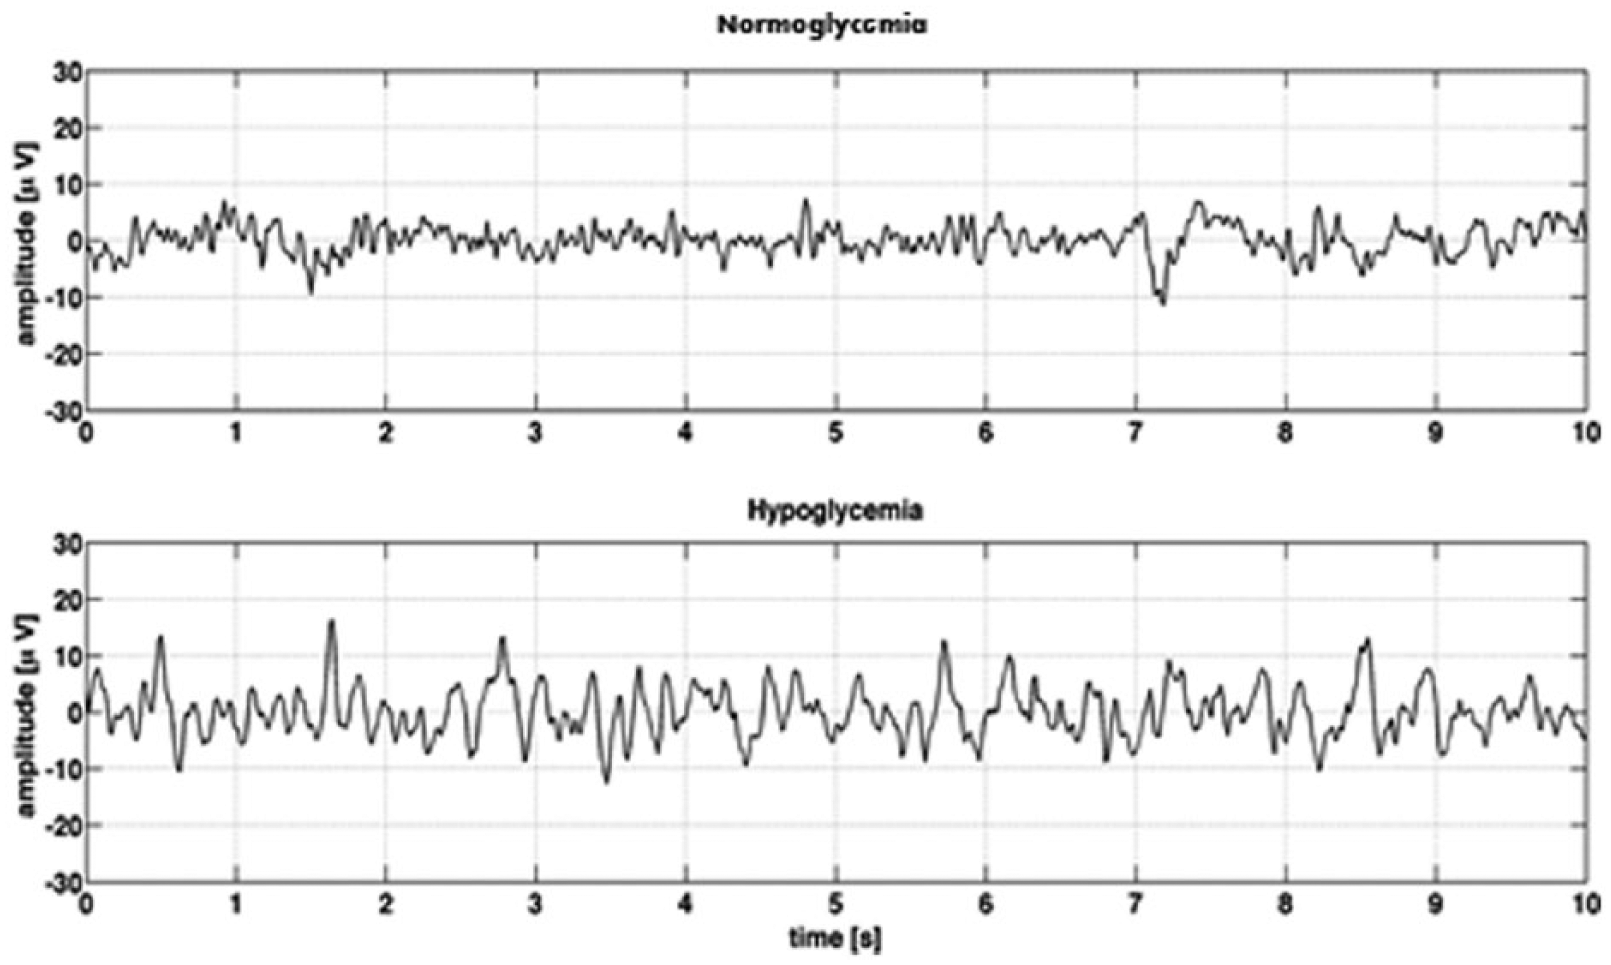
Examples of single channel EEG recordings during normoglycemia and hypoglycemia in the same person (daytime). The hypoglycemic EEG exhibits a lower frequency, which is more synchronized, leading to EEG of higher amplitude compared to the normoglycemic EEG. Adapted from Elsborg et al 8 with permission.
Overall, the earliest abnormalities seen in response to hypoglycemia is an increase in the total EEG power and a generalized slowing of the frequency.6,9-18 More specifically, an increase in the power of the delta band and theta band relative to the total power is observed at the expense of the relative power in the alpha band.3,6,13-17,19-25 The centroid frequency of theta is often increased, while the dominant alpha frequency or centroid frequency of alpha is reduced.15,19,20,25-28 This demonstrates that during the hypoglycemia onset, there is a power shift to the border area between alpha and theta band in the power spectra of EEG signals. 20 Hence, the alpha/theta ratio is a sensitive parameter for detecting changes in the EEG during hypoglycemia. 23 The generalized slowing is followed by abnormal spike changes3,10,29 and subsequent flattening of the EEG as the severity of hypoglycemia increases. 30 The changes in the EEG during hypoglycemia may not be identical in all patients, but they seem to be reproducible in each patient. 31
Until now, most studies investigating EEG in diabetes patients have been univariate assessing hypoglycemia-induced EEG changes using linear spectral analysis. Recently, new ways of analyzing data have revealed new EEG parameters that are affected by hypoglycemia. Analyzing EEG signal complexity using nonlinear signal processing techniques has demonstrated a decrease in complexity of EEG when a state of hypoglycemia is entered. 32 In addition, a decrease in the EEG coherence when passing from normoglycemia to hypoglycemia was observed by use of a multivariate model (ie, measuring synchronization between 2 signals in a multivariate data set).28,33
Hypoglycemia-Induced EEG Changes During Sleep
During sleep, the cerebral activity is increasingly synchronized. 50 The EEG is then characterized by occurrence of slow wave pattern similar to the changes seen during daytime hypoglycemia.31,39,46 Since hypoglycemia in the awake state induces EEG changes similar to deep sleep, nocturnal hypoglycemia might be difficult to separate from the deep sleep pattern. 46 Nevertheless, when comparing the EEG during sleep in the hypoglycemic state to the normoglycemic sleeping state in adults or adolescents, EEG changes compatible with hypoglycemia are detected irrespective of sleep stage, 39 that is, a decrease in the centroid alpha, an increase in the centroid theta frequency,19,20,26,27 and increased theta and delta activity. 31 This suggests that hypoglycemia-induced EEG changes overrule normal sleep patterns. As these changes are triggered at glucose levels similar to what is seen during daytime hypoglycemia, the brain seems equally sensitive toward changes in the blood glucose levels in the sleeping state.39,46
A greater mixture of waveforms and frequencies characterizes the EEGs of children, with the relative predominance of these wave types varying with age. In children (6-12 years of age), hypoglycemia during sleep is associated with a decrease in the centroid delta frequency and an increase or decrease in the absolute amplitude depending on the sleep stage. 34 An EEG-based algorithm capable of distinguishing EEG sleep pattern from hypoglycemia during sleep in the adult was unable to do so during sleep in children, emphasizing that hypoglycemia-induced EEG changes during sleep in children resemble deep sleep patterns more than in adults.34,39
Spatial Location of EEG Changes
Hypoglycemia-induced EEG changes have been reported in all cortical regions with no major interhemispheric asymmetry.11,20,23-25,29 Studies investigating a relatively mild hypoglycemia with blood glucose nadirs of ~43-54 mg/dL suggest that the anterior cerebral cortex is more sensitive to hypoglycemia than the posterior cortex.21,25 A topographic maximum of slow frequencies is found in the frontal cortex at glucose levels of 50-60 mg/dL. During more profound hypoglycemia (30-50 mg/dL reached within <1 h) there is a shift toward the posterior parts of the brain, 23 and overall changes in the EEG are most pronounced in parietal-occipital and temporal regions at blood glucose nadirs of 36 mg/dL (reached within 1 h). 29 This suggests that the topographical maximum for EEG changes may change depending of the degree of hypoglycemia. Still others have been unable to detect any regional differences in the EEG changes at blood glucose levels of ~32-36 mg/dL.3,31 In these studies, glucose nadir was reached more slowly (after 2-3.5 h). Whether a slow decline in blood glucose leads to more diffusely distributed EEG changes, perhaps due to the general lack of metabolic fuel, remains to be determined.
Glycemic Threshold for EEG Changes
According to Pramming et al 29 signs of cortical dysfunction appeared at a blood glucose concentration of 36 mg/dL, and normal EEG was reestablished when the blood glucose exceeded this threshold. Other studies have since reported hypoglycemia-induced EEG changes at various levels of blood glucose. Significant changes in the EEG have been observed at glucose levels as high as 60-72 mg/dL in children, adolescents or adults with diabetes.16,19,21,23 At the other extreme, glucose values may drop to 29 mg/dL before significant changes in the EEG are apparent. 3 There seems to be no correlation between the blood glucose concentration at the onset of EEG changes and age, duration of diabetes, hemoglobin A1c concentration, initial blood glucose concentration and rate of decline in blood glucose concentration.11,29,40,49 This suggests a highly individual critical glucose threshold for the onset of EEG changes. Clearly, glucose levels alone do not predict neurologic dysfunction. 44
EEG changes appear at a higher glucose level and are more pronounced in diabetes patients compared to healthy controls at the same hypoglycemic level.3,21,24 Furthermore, an association between hypoglycemia unawareness and an early shift toward lower frequencies has been reported during mild hypoglycemia,16,23 although unaware patients consistently did not show any clinical impairment. 16 In agreement with this, intensively treated diabetes patients and insulinoma patients developed EEG changes at an early stage during hypoglycemia. 3 This suggests a hierarchy with unaware diabetes patients being the most sensitive and healthy individuals the least sensitive toward changes in the blood glucose level. At more moderate levels of hypoglycemia, no difference is seen in hypoglycemia-induced EEG changes between aware and unaware patients.23,37
According to Cox et al 43 the mental alertness, as reflected by a difference in relative power in the alpha and theta frequency band, is unrelated to the detection of significant neuroglycopenic and neurogenic symptoms. The early changes in the EEG in unaware diabetes patients during mild hypoglycemia may be seen as a protective phenomenon that shifts the threshold for eventual cerebral energy failure in hypoglycemia to lower plasma glucose levels. Slowing of the EEG pattern is associated with a decrease in cerebral metabolic rate for glucose and precedes severe cerebral energy derangements in rats.51,52 In addition, patients with type 1 diabetes, in particular those with impaired awareness, seem better able to maintain cerebral metabolism during hypoglycemia than healthy controls. 53 A detailed discussion of the changes in the brain metabolism during hypoglycemia is beyond the scope of the present review but has recently been reviewed elsewhere. 53
The time from onset of EEG changes to cognitive deficit is of interest if EEG is to be used as a cerebral surveillance tool to prevent further progression of hypoglycemia. When Regan et al 6 induced hypoglycemia to a state of coma in psychiatric patients, EEG changes appeared 120 min before coma itself, at a time when the patients were often fully oriented. More subtle changes in vigilance were used to investigate this phenomenon in diabetic adults with a history of severe hypoglycemia or impaired awareness. Here, significant changes in the EEG appeared on average 29 min before serious signs of neuroglycopenia and adrenergic reactions (ranging from 3 to 113 min), 40 or 19 ± 3 min before major worsening of cognitive performance. 16 In children with diabetes, the EEG changes were detected on average 18 min before glucose nadir (ranging from 0 to 55 min). 34 Although large interindividual variation is seen, this suggests that the onset of EEG changes in general occurs before the cognitive function is severely affected.
The Extent of EEG Changes
Several studies have reported 1 or more individuals who did not experience significant EEG changes during hypoglycemia, - sometimes despite clear symptoms of hypoglycemia.22,29,44,47,54 Glucagon has been proposed as a defense mechanism, capable of protecting the brain against neuroglycopenia. This is based on studies showing absence of hypoglycemia-induced EEG changes during sleep in diabetes patients with a preserved counter-regulatory glucagon response.31,46 In support of this, a significant glucagon response was observed during daytime hypoglycemia in diabetes patients who did not exhibit any EEG changes. 41 These patients were however characterized by having a low basal renin-angiotensin activity, implying other or additional discrepancies in the signal processing.
A correlation between the glucagon response and hypoglycemia-induced EEG changes is challenged by other studies, reporting EEG changes irrespective of the existence of a counter-regulatory glucagon response in patients with diabetes and in healthy individuals.9,25,37,40 The glucose nadir in individuals without detectable EEG changes varies from 29-40 mg/dL.22,29,41,42,44,46,47 Taking the great interindividual variation into consideration, 1 explanation for the lack of detectable EEG changes could be that the glucose level has not been sufficiently low in these individuals. Nevertheless, Ziegler and Presthus 48 reported remaining alpha activity and limited slow activity in the 4-7 Hz frequency range at very low blood glucose level, less than 15 mg/dL in a patient with epilepsy. In this study, the centroid frequency was not investigated. In addition, some patients had abnormal EEG before insulin injection, which may have masked any hypoglycemia-induced changes. Overall, the slowing of the EEG during hypoglycemia appears to be a general phenomenon. It is seen in adults as well as in children,15,21,26,34 in diabetes patients and healthy individuals,22,24,25,44 and regardless of whether hypoglycemia is medicine-induced or not. 31
Reestablishment of EEG Pattern
Following insulin-induced hypoglycemia, glucose levels are typically restored in clinical studies by IV injection of glucose. During this recovery period, EEG reestablishes to pretreatment levels in diabetes patients as well as in nondiabetics.3,13,17,29 The glucose level at which the EEG slowing clears and the timing of clearance may vary between individuals just like the threshold for the onset of EEG changes.11,29 The EEG normalization has been reported to occur within 20-120 min after initiation of glucose infusion and often before plasma concentrations return to normoglycemic levels.19,24,29,44,46,47
Howorka et al 16 and Amiel et al 3 found that as plasma glucose levels increased, the restoration of initial values of slow waves in unaware patients occurred earlier and at lower glucose levels compared to hypoglycemia aware patients. Irrecoverable alterations in the EEG signals following hypoglycemia were suggested by Nguyen et al, 19 as reestablishment of the EEG did not happen consistently for all features in all patients 100 min after glucose induction. However, when assessing the acute effect of recent antecedent hypoglycemia on hypoglycemia-induced EEG changes, no difference in power or frequency distribution during hypoglycemia between the first and the second hypoglycemic episode was identified. 36
Conclusion
Although hypoglycemia is typically acknowledged based on blood glucose levels, the state of hypoglycemia becomes critical only once the brain experiences neuroglycopenia and brain functions fail. The EEG reflects the metabolic state of the brain, and changes in the EEG happen early in hypoglycemia. It is clear that the threshold for hypoglycemia-induced EEG changes varies between individuals. Whether it depends on cerebral glycogen levels, different rates of glucose transport into the brain cells, cerebral blood flow, or some other mechanism remains to be demonstrated. Despite this, hypoglycemia-induced EEG changes, such as an increase in overall power and a generalized slowing of cerebral activity, are seen symmetrically in all cerebral regions and occur irrespective of age, diabetes duration, awareness status, or antecedent episodes of hypoglycemia.
Footnotes
Appendix
Acknowledgements
Abbreviations
EEG, electroencephalography; h, hour.
Declaration of Conflicting Interests
The author(s) declared the following potential conflicts of interest with respect to the research, authorship, and/or publication of this article: The authors have a competing interest to declare. LB is full-time employed at HYPOSAFE A/S. CBJ receives a consultant fee from HYPOSAFE A/S.
Funding
The author(s) received no financial support for the research, authorship, and/or publication of this article.