
Abstract
Background:
Tight glycemic control in type 1 diabetes mellitus (T1DM) may be accomplished only if severe hypoglycemia can be prevented. Biosensor alarms based on the body's reactions to hypoglycemia have been suggested. In the present study, we analyzed three lead electrocardiogram (ECG) and single-channel electroencephalogram (EEG) in T1DM patients during hypoglycemia.
Materials and Methods:
Electrocardiogram and EEG recordings during insulin-induced hypoglycemia in nine patients were used to assess the presence of ECG changes by heart rate, and estimates of QT interval (QTc) and time from top of T wave to end of T wave corrected for heartbeat interval and EEG changes by extraction of the power of the signal in the delta, theta, and alpha bands. These six features were assessed continuously to determine the time between changes and severe hypoglycemia.
Results:
QT interval changes and EEG theta power changes were detected in six and eight out of nine subjects, respectively. Rate of false positive calculations was one out of nine subjects for QTc and none for EEG theta power. Detection time medians (i.e., time from significant changes to termination of experiments) was 13 and 8 min for the EEG theta power and QTc feature, respectively, with no significant difference (p = .25).
Conclusions:
Severe hypoglycemia is preceded by changes in both ECG and EEG features in most cases. Electroencephalogram theta power may be superior with respect to timing, sensitivity, and specificity of severe hypoglycemia detection. A multiparameter algorithm that combines data from different biosensors might be considered.
Introduction
The risk of severe hypoglycemia remains a threat in insulin-treated diabetes. Not only does hypoglycemia impose a risk of glycemic dysregulation and a fear of hypoglycemia, 1 it also directly affects organ function, in particular, the brain and the heart. Neuroglycopenia results in a gradual and glucose-dependent cognitive decline along with a shift toward an electroencephalogram (EEG) that is dominated by slower frequencies. Effects on the heart include tachycardia related to the release of catecholamine and a prolongation of the QT interval (QTc).2,3 The latter has been associated with death in type 1 diabetes mellitus (T1DM). 4 In a study where concomitant electrocardiogram (ECG) recording and glucose measurement were conducted, nocturnal hypoglycemia was observed in 26% of the nights. Corrected QTc was longer during hypoglycemia compared with normoglycemic periods, and cardiac rate and rhythm disturbances, including sinus bradycardia (<40 beats/min) and ventricular ectopic beats, were seen in 62% of nocturnal hypoglycemia episodes. 5 Effects on cardiac function may arise either from direct effects of hypoglycemia on the myocardium and the heart electrical conductive system or from effects of the increased release of counter-regulatory hormones, primarily catecholamines. The latter is substantiated by a lag time between hypoglycemia and QT aberrations 6 and the fact that the magnitude of adrenaline release was correlated to the QTc changes. 7
The primary objective of the present study was to assess the effect of insulin-induced hypoglycemia on the EEG in T1DM patients. These results have been published. We found that hypoglycemia-associated EEG changes occurred in the majority of patients even before cognitive changes. 8 For safety reasons, ECG was also recorded in the study. This gave us the opportunity to correlate the EEG and the ECG findings during induced hypoglycemia. This is the topic of this article.
Methods
The study was approved by the local ethics committee and followed the Declaration of Helsinki. Fifteen patients with T1DM were enrolled from the outpatient clinic at the Department of Endocrinology, Odense University Hospital. Patients with a history of ischemic or conductive heart disease, epilepsy, and structural brain disease were excluded. Accordingly, no patient received any drugs with effects on the cerebral or cardiac function. The patients arrived in the clinic in a nonfasting state. The participants were placed in an armchair. Cup electrodes were placed according to the 10/20 system of electrode placement at positions T3-P3 or T4-P4. Left- or right-side EEG derivations were chosen depending on which recording had the lowest noise level. Electrocardiogram was recorded from three electrodes placed at each shoulder and over the siphoid process. To induce hypoglycemia, 50 IU of Actrapid® (Novo Nordisk, Bagsværd, Denmark) were added to 489.5 ml of 9% saline solution (Baxter NaCL isotonic) and 10 ml of the participant's blood. The initial infusion rate depended on the blood glucose level at the start of the experiment and was subsequently adjusted to achieve a steady fall in plasma glucose of 1.0 mmol/liter per 15 min. Venous plasma glucose was measured every 5 min by ABL-705 (Radiometer Denmark, Brønshøj, Denmark). The experiment was terminated when the blood glucose level was lower than 1.7 mmol/liter by two consecutive measurements, when the patient showed obvious signs of hypoglycemia, or when for any other reason the patient or investigator requested the experiment to stop. Intravenous glucose 20% (Baxter 200g/liter glucose) was subsequently infused via peripheral vein catheter.
Because ECG recordings were not the primary object of the original study, focus on placing ECG electrodes appropriately was neglected in some experiments. This resulted in less than optimal ECG signal quality, and for this reason, 6 of 15 test subjects were excluded from the current study.
Procedures for Electrocardiogram Analysis
Three different features were extracted from the ECG signals: the heart rate (HR), the interval from the beginning of the QRS complex to the end of the T wave (QT), and time from top of T wave to end of T wave (TpTe). 9 Bazett's formula was used to calculate QTc = QT/√RR and TpTec = TpTe/√RR, where RR is 60/HR. All ECG features were detected by an automated method. The ECG data were processed in epochs of 1 min duration with 75% overlap between epochs.
An averaged heartbeat was constructed for each epoch using a template matching scheme,10,11 where at least 10 beats, all with a correlation coefficient above 99% with the template, contributed to the averaged heartbeat.
The averaged heartbeat of a single epoch was used for estimating the ECG features. The end of the T wave was determined using the tangent method. 12 The beginning of the QRS complex was estimated with a similar approach, where the onset of the QRS complex was taken as the point of interception between the isoelectric line and the tangent with the steepest upward slope of the R peak. The peak of the T wave was determined by the maximum point of the averaged heartbeat's T wave. Finally, the RR interval was computed as the mean of time intervals between all R peaks in the ECG epoch and used to compute HR and make heartbeat interval corrections of QTc and TpTec.
Because all features of the ECG were extracted by an automated method, a portion of the extracted features was found to be erroneous due to the automated method's misinterpretation of the averaged heartbeats. A simple procedure to remove improbable feature values was introduced, where feature values with a larger change than a predefined limit (15 ms for QTc and TpTec and 3 bpm for HR) from one epoch to the next were removed from the feature set. The removal procedure resulted in an average removal of 17% for the QTc feature, 43% for the TpTec feature, and 6% for the HR feature. A smaller predefined limit for the TpTec feature could have been applied, but due to the very high removal rate for the TpTec feature, the same limit as for the QTc feature was maintained. The high removal rate for the TpTec feature was due to a high uncertainty of the automated procedure's ability to identify the peak of the T wave.
Procedures for Electroencephalogram Analysis
Three EEG features were extracted from the EEG signals all based on the spectral content of the signals. Average power estimates of three EEG bands were extracted using Welch's averaged modified periodogram method. 13 The three bands were the delta band (1–4 Hz), the theta band (4–8 Hz), and the alpha band (8–13 Hz). Power estimates were computed continuously for 4 s epochs, with 75% overlap between epochs. For further details, see the works of Elsborg and coauthors 14 and Juhl and coauthors. 8 To ensure that the EEG features were normally distributed (relevant for the later detection of hypoglycemia described in the following subsection), the power estimates were squared and log transformed.
Detection of Hypoglycemia in the Electroencephalogram and Electrocardiogram
Detection of hypoglycemia was based on a comparison between moving averages of the six ECG and EEG features and the mean and standard deviation of these features in a selected baseline period after verifying normal distribution of all features. The baseline period was selected as 30 min of continuous recordings where the blood glucose was above 3.5 mmol/liter. The moving averages of each feature were computed as the mean of the feature in a backward-looking rectangular window with a duration of 5 min.
The moving averages were compared with the baseline periods of corresponding ECG/EEG features in the following way. All ECG and EEG features were expected to increase during hypoglycemia. Therefore, as long as the moving average value was less than the mean of the baseline period plus two standard deviations, hypoglycemia was not considered to be detected. If, however, the moving average exceeded the mean of the baseline period plus two standard deviations, hypoglycemia was considered to be significantly different from the baseline period and thus detected at that time. If hypoglycemia was detected at a time where the latest blood glucose measurement was equal to or below 3.5 mmol/liter, the hypoglycemia detection was considered to be true. Otherwise, if the threshold was exceeded when the latest blood glucose measurement was above 3.5 mmol/liter, the detection was considered a false positive detection. The time of hypoglycemia detection to termination of the experiment was recorded for each feature individually. No combinations of features were considered in the study.
Results
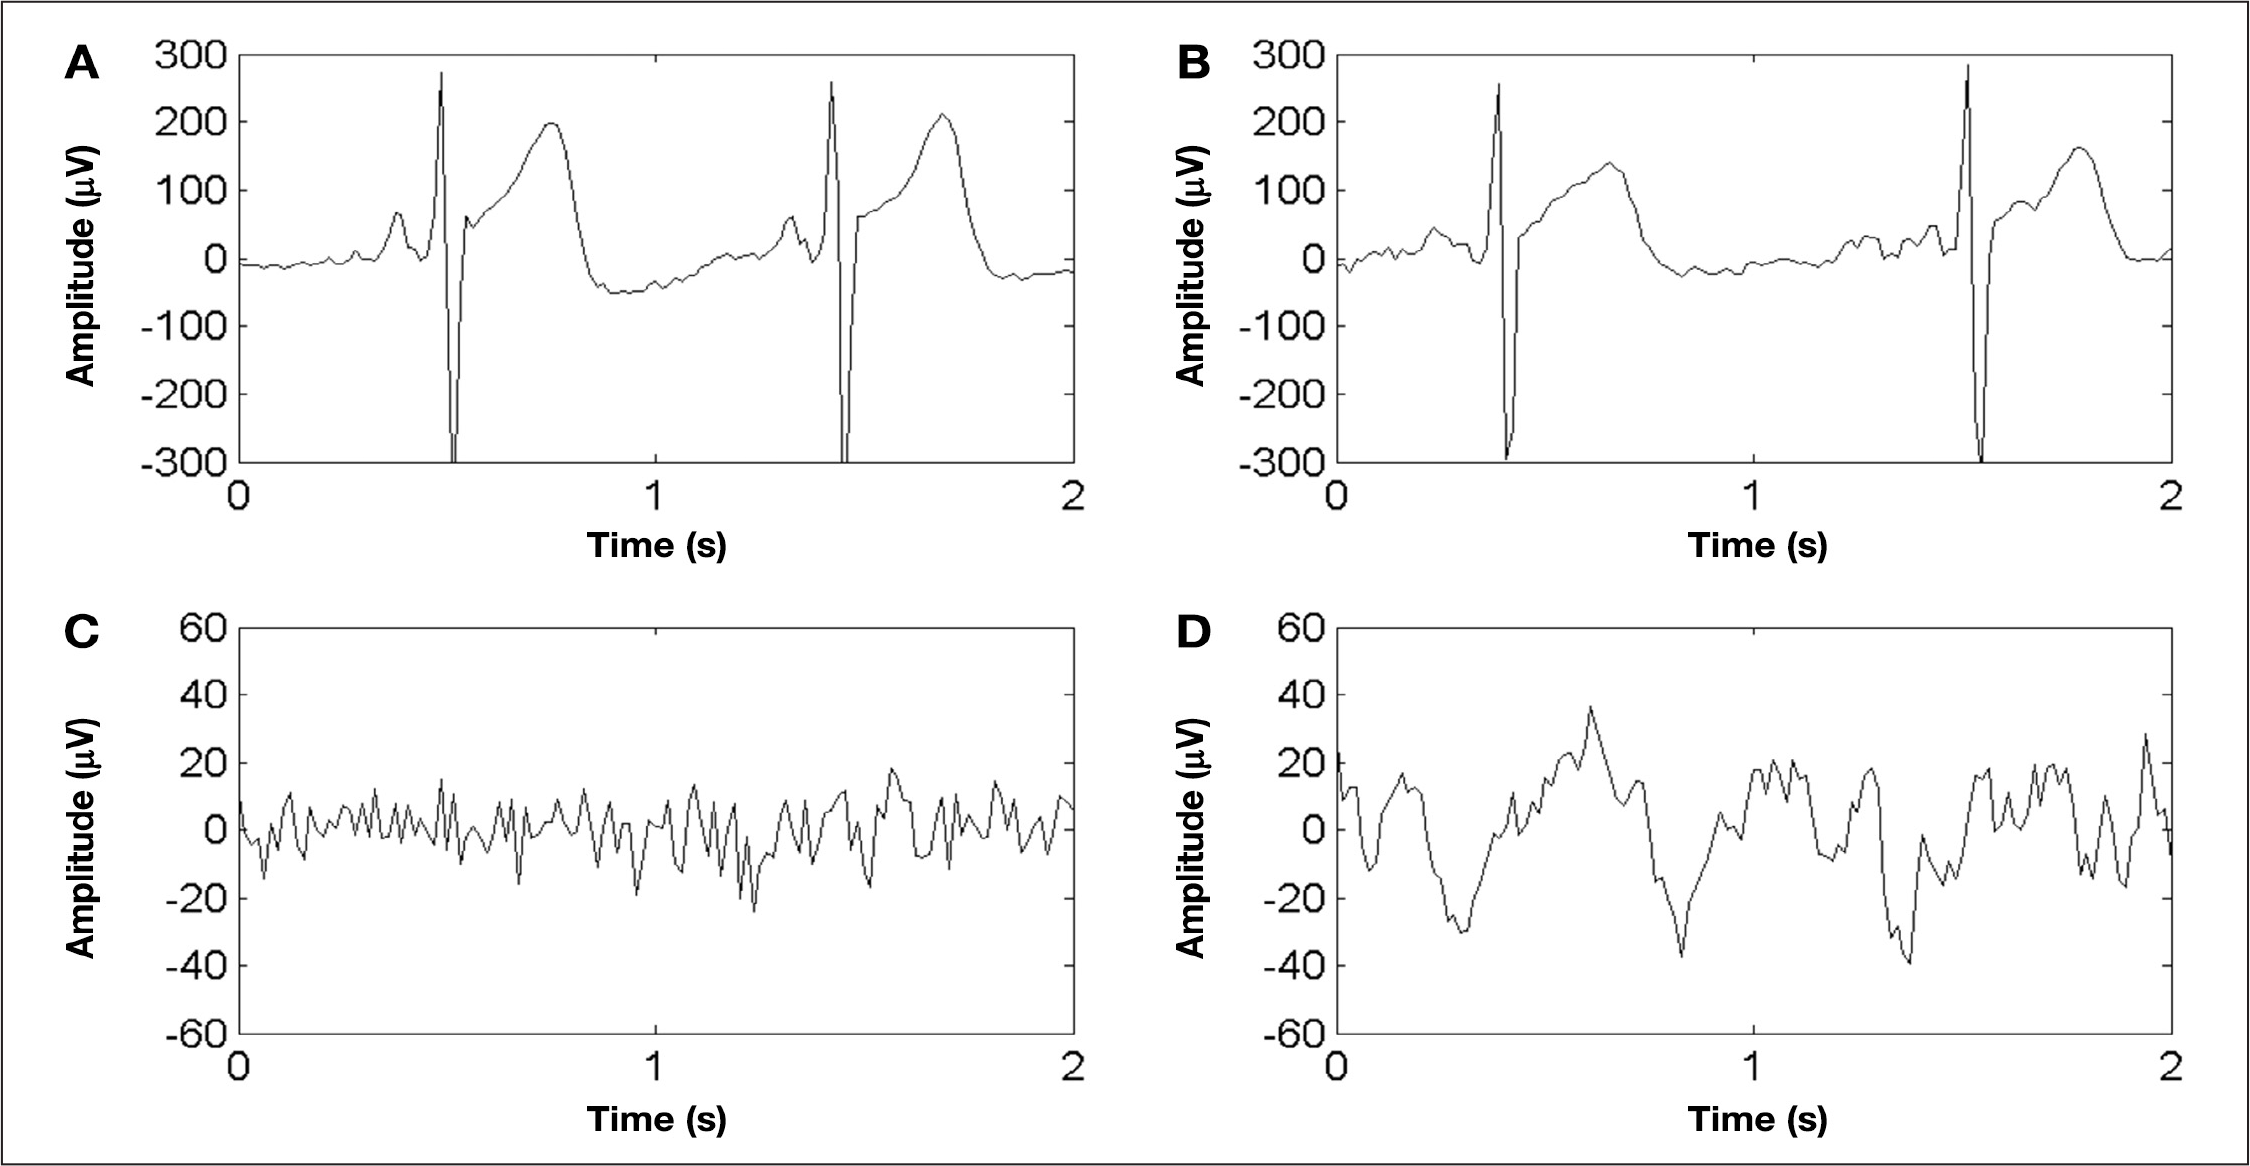
Representative examples of (
Patient Characteristics
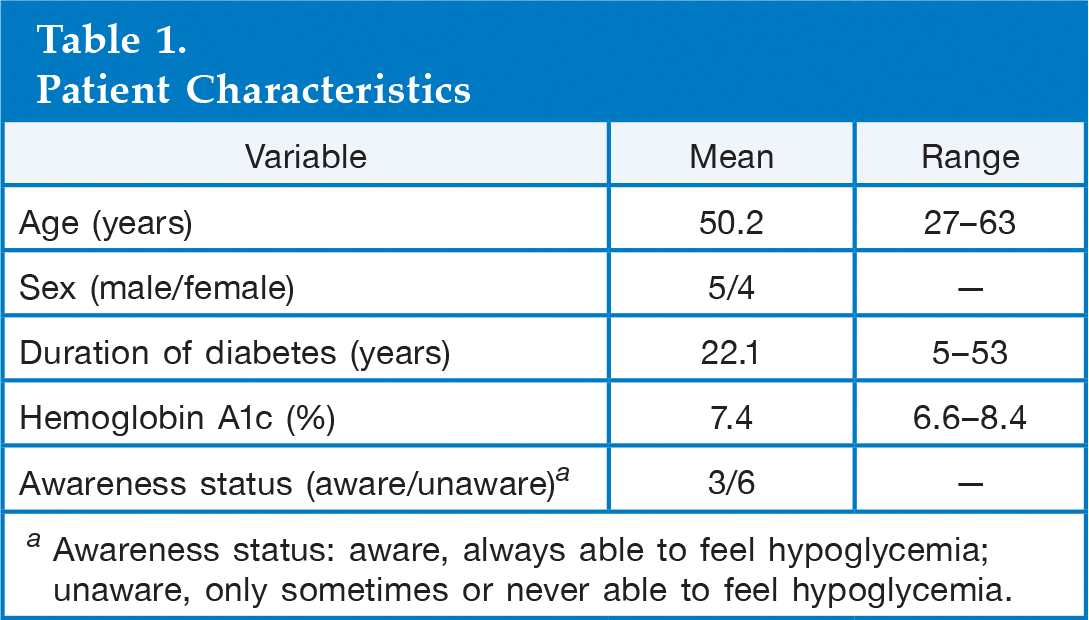
Awareness status: aware, always able to feel hypoglycemia; unaware, only sometimes or never able to feel hypoglycemia.
For the ECG recordings, a flattening and slight prolongation of the T wave is seen during hypoglycemia (B) compared with euglycemia (A), which, when analyzed by the automated tangent method, results in an increase in the QTc and TpTec. For the EEG recordings, a decrease in frequency and increase in amplitude is seen during hypoglycemia (D) compared with euglycemia (C).
The results of the hypoglycemia detection are listed in
Hypoglycemia Detection Performance Measures of Electrocardiogram and Electroencephalogram Features a
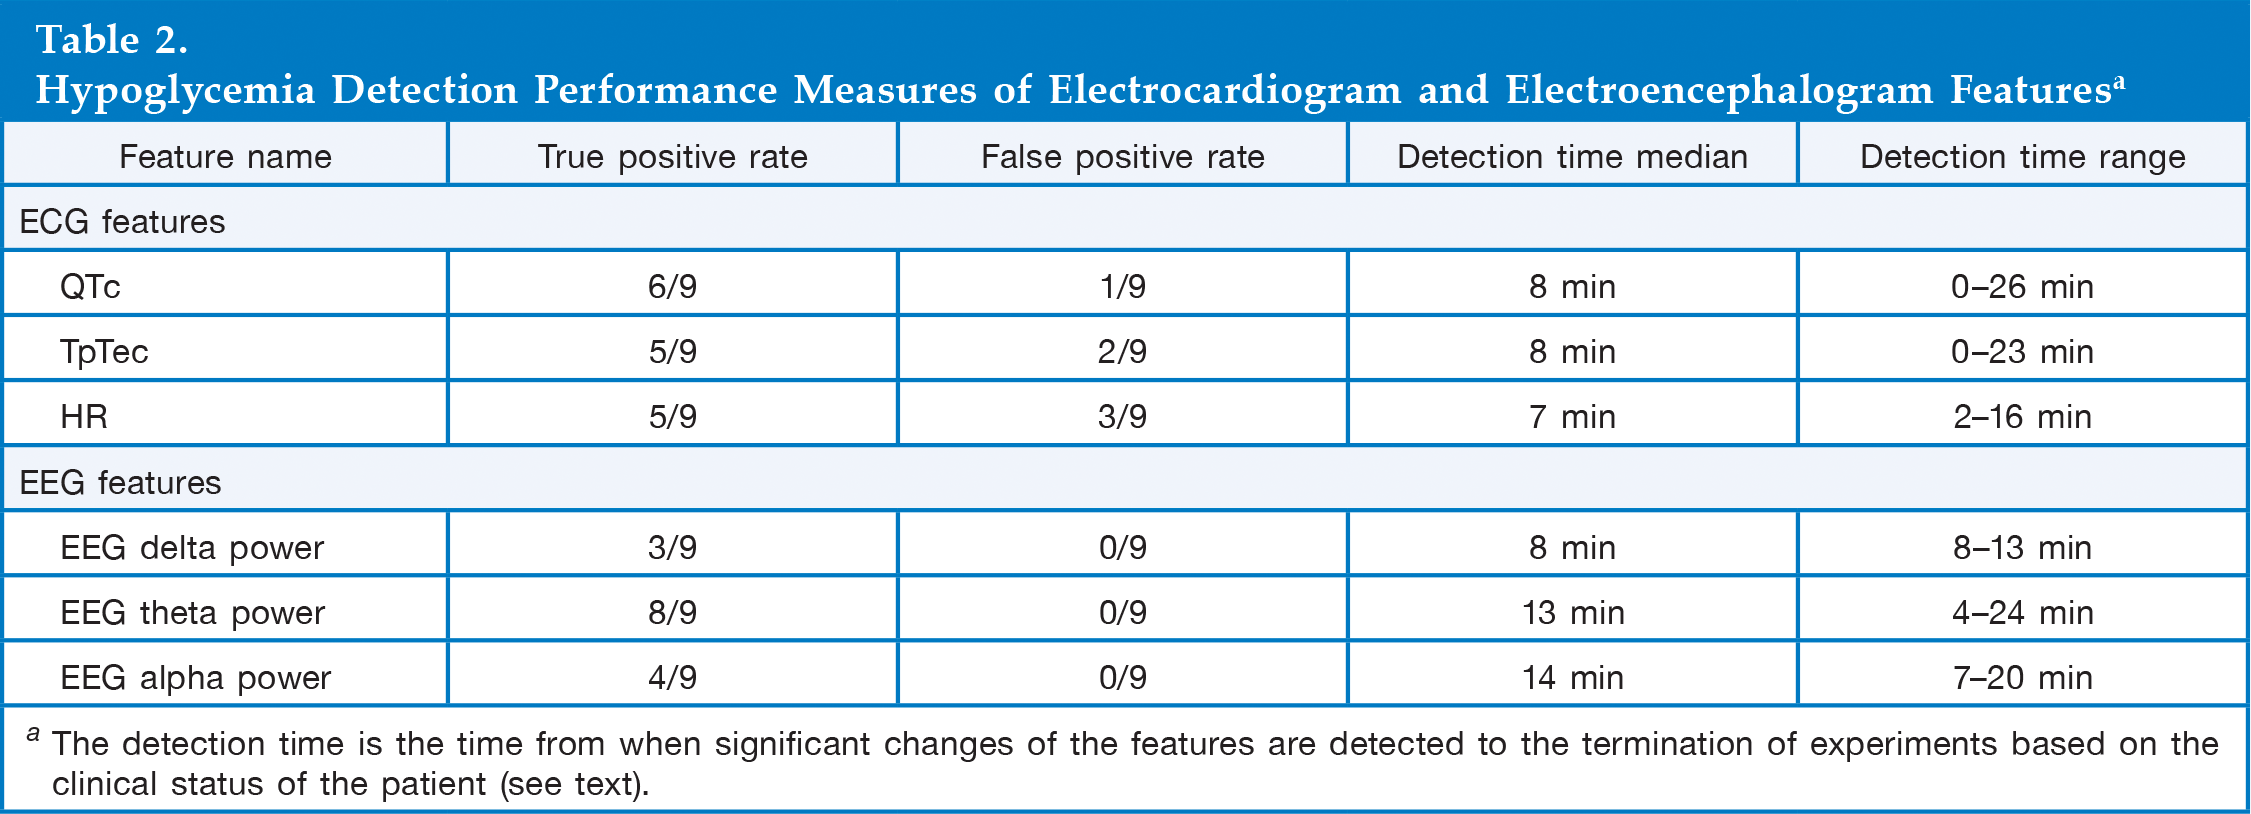
The detection time is the time from when significant changes of the features are detected to the termination of experiments based on the clinical status of the patient (see text).
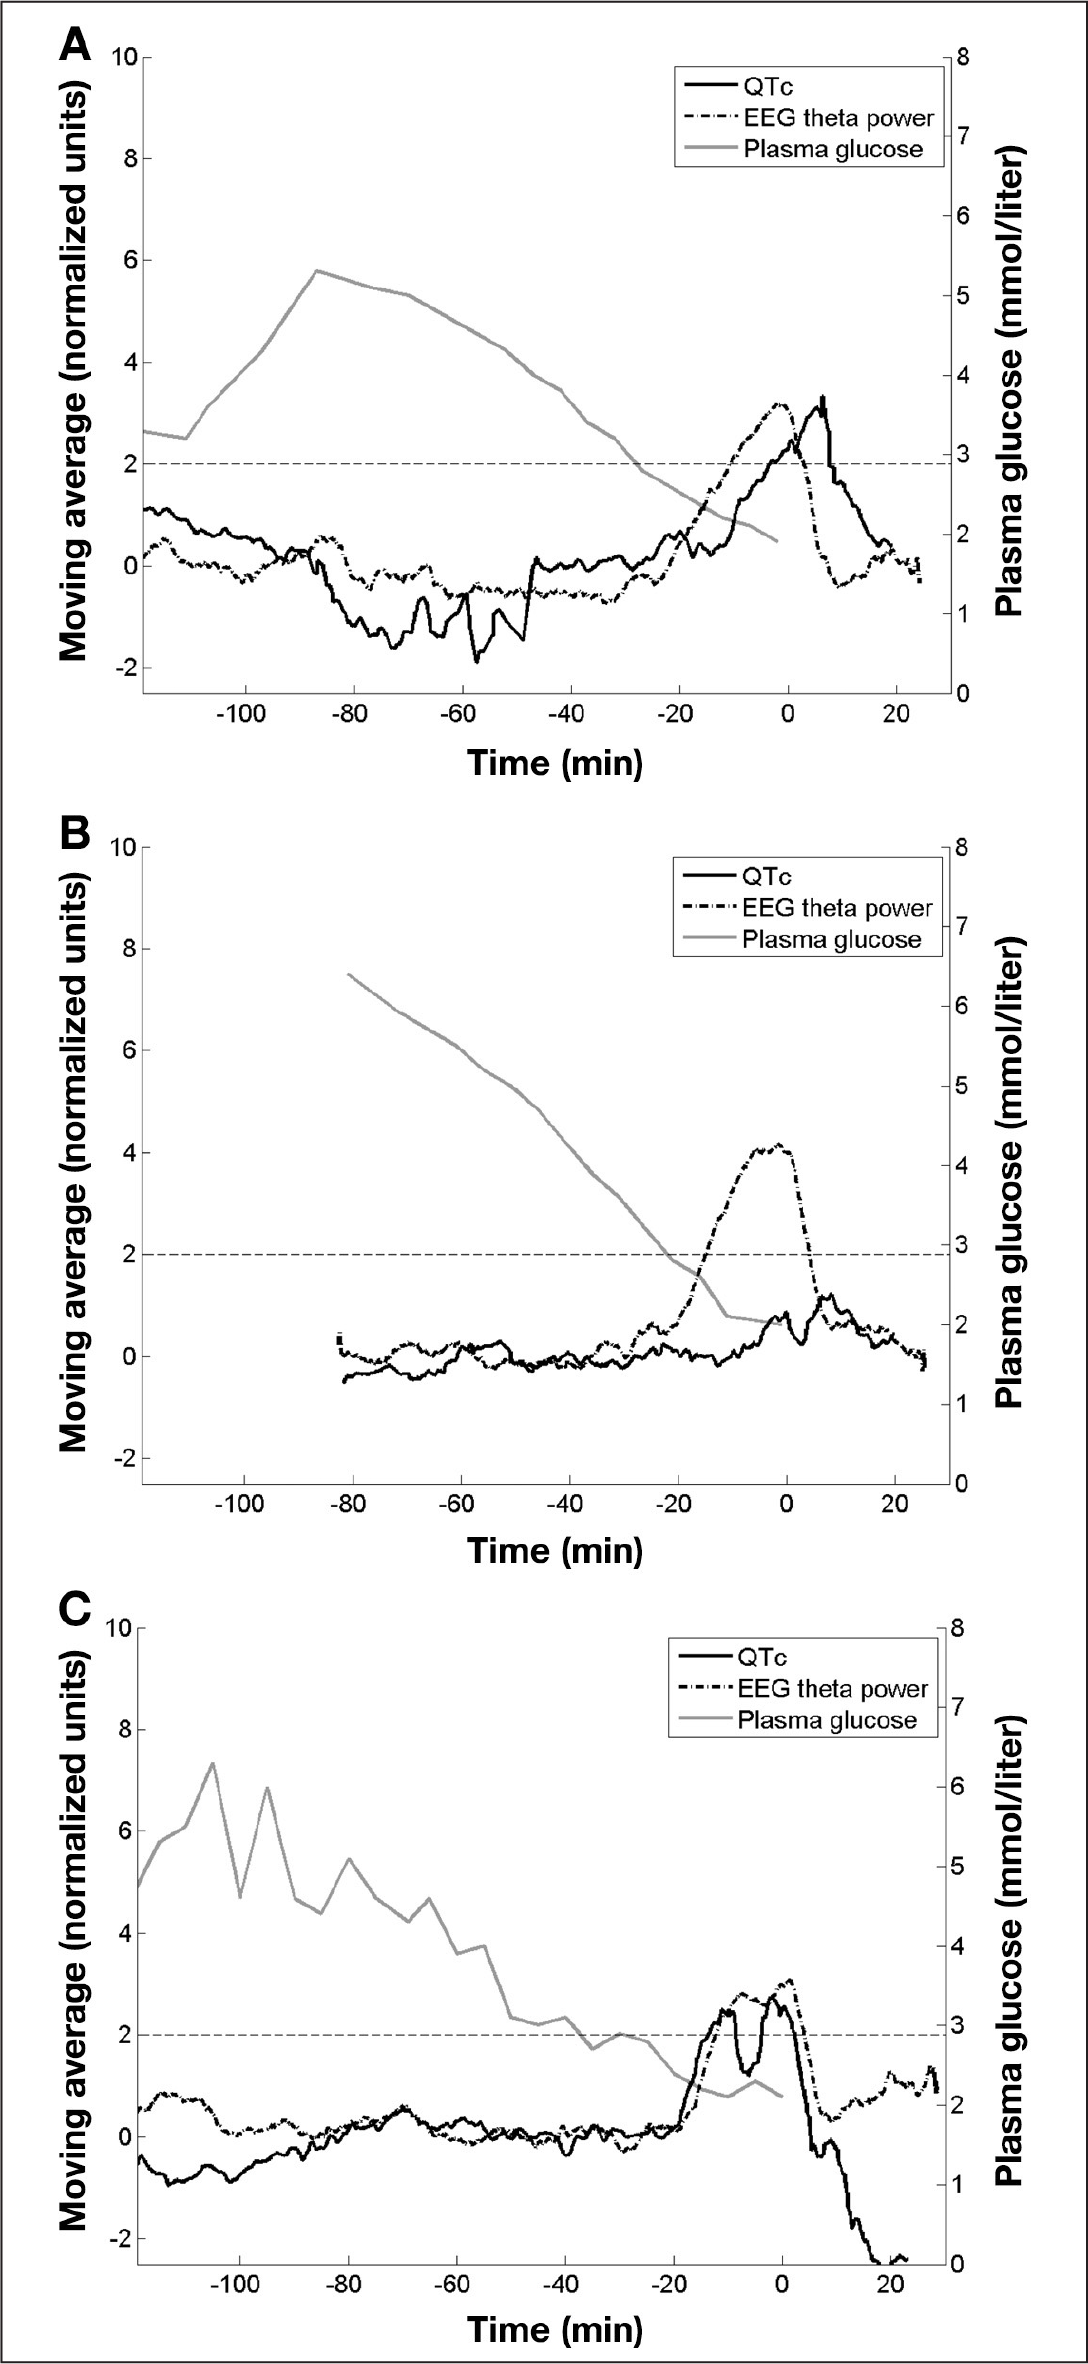
Three representative examples of experiments showing the features with the highest detection rates (QTc for ECG and theta power for EEG): plasma glucose (gray curve), moving average of QTc feature (black solid curve), moving average of EEG theta power feature (black dash-dot curve), and predefined threshold at two normalized units (horizontal thin black dotted curve). The moving average curves have been normalized by subtraction by the mean of the baseline periods followed by division with the standard deviation. Time 0 denotes the termination of the insulin infusion and start of glucose infusion.
Discussion
Despite the use of fast-acting insulin analogs, insulin pumps, and intermittent and continuous glucose measurement, it is not possible to mimic the complex interplay between glucose concentration and insulin secretion dynamics in humans. This will, unavoidably, lead to either poor glycemic control or frequent events of hypoglycemia. This fact calls upon solutions that enable tight glycemic control without increasing the risk of hypoglycemia. In particular, events of severe hypoglycemia must be avoided, acknowledging the devastating effects of neuroglycopenia and the risk of hypoglycemia-associated cardiac arrhythmia.
Different types of biosensor concepts based on the body's reaction to hypoglycemia have been explored. A biosensor-based hypoglycemia alarm is a technological device that records the reaction of the body to hypoglycemia and converts this into a signal that warns the patient in case of impending severe hypoglycemia. It is of utmost importance that a biosensor alarm is based on physiological features that occur unanimously.
Early biosensor concepts were based on increased skin conductance during hypoglycemia. This concept relies on sweating as a reaction to hypoglycemia and thus requires an intact autonomic nervous system. A fair sensitivity of 91% was achieved, but the specificity turned out very low,15,16 and the sensitivity will presumably be reduced in patients with hypoglycemia-associated autonomic failure. 17 In fact, patients predisposed to events of severe hypoglycemia will often also be the patients with reduced autonomic response, 17 making a skin-conductance-based alarm less attractive.
It is well described that the features of the ECG change during hypoglycemia.6,9,18–20 These changes include a general slowing of the conduction, as quantified by prolonged QTc and prolonged TpTec. This relates directly to an apparent risk of hypoglycemia-related cardiac arrhythmia 2 and may constitute a possible basis for a hypoglycemia alarm. In previous studies, a fair sensitivity and specificity has been achieved applying continuous and automated ECG analysis. 9 A potential shortcoming may be the fact that a number of other factors affect ECG features. These include drugs commonly used by diabetes patients such as many antihypertensive agents (angiotensin-converting-enzyme inhibitors 21 and beta blocking agents 22 ), drugs for congestive heart disease such as digoxine 23 (which reduces the QTc), and, importantly, also the hypoglycemia-associated autonomic failure per se (which includes reduced or abolished release of catecholamine). 3 This might be the reason that T1DM patients with late diabetes complications display less ECG changes at comparable glucose levels when compared with healthy subjects and T1DM patients without complications. 18 This is in line with our data showing that three out of nine patients who did not display ECG changes during hypoglycemia suffered from impaired awareness of hypoglycemia, although the small study size does not allow statistical conclusions to be made.
We have proposed the use of EEG as the biosensor for hypoglycemia detection.8,24 This is based on a general slowing of the EEG during hypoglycemia. We have developed a multiparameter algorithm, which can differentiate between normoglycemia and hypoglycemia with high sensitivity and specificity. Due to the explorative nature of this present analysis of data, we have, however, not applied the full EEG algorithm to the data but simply analyzed the data by quantitative EEG analysis, subdividing the EEG spectrum into the classical frequency bands. It is well-known that the alpha activity decreases and the theta activity increases during hypoglycemia in humans. 25 The present analyses confirmed the general slowing of the EEG and suggest that changes of theta activity may constitute the most sensitive measure of hypoglycemia. Increased theta activity during hypoglycemia was apparent in all subjects, and in eight out of nine subjects, it was significantly different from the normoglycemic period.
To allow a direct and unprejudiced comparison between the changes in the ECG and the EEG, we related the most sensitive from each measure (QTc derived from the ECG and power spectrum of the theta band derived from the EEG) and defined significant changes as a moving average of the defined variable being more than two standard deviations from the baseline, euglycemic period. By this method, both the significance and the timing of the changes could be defined. As expected, hypoglycemia affected both parameters in the majority of the cases. Changes in the EEG preceded changes in the ECG or lack of changes in ECG in six out of nine cases, while the opposite was the case in three cases. Importantly, no events of false alarms were apparent using EEG-based analyses.
From a usability point of view, ECG may be easier to achieve than EEG. Full EEG recording from cutaneous electrodes is obviously not applicable for continuous recording, while electrodes for three lead ECGs may be more acceptable. A miniaturized EEG recorder based on few leads may be suitable for long-term recording, and a sensor relying on combined information from both EEG and ECG recordings may be beneficial. This study was not designed to investigate combinations of EEG and ECG findings, and the small study size does not allow us to make any conclusions about combining the signals. It is, however, worth noticing that a combination of ECG and EEG detections would have resulted in hypoglycemia detections in nine out of nine experiments in this study.
Conclusions
Hypoglycemia-associated changes can be detected in both ECG and EEG in T1DM. The current data support the use of a biosensor for hypoglycemia detection. Further clinical studies will define its value in everyday use.
Footnotes
Abbreviations:
The study was initiated and fully sponsored by Hyposafe.
Claus Juhl, Rasmus Elsborg, and Anine Larsen are employees of Hyposafe.