
Abstract
Patients managing type 1 diabetes have access to new technologies to assist in management. This manuscript has two aims: 1) to briefly review the literature on diabetes technology use and how this relates to psychological factors and 2) to present an example of human factors research using our data to examine psychological factors associated with technology use. Device/technology uptake and use has increased over the years and at present day is a common clinical practice. There are mixed results in terms of health and psychosocial outcomes, with specific subgroups doing better than others with technology. Our data demonstrated that patients have moderately elevated diabetes distress across differing types of technology used, from low-tech to high-tech options, possibly meaning that technology does not add or take away distress. In addition, users on multiple daily injections compared to all other technology groups have less positive attitudes about technology. Finally, we discuss implications for clinical practice and future research.
Keywords
Diabetes treatments have increased in their technological complexity. Regimens to manage type 1 diabetes (T1D) can involve various combinations of diabetes devices and tools, ranging from simple systems, such as multiple daily injections (MDI) paired with a blood glucose meter (BGM), to more complex regimens including insulin pump therapy (pump therapy) and continuous glucose monitors (CGM), to systems that partially integrate these devices as in sensor-augmented pump (SAP) therapies. There is now sufficient research to conclude that diabetes technologies provide added benefits to many patients.1-3 However, many patients decline devices, use them inconsistently, or discontinue use altogether, thus raising the question of what affects interest in, or satisfaction with, these technologies. To deepen understanding of these issues, it is necessary to incorporate human factors assessments into device studies and clinical trials. This article reviews personal and psychological factors in the uptake and use rates of the insulin pump, CGM, and SAP, and presents data on users’ versus nonusers’ technology attitudes and diabetes-related distress levels.
Personal and Psychological Factors Related to Use
Search Strategy
We performed an electronic database search of the medical literature to assess current empirical knowledge about how the use of diabetes technologies relates to patient characteristics, satisfaction, and psychological adjustment. Boolean searches combined diabetes technology terms (eg, “insulin pump,” “continuous glucose monitor,” “sensor-augmented pump”) with terms related to human factors (eg, “quality of life,” “satisfaction,” and “uptake”). We also searched review articles examining health outcomes with diabetes devices for details about psychological outcomes or reasons for nonuse. We reviewed article reference lists to find additional sources.
Rates of Use of Technology
Insulin pump therapy has been used since the late 1970s and use depends on the population that is examined. 4 The United States has the greatest prevalence of pump usage - between 40%-62% of adults with T1D - while in Europe, rates fall between less than 5% to greater than 15%.5-9 Across the United States and Europe, less than 50% of young patients use pump therapy, ranging from 47% in the United States to 14%-41% in Europe. 10 Among children and adolescents in Europe, younger children (<6 years) most frequently report using pump therapy, whereas in the United States, adolescents most frequently report using pump therapy. 10
The concept of CGMs, like pump therapy, has been described for decades. 11 However, this technology has only been commercially available since 1999 when the Medtronic MiniMed Continuous Glucose Monitoring System was approved (Medtronic MiniMed, Northridge, CA, USA). There are fewer international studies reporting on CGM usage; however, within T1D Exchange Clinic Registry in the United States, 21% of individuals above age 25 and 4-6% of individuals under 25 use CGM.8,12 Overall, rates of CGM use across adult and youth participants is 7% of patients with T1D. 9 In randomized control trials of CGM use, adolescents use CGM for fewer days than adult participants. 13 In fact, even in clinical research it is challenging to get children and adolescents to use CGM. A 12-month study of CGM use in children and teens (8-17 years old) found that the majority of study participants used CGM fewer than 6 days/week. 14
Technology Use and Health Outcomes
In adults, insulin pump therapy continues to provide a small, but clinically significant reduction of A1C, glucose variability and the dawn phenomenon,15-18 lower frequency of severe hypoglycemia episodes.9,17,19 less hypoglycemia unawareness, an improved glycemic profile,17,19 and reduced insulin dosages, compared with traditional MDI. 20 In youth, pump therapy is associated with minor improved glycemic control for children and adolescents15,21-23 as well as fewer hypoglycemic episodes.10,24,25
In terms of CGM and health outcomes, 3 pivotal trials – the JDRF CGM randomized controlled trial, 13 Guard Control Study, 26 and O’Connell and colleagues 27 – demonstrated that adults on CGM had better A1C than blood glucose monitoring alone without an increase of hypoglycemic episodes, 28 as well as a lower frequency of diabetic ketoacidosis (DKA). 9 In youth, CGM is associated with lower A1C for some children, but not all adolescents.12,13,29 Only adolescents whose baseline A1C was greater than 7% showed improved A1C and experienced fewer hypoglycemic events while on CGM. 13 Only children using the sensor 6 or more days a week had improvement in glycemic control. 14
For SAP and health outcomes, the findings are dependent on age groups and type of subgroup analyses. Originally, the Sensor-Augmented Pump Therapy for A1C Reduction (STAR 1) compared the clinical effectiveness of CGM versus standard glucose monitoring in patients who were already on pump therapy and found no differences in A1C between the groups. 30 However, later iterations of this study (STAR 3) did in fact find A1C benefits from staying on SAP 31 and switching to SAP from MDI. 32 A 12-month, multicenter international study of SAP for adults with T1D demonstrated that while participants on average used the sensor less over the course of the trial (average use = 30%), those who stayed with SAP had fewer hospitalizations by 12 months. 33 More recent studies have also found that SAP has led to improvement in A1C as well as a decrease in time spent in hypoglycemia.34-36 The STAR 3 trial showed that A1C decreases were similar across adult and pediatric patients 32 and the combined benefit of SAP was greater than that of using pump or CGM alone. 28 In addition, in the STAR 3 trial, wearing CGM more frequently was associated with greater likelihood of reaching A1C goals among children and adolescents. 37 A similar finding was seen in another recent study of children 1-16 years old, in which the lack of difference between SAP and pump therapy plus BG monitoring was likely due to low sensor use in the SAP group. 38
Characteristics of Technology Users
Demographic Characteristics of Technology Users
Female children and adolescents, and non-Hispanic whites are more likely to be on pump therapy than other groups. 10 In addition, youth who have private health insurance, are from higher income families, live in a two-parent household, and have parents with higher education are also more likely to be on pump therapy.21,39
Multiple studies suggest that the uptake of CGM is related to the patient’s overall adherence to complex diabetes regimens. 1 Compared to nonusers, adult CGM users are more likely to use an insulin pump, have longer diabetes duration, have private insurance, have more years of education, and have more household income. 12 In youth, the following characteristics predict interest in starting CGM: lower A1C, more frequent BG monitoring, greater likelihood of being on an insulin pump, and having a two-parent family, greater diabetes adherence, lower diabetes-specific family conflict, and higher quality of life. 40 Finally, being non-Hispanic white is also associated with more frequent CGM use in youth younger than 13 years old. 12
For SAP, a low A1C, and frequency of use of the sensor predicts more frequent long-term use. 33 Thus far in the literature, there have been no differences across age, gender, duration of diabetes, duration of pump therapy, complications, or insurance reasons in predicting continuation of CGM use. 33
Behaviors and Attitudes Associated With Technology Use
Clinical guidelines describe the ideal pump candidate as checking blood glucose at least four times daily, giving four or more insulin injections per day, being motivated to optimize glycemic control, and being willing to carry out a complex insulin therapy and maintain contact with the clinical team. 41 In adults, pump users endorse wanting pump treatment to improve glycemic control, to gain a more flexible lifestyle, and to reduce fluctuations in blood glucose. 42
Psychological Adjustment of Technology Users
According to a systematic review of clinical trials and observational studies, adults on pump therapy have reduced fear of hypoglycemia, enjoy greater flexibility in lifestyle, report better quality of life, and perceive benefits for family members when compared with adults on MDI. 20 Quality-of-life benefits have been more evident for existing pump users rather than new users participating in a trial. 20
Barriers and Discontinuation of Technology Use
Known barriers to technology uptake and continued use fall into several categories: structural, psychological and demographic barriers. Structural barriers include lack of provider time to educate around technology, 7 health guidelines and insurance systems, 10 and costs associated with technology. 43 Psychological and demographic barriers include depression, 12 infrequent monitoring of BG, female gender, coming from single parent families, and older age at diagnosis. 44 Many factors are associated with likehood of discontinuing technology use, including more severe hypoglycemic events after starting the pump, 44 physical discomfort of wearing the CGM, 12 difficulty with insertion/adhesives/sensor functioning, frequency of alarms, skin reactions to sensors, and interference with physical activity.12,45 Parents and their adolescents may perceive different reasons for nonuse; in one major CGM clinical trial, parents believed that their adolescents resisted using CGM due to body image concerns, but youth attributed nonuse to practical issues such as insertion pain and frequent alarms. 13 High-frequency CGM users perceive fewer hassles to using the technology than low users.28,46 Due to the overlap of technology components, SAP users would be expected to encounter similar barriers as those seen for pump therapy and CGM.
Technology Use and Psychosocial Outcomes
Pump therapy has been associated with better quality of life across adults and youth.3,19,47,48 Qualitative analysis of patient satisfaction in adults who had switched to pump therapy presents a more complex picture; participants described their pump as “a shackle and a lifeline,” for example, by causing both burden and relief. 49 Certain individual characteristics predict treatment satisfaction with pump therapy such as self-efficacy, the belief that a patient can exert control over diabetes. 50 Patients with higher self-efficacy demonstrate higher pump therapy usage, more treatment satisfaction, better quality of life, and lower depression scores compared to those with lower self-efficacy. 50 For youth, quality-of-life findings are mixed; some studies note no difference across pump therapy and MDI 51 while others demonstrate significant diabetes-specific quality-of-life improvement with the use of pump therapy. 52 In addition, parents of children on pumps report decreased stress, decreased worry about hypoglycemia, and in very young children, reduced problems with nutrition management. 52
The evidence for CGM use and positive psychosocial outcomes is mixed. While some trials report that CGM users have moderate satisfaction with the technology and experience improved quality of life, 13 this benefit may only be true for a subset of the population, such as those who more frequently monitor. 45 A recent meta-analysis of randomized control trials found no significant association between CGM use and health-related quality of life. 2 Another study of adult CGM users (over 90% with T1D), investigated impact on several domains of quality of life, and found that CGM was associated with increased perceived control over diabetes and hypoglycemia safety. Participants were more likely to report quality-of-life benefits if they felt that the device was accurate, usable, and trustworthy. 53 A randomized crossover trial of adults with T1D tested the effects of CGM with real-time access to glucose data compared with CGM with retrospective data and found no differences between retrospective and real-time data access, nor differences in diabetes distress or anxiety levels, although participants’ depression scores did decrease somewhat at the end of the trial. 54 Positive user feedback for CGM includes being able to see trends in BG levels, being able to detect hypoglycemia more easily, and being able to correct out-of-range numbers. 45 Adolescents (versus other groups) do worse on CGM—they use it less, are less satisfied, are less accepting of hassles and burdens, and are less likely to meet A1c targets. 13 An exploratory study with cross-sectional data found greater parent-reported depression among children and adolescents using CGM compared to those using standard blood glucose monitoring, although adults using CGM reported less trait anxiety compared to the standard group. 55 As with adults, pediatric patients and their parents who monitor more frequently and use CGM for longer periods report increased satisfaction with CGM.14,45 For young children (4 to 9 years old) even when CGM is not associated with any improvements in A1C, parents report high satisfaction with CGM. 29
In clinical trials of SAP, participants rated the device as acceptable. 56 Those on SAP have reported lower diabetes distress,31,36 higher treatment satisfaction,31,36 and reduced fear of hypoglycemia. 33 Even in a trial where average use of SAP was roughly 30%, those who stayed with SAP found increased treatment satisfaction and less fear of hypoglycemia. 33 Compared to those using insulin pump plus BG monitoring, adults with T1D using SAP reported more satisfaction, more confidence in the system’s ability to control blood glucose, less likelihood to want to switch systems, and greater likelihood of recommending their system to others. 57 In the pivotal STAR 3 trial, both adults and pediatric patients reported less social burden and increases in perceived clinical efficacy, which was linked to having improved treatment satisfaction. 58
Embedding Human Factors Assessments
Given the landscape of diabetes device and technology use described above, as well as the factors associated with use, more research teams are integrating assessments on barriers and psychosocial variables in to device studies and trials. Our team at Stanford University School of Medicine has been working to integrate these assessments into, pump and CGM trials, and closed loop studies. We are referring to the assessments as human factors (HF) assessments because the assessments capture beliefs and attitudes about devices and diabetes distress, as well as the direct experience with the user interface (UI) and the overall user experience (UX). HF testing for diabetes devices (eg, insulin pump) has often focused on how users interact with the device to prevent errors and adverse events. 59 Our assessments are broader than traditional HF work at device companies as we attempt to integrate aspects of market research, traditional HF testing (eg, UI), and attention to psychological barriers that may limit uptake of devices and affect sustained use. Our approaches employ electronic surveys as well as face-to-face interviews and focus groups about usability.
One major human factor, or psychological barrier, we attend to in all of our studies is the degree of diabetes distress experienced by study participants. To provide an example of how these assessments are integrated, we report findings on diabetes distress and barriers to device uptake from one of our current HF studies. We present an example to demonstrate how these assessments fit in to this broader work on human factors that affect uptake and use of diabetes technology.
In this study, we were interested in the amount of diabetes distress experienced by adults with T1D and the degree to which that distress is associated with diabetes device and technology use. We partnered with the Jaeb Center for Health Research to advertise our study to participants in the Type 1 Diabetes Exchange. All participants provided online written informed consent and institutional and ethics approval was obtained from both review boards. All surveys were completed by self-report.
Surveys captured responses on demographics and diabetes characteristics: age, ethnicity, diabetes duration, insulin administration (injections versus pump therapy); technology use: what specific devices used and for how long; and, psychosocial measures: the Diabetes Distress Scale for adults with T1D (DDS-T1) 60 and the Diabetes-Specific Attitudes about Technology Use (DSAT). Diabetes distress was measured with the newly developed 28-item DDS-T1 that assesses the following domains: Powerlessness, Negative Social Perceptions, Physician Distress, Friend/Family Distress, Hypoglycemia Distress, Management Distress, and Eating Distress. A total score is created by averaging item scores, with low scores (1-1.4) indicating little to no distress and high scores (above 3) indicating high levels of diabetes distress. 60 The DDS-T1 demonstrated excellent reliability in this sample (Cronbach’s alpha = .94). The DSAT was created for this study with 6 questions that asked participants to rate on a 5-point Likert scale how much they agreed with statements such as “Diabetes technology has made my life easier”; “Diabetes technology has made managing my health easier”; and “I am lucky to live in a time with so much diabetes technology.” These questions were chosen because they are commonly raised during focus groups with both device and closed loop study participants. They also assess general attitudes without requiring direct experiences of using particular devices to respond. Higher scores indicate more positive attitudes about diabetes technology. Items were summed to generate a total score. Diabetes technology items demonstrated acceptable internal consistency (Cronbach’s alpha = .74). For diabetes technology attitudes, removal of 1 item, “Diabetes technology takes more time and work than it is worth,” improved reliability from .74 to .91. The survey is freely available by contacting authors.
Analyses and Results
Pearson correlations and independent sample t-tests were conducted to compare diabetes distress and diabetes technology attitudes across users of technology, including CGM users versus nonusers, and pump therapy users versus MDI users. ANOVA and Tukey’s post hoc tests were used to compare technology users based on increasing quantity of technology use (MDI & meters; pump & meters; MDI & CGM; pump & CGM) for differences in diabetes distress and diabetes technology attitudes.
The survey was completed by 1503 adults (>18 years of age) with T1D. Mean age was 35.3 years (SD = 14.77; range = 18-80), and mean diabetes duration was 20.39 years (SD = 12.53; range = 3-67). The sample was 90% white/non-Hispanic. Of participants, 38% were using insulin pump therapy and glucose meters, 32% insulin pump therapy and CGMs, 25% MDI and glucose meters, and 5% MDI and CGM.
Results of t-tests show that participants using both CGM and pump were significantly older (mean = 38.29, SD = 14.64) than nonusers (mean = 33.48, SD = 14.55), t(1501) = −6.21, P < .001, and had diabetes for a longer period of time (mean = 22.89, SD = 13.09) than nonusers (mean = 18.83, SD = 11.91), t(1045) = −5.8, P < .001. Pump users were significantly older (mean = 35.87, SD = 14.62) than MDI-users (mean = 34.03, SD = 15.04), t(1501) = −2.23, p = .026, and had diabetes for significantly longer (mean = 21.48, SD = 12.59) than MDI users (mean = 17.82, SD = 12), t(1382) = −5.03, P < .001.
As seen in Table 1, across the total sample, there were no differences in diabetes distress across types of technology used. There were significant differences found in diabetes technology attitudes across type of technology used with those on CGM having more positive attitudes about technology than those not on CGM and pump therapy users having more positive attitudes about technology than MDI users.
Means and t-Tests for Distress and Diabetes-Specific Attitudes About Technology Comparing CGM to Non–CGM Users, and Insulin Pump to Non–Pump Users.
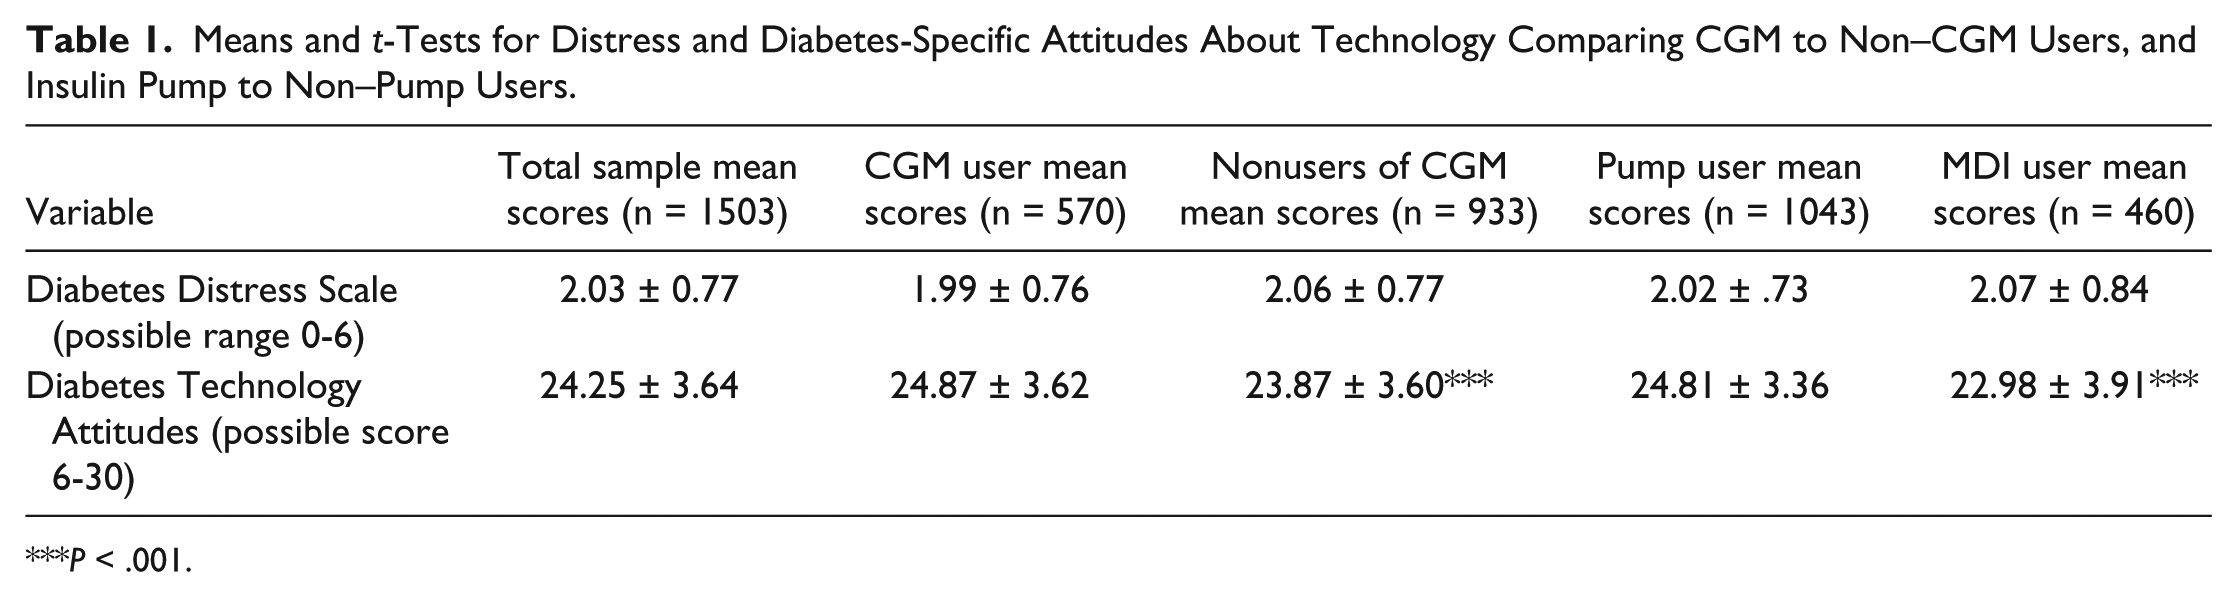
P < .001.
Again, no difference was found in groupings of participants into different technology use across diabetes distress (Table 2). However, again there are differences across diabetes-specific attitudes about technology, but only for those using meters and MDI, whose attitudes about technology is significantly poorer than all other groups (Table 2). The magnitude of this difference, calculated as an effect size (mean difference divided by pooled standard deviation), is 0.66. This is a medium to large effect size and suggests that attitudes are both statistically and clinically different.
Means and ANOVA for Distress and Diabetes-Specific Attitudes About Technology Comparing Type of Technology Use.
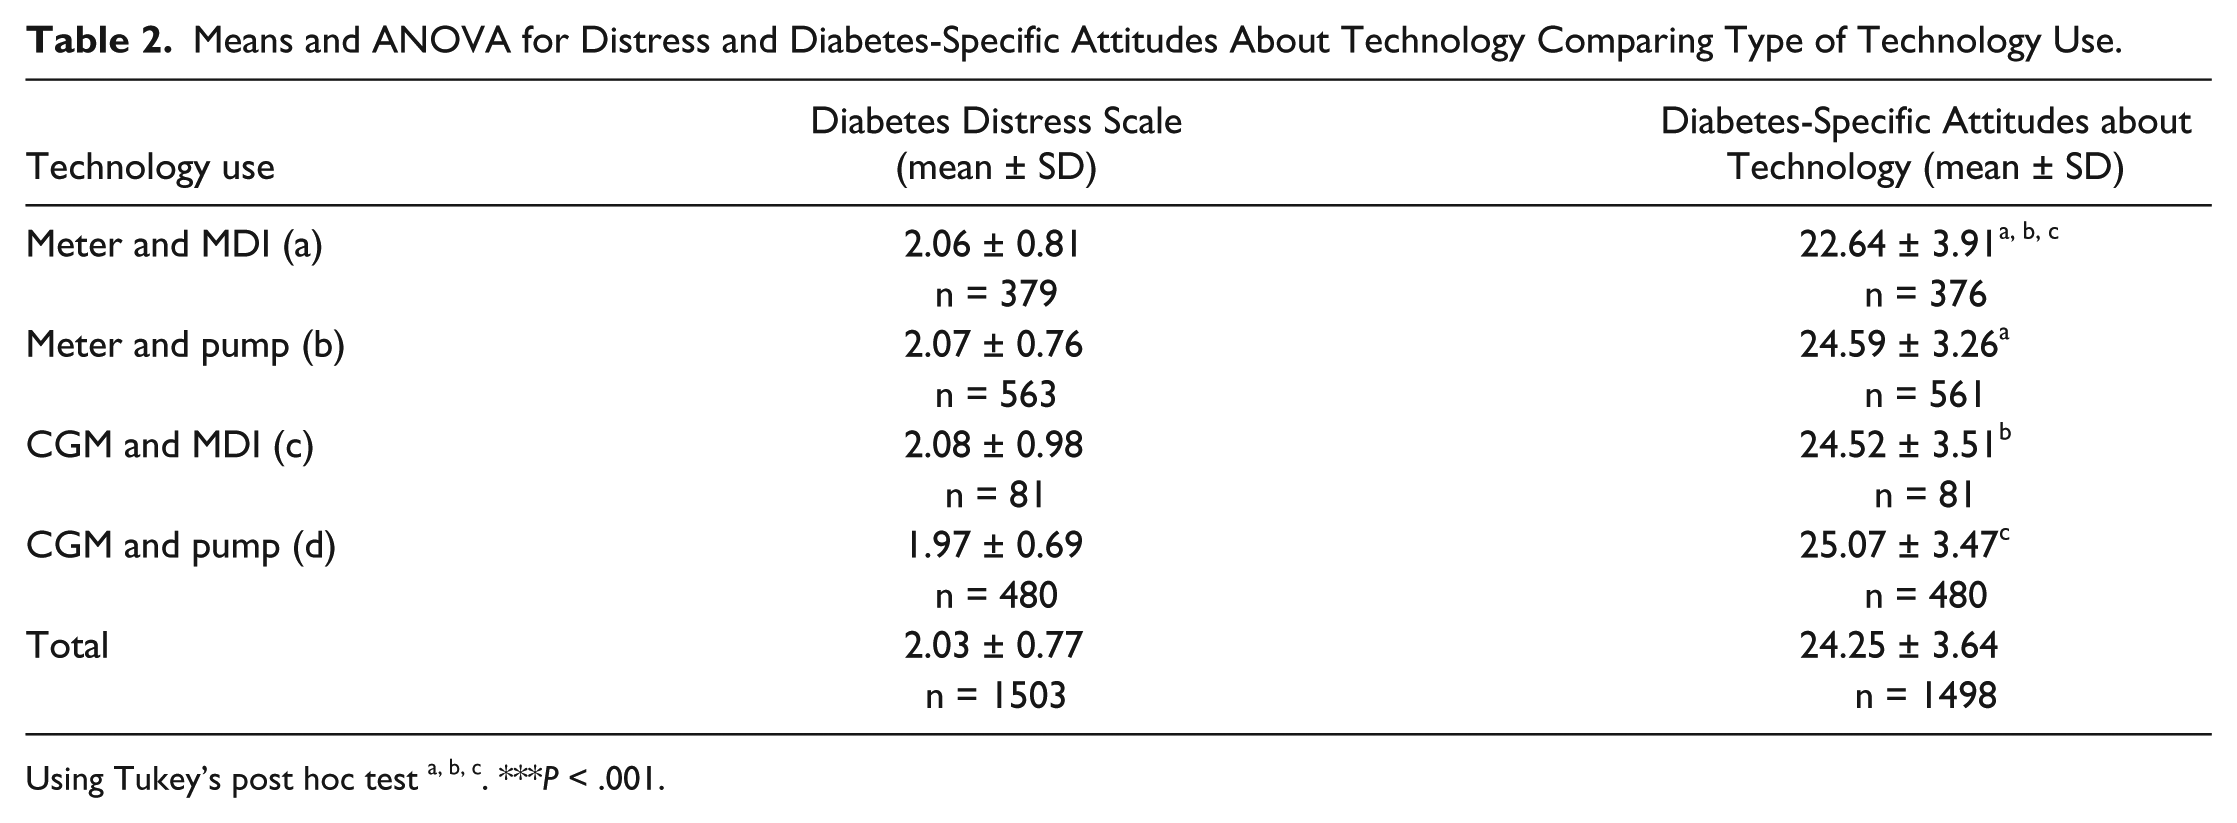
Using Tukey’s post hoc test a, b, c. ***P < .001.
Conclusions and Summary
Not surprisingly, this study found that those using “low-tech” approaches such as MDI and self-monitoring with BGMs have more negative attitudes about diabetes technology. In contrast, those currently using any type of more advanced diabetes technology, such as pump therapy, CGM, or SAP, demonstrated more positive attitudes about diabetes technology. In terms of diabetes distress, the major message from this study is that all participants, regardless of what diabetes technology is used, are moderately distressed. This finding likely relates to the complexity of managing a chronic illness and associated distress with the daily tasks involved.
Moderate diabetes distress has been linked in the literature to poor health outcomes and decreased self-care behaviors. 61 In fact, research shows a 0.5 standard deviation increase in HbA1C from a low diabetes distress score of 1-2 to a moderate diabetes distress score of 2-3. 62
We recognize some limitations to this example. Given that some users of technology try a device for a small period of time and then stop using that device, we were unable to examine whether those on MDI and BGMs had ever in the past used diabetes devices, which may have influenced their negative perceptions of technology. We are following up with all respondents about any discontinuations as well as a more extensive examination of noted barriers to use.
In summary, as technology has advanced in the management of diabetes, rates of diabetes device uptake and use have increased dramatically. Rates of uptake and use are associated with several personal and psychological characteristics, and similar factors are associated with diabetes health outcomes. As the field of diabetes technology advances, more complex systems will be available. For example, SAP devices will be replaced by fully and partially automated insulin delivery (AID) systems, sometimes referred to as an “artificial pancreas” or “closed-loop system.” With these changes, researchers will need to integrate HF into research designs and clinicians will need to consider HF when assessing patient readiness in the office. Attention to improving overall UI and UX will have great impact on technology uptake, sustained use, and satisfaction with these technologies for day-to-day management. These concepts will need to be examined alone and in tandem with health and psychosocial outcomes. Finally, a better understanding of barriers to technology use is needed to address and potentially mitigate these obstacles to expand reach and allow access for anyone who could benefit from the technology.
Footnotes
Abbreviations
A1C, hemoglobin A1C; BGM, blood glucose meter; CGM, continuous glucose monitoring; DDS-T1, Diabetes Distress Scale for adults with type 1 diabetes; DKA, diabetic ketoacidosis; DSAT, Diabetes-Specific Attitudes about Technology; HF, human factors; MDI, multiple daily injections; SAP, sensor-augmented pump; T1D, type 1 diabetes; UI, user interface; UX, overall user experience.
Declaration of Conflicting Interests
The author(s) declared no potential conflicts of interest with respect to the research, authorship, and/or publication of this article.
Funding
The author(s) disclosed receipt of the following financial support for the research, authorship, and/or publication of this article: This work was funded by The Leona M. & Harry B. Helmsley Charitable Trust