
Abstract
In this article, we present several important contributions necessary for enabling an artificial endocrine pancreas (AP) system to better respond to exercise events. First, we show how exercise can be automatically detected using body-worn accelerometer and heart rate sensors. During a 22 hour overnight inpatient study, 13 subjects with type 1 diabetes wearing a Zephyr accelerometer and heart rate monitor underwent 45 minutes of mild aerobic treadmill exercise while controlling their glucose levels using sensor-augmented pump therapy. We used the accelerometer and heart rate as inputs into a validated regression model. Using this model, we were able to detect the exercise event with a sensitivity of 97.2% and a specificity of 99.5%. Second, from this same study, we show how patients’ glucose declined during the exercise event and we present results from in silico modeling that demonstrate how including an exercise model in the glucoregulatory model improves the estimation of the drop in glucose during exercise. Last, we present an exercise dosing adjustment algorithm and describe parameter tuning and performance using an in silico glucoregulatory model during an exercise event.
While exercise is an important component of a healthy lifestyle for everyone, glucose control during and after exercise is a major barrier to exercising for individuals with type 1 diabetes. Exercise causes increased insulin sensitivity along with rapid uptake of glucose by muscle and other tissues within the body, leading to a sharp decline in glucose levels. 1 Artificial endocrine pancreas (AP) systems have the potential to mitigate the risk of exercise-induced hypoglycemia by enabling the automated detection of exercise with adjustment of dosing based on the level and type of exercise. Results from studies aiming to reduce exercise-induced hypoglycemia have been mixed. Stenerson et al showed that insulin suspension based on accelerometery input alone was successful in preventing exercise-induced hypoglycemia in silico, 2 but not successful in preventing hypoglycemia in children with type 1 diabetes playing soccer. 3 Turksoy et al 4 did a study whereby they used a body-worn multisensor physiologic monitor called SensWear Pro3 (BodyMedia Inc, Pittsburgh, PA) that measures physical activity through accelerometry, temperature, and galvanic skin response to adjust dosing during exercise without the need for an exercise announcement. They used accelerometry and skin impedance as inputs to their single-hormone AP to reduce the delivery of insulin during exercise. If glucose was dropping sharply or dropping too low, the system alerted the subject to consume carbohydrates. For 7 runs on 3 subjects, only 1 subject developed hypoglycemia in a single experiment. In certain test runs, carbohydrates were given to the subjects very close to the onset of exercise, thereby reducing the likelihood of developing hypoglycemia. This system was compared with open-loop control in Turksoy et al 5 and the authors found a reduction in hypoglycemia using the automated system compared with open-loop control. In a study by Breton et al, 6 the addition of heart rate input to modify dosing of a control-to-range single-hormone AP system reduced hypoglycemia from 2 to 0 events in 10 subjects who cycled for 30 minutes. Although both heart rate and data from an accelerometer can be used to detect exercise, both are also prone to false positives (coding an event as exercise when no exercise is taking place). For example, heart rate can be increased in the presence of stress or a fever and accelerometer data can be increased while horseback riding. There remains an unmet need to better detect exercise and reduce exercise-related hypoglycemia.
To reduce the burden on individuals with type 1 diabetes, it is ideal for exercise to be automatically detected rather than requiring manual announcement. A number of prior groups have presented algorithms for detecting and grading exercise; see Butte et al 7 for a review. More recently, in the context of use within an artificial pancreas Dasanayake et al 8 demonstrated that using heart rate, accelerometry, and the subjects’ glucose levels, that exercise onset for mild and moderate exercise could be detected within 5 minutes for mild exercise and 6 minutes for moderate. Exercise detection algorithms generally fall within 2 categories, linear and nonlinear approaches. Linear models are typically regression models that use features from accelerometers and heart rate monitors as regressor parameters within the model. The output of the model is energy expenditure (EE). Alternatives to the regression model are nonlinear models that rely on supervised training using techniques from machine learning. These models include neural network models, support vector machines, Bayesian classifiers, decision trees, and others. 7 While many of the nonlinear classifiers7,9,10 have demonstrated good performance in estimating EE, few authors provide details of the model that enable others to use them. For this reason, the best algorithm to estimate EE within the context of an AP was a regression model, of which all of the parameters have been published. 11 In this article, we show results of detecting and grading EE during exercise and nonexercise time epochs in adult subjects with type 1 diabetes on sensor-augmented pump therapy.
Our group has developed a bihormonal AP system (Figure 1) that delivers both glucagon and insulin.12,13 We have shown that including glucagon significantly reduces hypoglycemia as compared to insulin delivery alone 14 and hypothesize that it is even more critical during exercise, when glucose levels drop quickly leaving insufficient time for suspension of insulin alone to be effective. We also hypothesize that detection of exercise using heart rate and accelerometry with immediate dosing changes is important, as simply reacting to dropping glucose levels may be ineffective; higher glucagon doses may be required to prevent hypoglycemia. In this article we describe an algorithm that may be used to adjust dosing of insulin and glucagon after exercise is detected. We show how the algorithm was tuned and validated on an in silico model that included pharmacokinetics for insulin and glucagon as well as a meal model and a model for exercise.15-18
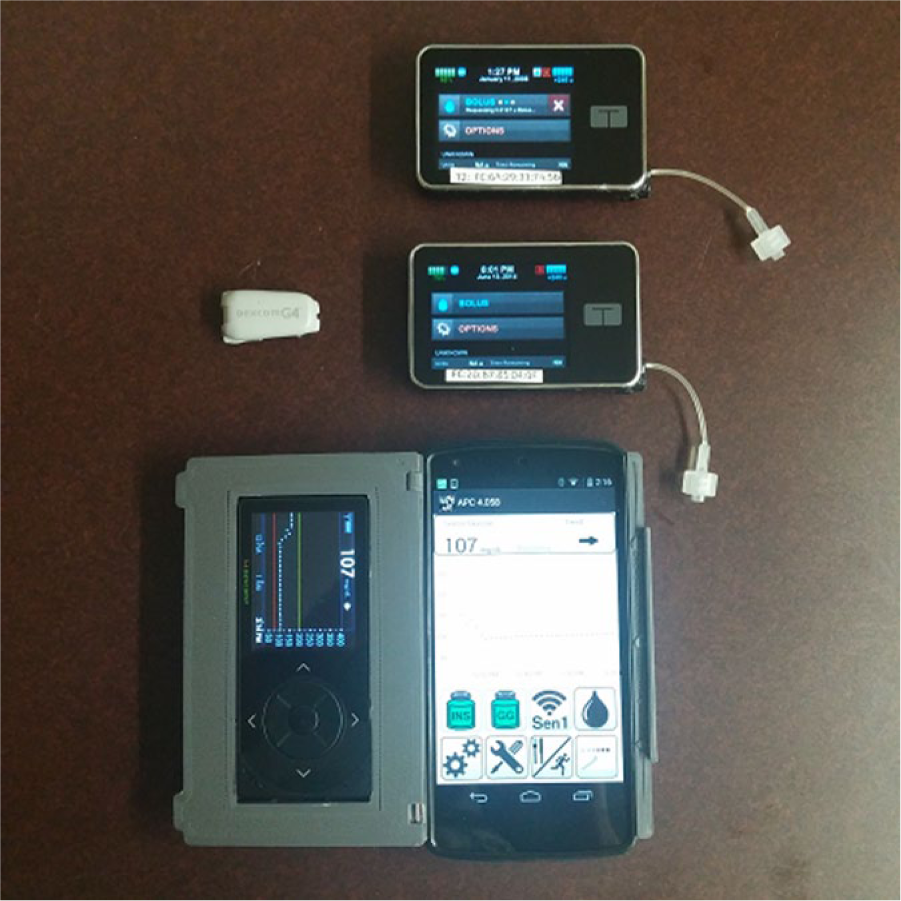
Hardware components of the OHSU AP. The system is comprised of mostly off-the-shelf components including 2 Tandem pumps, a Dexcom G4 sensor and share AP receiver, and a custom 3D-printed enclosure. A key system component is the control algorithm and intelligent software running on the smartphone app. This software currently runs on a Google Nexus smartphone running an Android operating system.
Methods
Open-Loop in-Hospital Study: Subjects Perform Mild Exercise
As a part of a separate AP system study, 13 adult subjects with type 1 diabetes were each observed in the research center for 22 hours while on sensor-augmented insulin pump therapy (7
Detection and Grading of Exercise
A validated linear regression model described by Zakeri et al 11 was used to estimate EE in kilocalories/minute. This model uses heart rate (HR), physical activity (PA), as well as Hr2, PA 2 , and lead/lag versions of HR and PA. A minimal HR and sitting HR was also used within the model. The output of this model is EE and this output may then be used to detect and grade exercise. Detection depends on EE exceeding a certain threshold. We show in the results section how a threshold of 4 kcal/min is a reasonable choice for detecting mild exercise where mild exercise is defined as 60% of the maximal heart rate. Since the output of the model provides actual estimates of EE, we can also grade the level of exercise.
Fitting Glucoregulatory Model to Subject Data Considering Exercise as a Disturbance
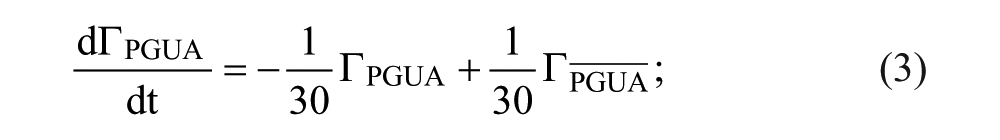
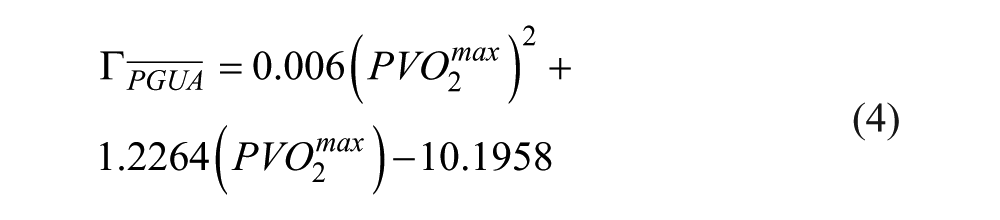
We used a model of insulin kinetics, 18 dynamics, 16 and carbohydrate metabolism; 16 we fit 19 model parameters to the open-loop data. Model fitting was done using Matlab’s fmincon (Mathworks, Natick, MA). A constrained minimization was done whereby we set the minimum parameter values to 25% and the maximum to 175% of those published by Hovorka et al 16 and Wilinska et al. 18 The objective function was the mean squared error between the sensed glucose and the model estimate of glucose after the first 100 minutes of the study, to enable the system and the model time to stabilize. Next we included an exercise model presented by Hernandez-Ordonez et al 15 within the glucoregulatory model and assessed whether the exercise model enabled a better estimate of the drop in glucose during exercise compared to without the exercise model. The Hernandez-Ordonez et al model takes the percentage of VO2 maximum (PVO2max) and the percentage active muscle mass (PAMM) as inputs and calculates the change in hepatic glucose production (HGP), peripheral glucose uptake (PGU), and peripheral insulin uptake (PIU). Specifically, the insulin action on glucose distribution (x1), disposal (x2), and EGP (x3) in Equation 7 within Hovorka et al 16 are modified using Equation 1.
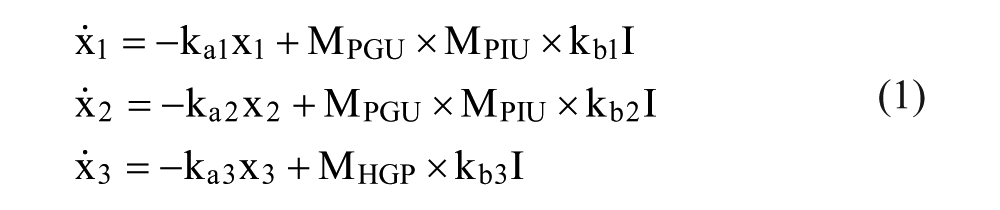
whereby MPIU and MHGP are set to 1 during nonexercise. During exercise they are calculated using Equation 2.
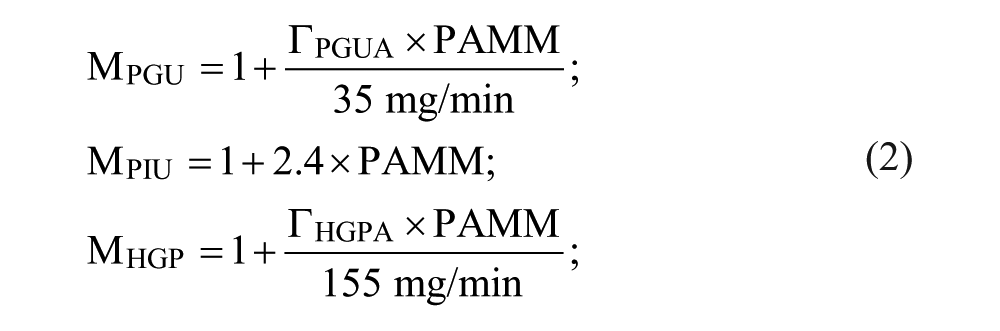
where
Adjusting Insulin and Glucagon Dosing During an Exercise Event
Here we present an algorithm that adjusts the dosing of insulin and glucagon during an exercise event. Following exercise detection or announcement, the system will
Turn off insulin for 30 minutes (window A)
After the 30-minute shut-off, reduce insulin by 50% (IIRred) for 60 minutes (window B)
Increase the glucagon infusion rate by a factor of 2 (GIRinc) during windows A and B
Increase target glucose for glucagon from 95 to 110 mg/dl during windows A and B
Table 1 summarizes the parameters that are adjusted after an exercise announcement.
Exercise Model Parameters.
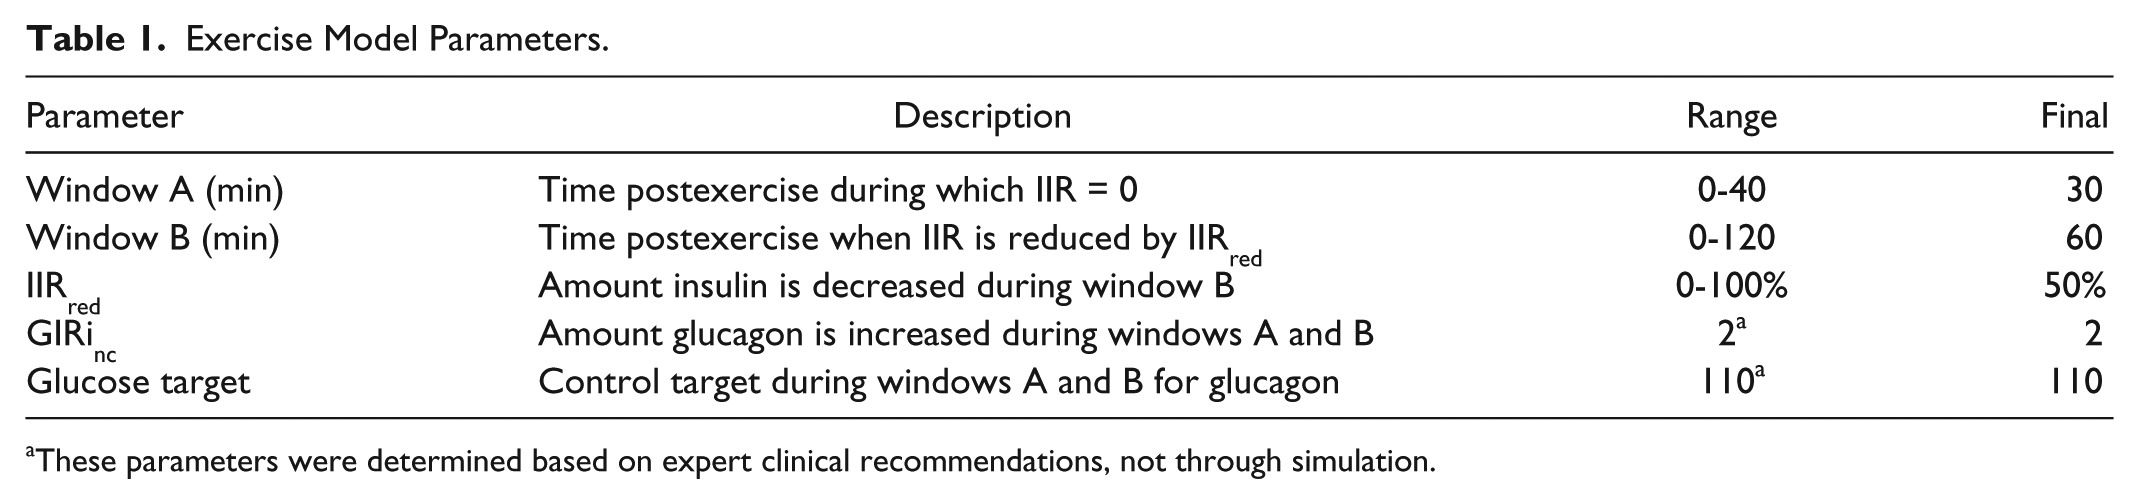
These parameters were determined based on expert clinical recommendations, not through simulation.
In Silico Simulation
The exercise adjustment algorithm parameters were tuned using a statistical virtual-patient population simulator derived from a physiology study recently performed by our group. While the UVA-Padova simulator 19 is a powerful FDA approved tool for evaluating control algorithms to be used for clinical studies, the currently available version lacks the ability to simulate an exercise event. We therefore implemented a simulator described previously 20 and we fit the critical model parameters to data we acquired from a published study examining the response to glucagon at varying levels of insulin. 21 These model parameters consist of 3 glucagon action coefficients as described below, and 1 insulin sensitivity multiplier which is linearly related to insulin sensitivity of distribution, disposal and endogenous glucose production (EGP).
Glucagon Action Model
The glucagon pharmacodynamics model that we used in the in silico simulator as described in Bakhtiani et al 20 includes the following components:
Remote compartment for glucagon (eg, accounting for a delay between changes in plasma glucagon and its effect on glucose)
Glucagon and insulin have an additive effect on EGP
The change in glucagon (derivative effect) impacts EGP
The glucagon action model that we used to run our simulations is given in Equation 5 to 8. In these equations, Gg is a function of both the glucagon in plasma, which is represented as Q3g in units of mg/kg, and the volume of glucagon distribution, which is represented as VdGG.

The variable Y represents the glucagon in a remote compartment. This remote compartment introduces a delay component to the model as given in Equation 6.
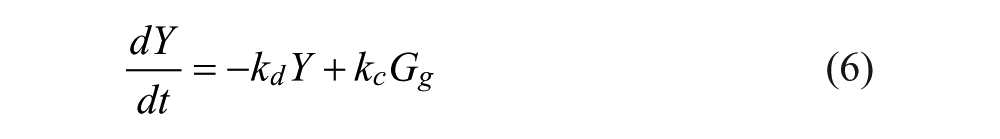
In Equation 6, kd is the glucagon clearance in min-1 from the remote compartment and kc is a measure of “glucagon sensitivity” in (ng/L)-1.min-1. EGP is defined in terms of a baseline EGP (EGP0) as well as the insulin action component (X3) and the glucagon action component (Z).

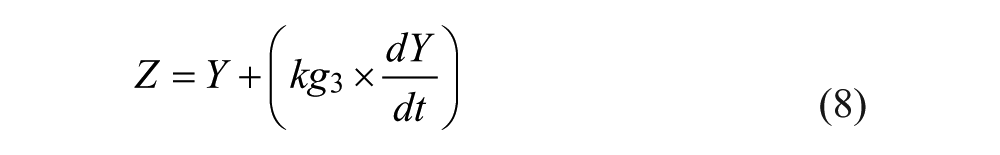
Notice that the glucagon action component is dependent on both the glucagon levels in the remote compartment (Y) and the change in glucose levels in this remote compartment (dY/dt). The amount that the derivative glucagon component contributes to glucagon action is defined in terms of the variable kg3. The variables kc, kd and kg3 are values that change per subject, but VdGG and EGP0 are fixed at 0.0385 (L/kg) and 0.0161 mmol.kg-1.min-1, respectively.
Note that in Equation 7, glucagon action on EGP is affected by an additive component of glucagon and a negative component of insulin, such that when glucagon levels are higher, EGP is also higher. And when insulin levels are lower, EGP is also higher.
Virtual Patient Population Fit to Physiology Data
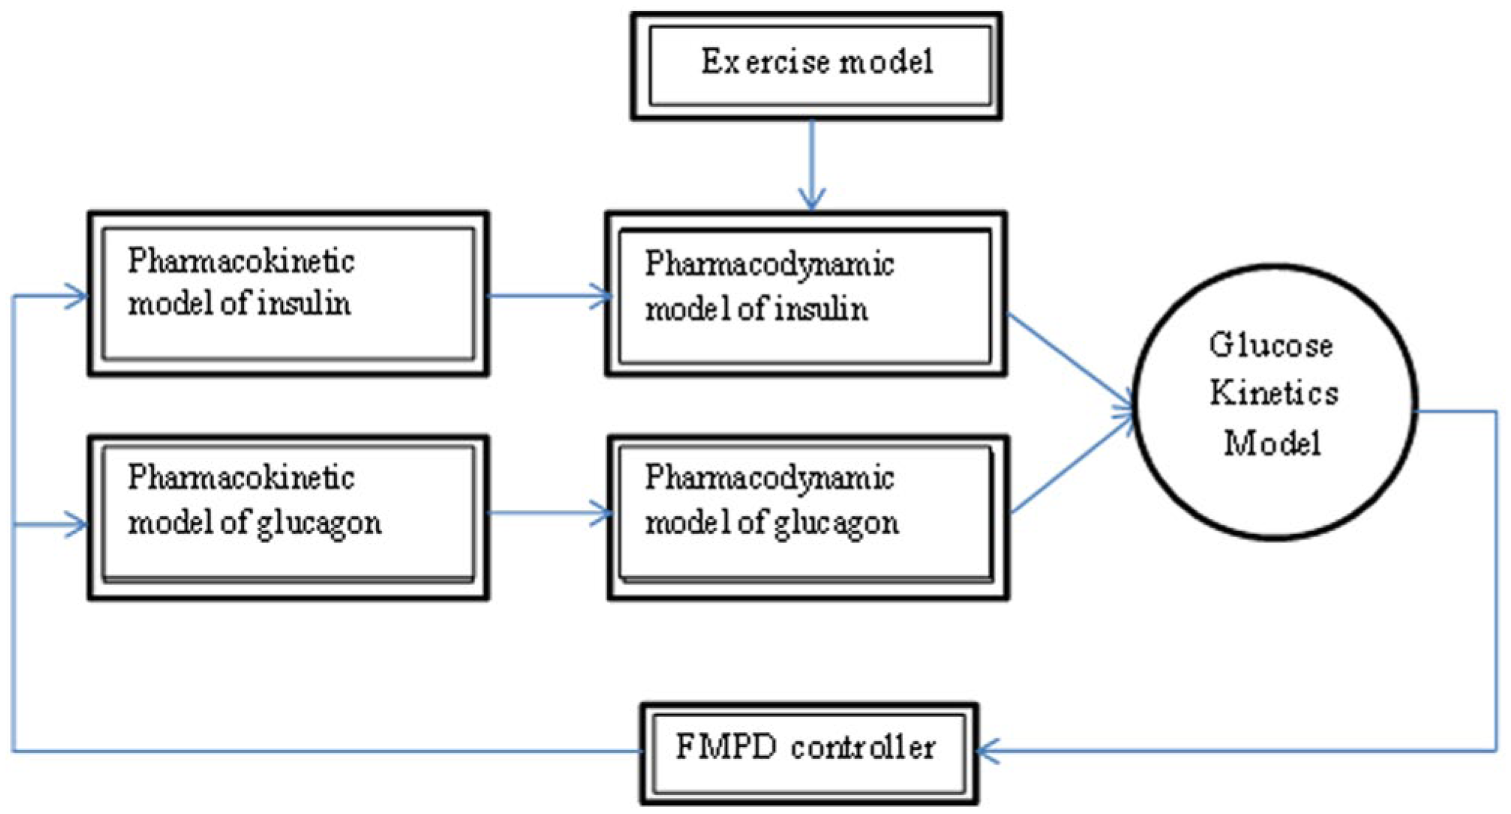
The simulation models that we used for in silico simulations are shown in Figure 2. We utilized an insulin pharmacodynamics model reported by Hovorka et al, 16 an insulin pharmacokinetics model reported by Wilinska et al, 18 a glucagon pharmacokinetics model reported by Lv et al, 17 the glucagon action model discussed above, and an exercise model described by Hernandez-Ordonez et al 15 and described in the previous section. Subject data from a study of the response to glucagon at varying levels of insulin 21 and also open-loop data presented in this article were fit to the model to estimate the model parameters for each subject. In this way, we were able to create virtual patients on which to run in silico AP experiments. While we did not create a simulator to validate this model as has been done by others including Wilinska et al, 22 the individual models have been validated in the articles described above and we found that the subjects’ glucose data fit the model well. The goodness of the fit of the data to the model was confirmed by the fact that mean model parameters determined during the fit were close to those specified in the publications on the individual models and because the actual data fit the model predicted data. Table 2 shows the published model parameters and the mean model parameters derived from the fit to our physiology data as well as the percentage deviation. The mean model parameters had a mean absolute percentage error of 17.8 % from those published, but there was not a bias in any direction as the relative percentage error was 3.4%. The highest variability in subject parameters was found in the insulin absorption and action compartments, where in clinical practice this is known to occur, and these remain consistent with the dispersions reported. 18 We therefore opted to proceed with these parameters in simulation studies.
Model Parameters Compared With Published Values.
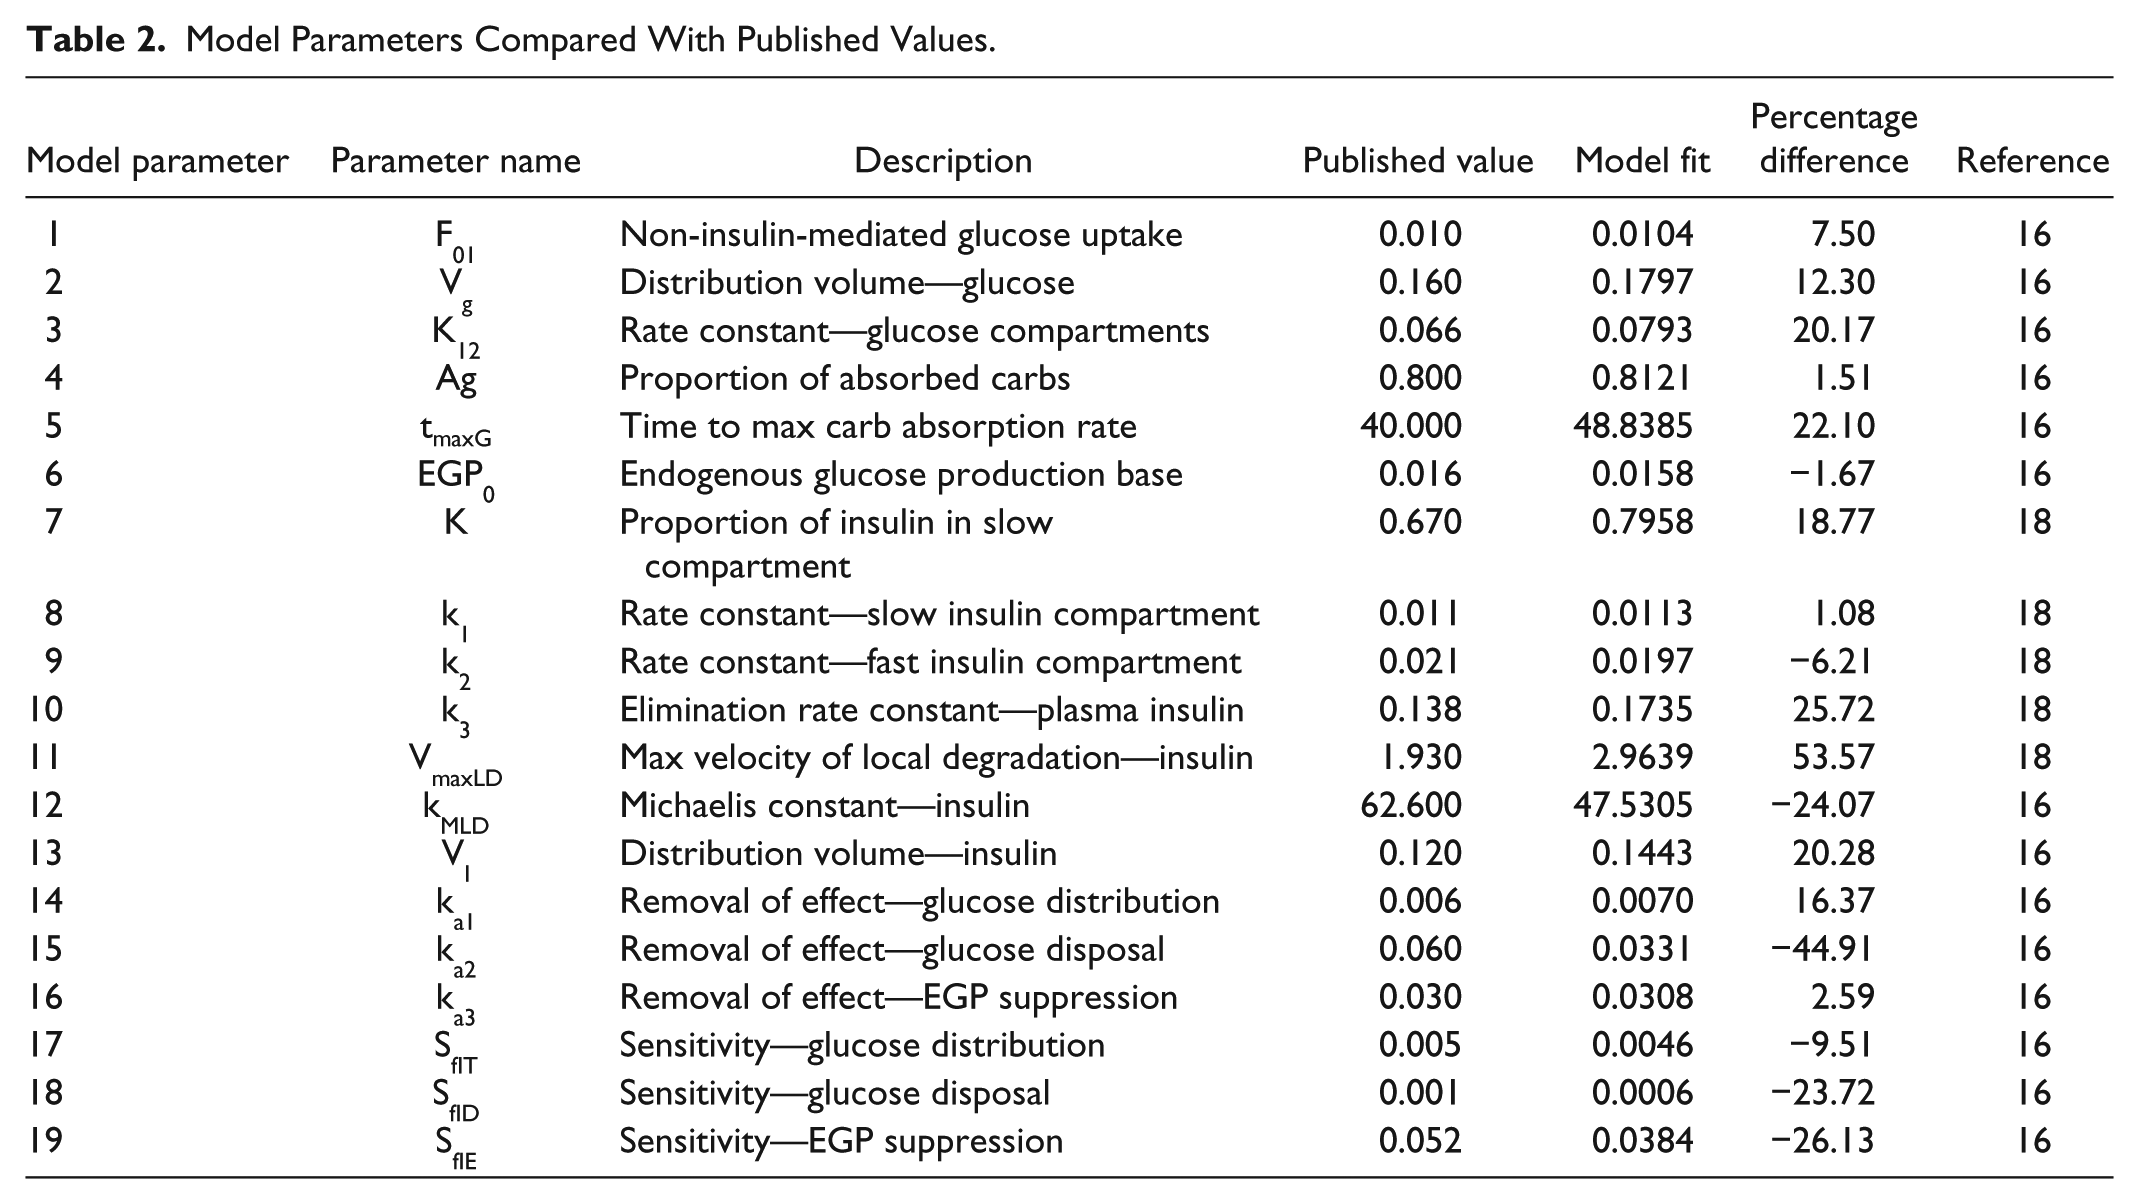
Figure 3 shows the average glucose data and the model-predicted glucose data (this model did not include the Hernandez-Ordonez et al exercise model). Notice that the residuals were largest during the exercise event; in the results section we show how including the exercise model improves the fit of the data during exercise.
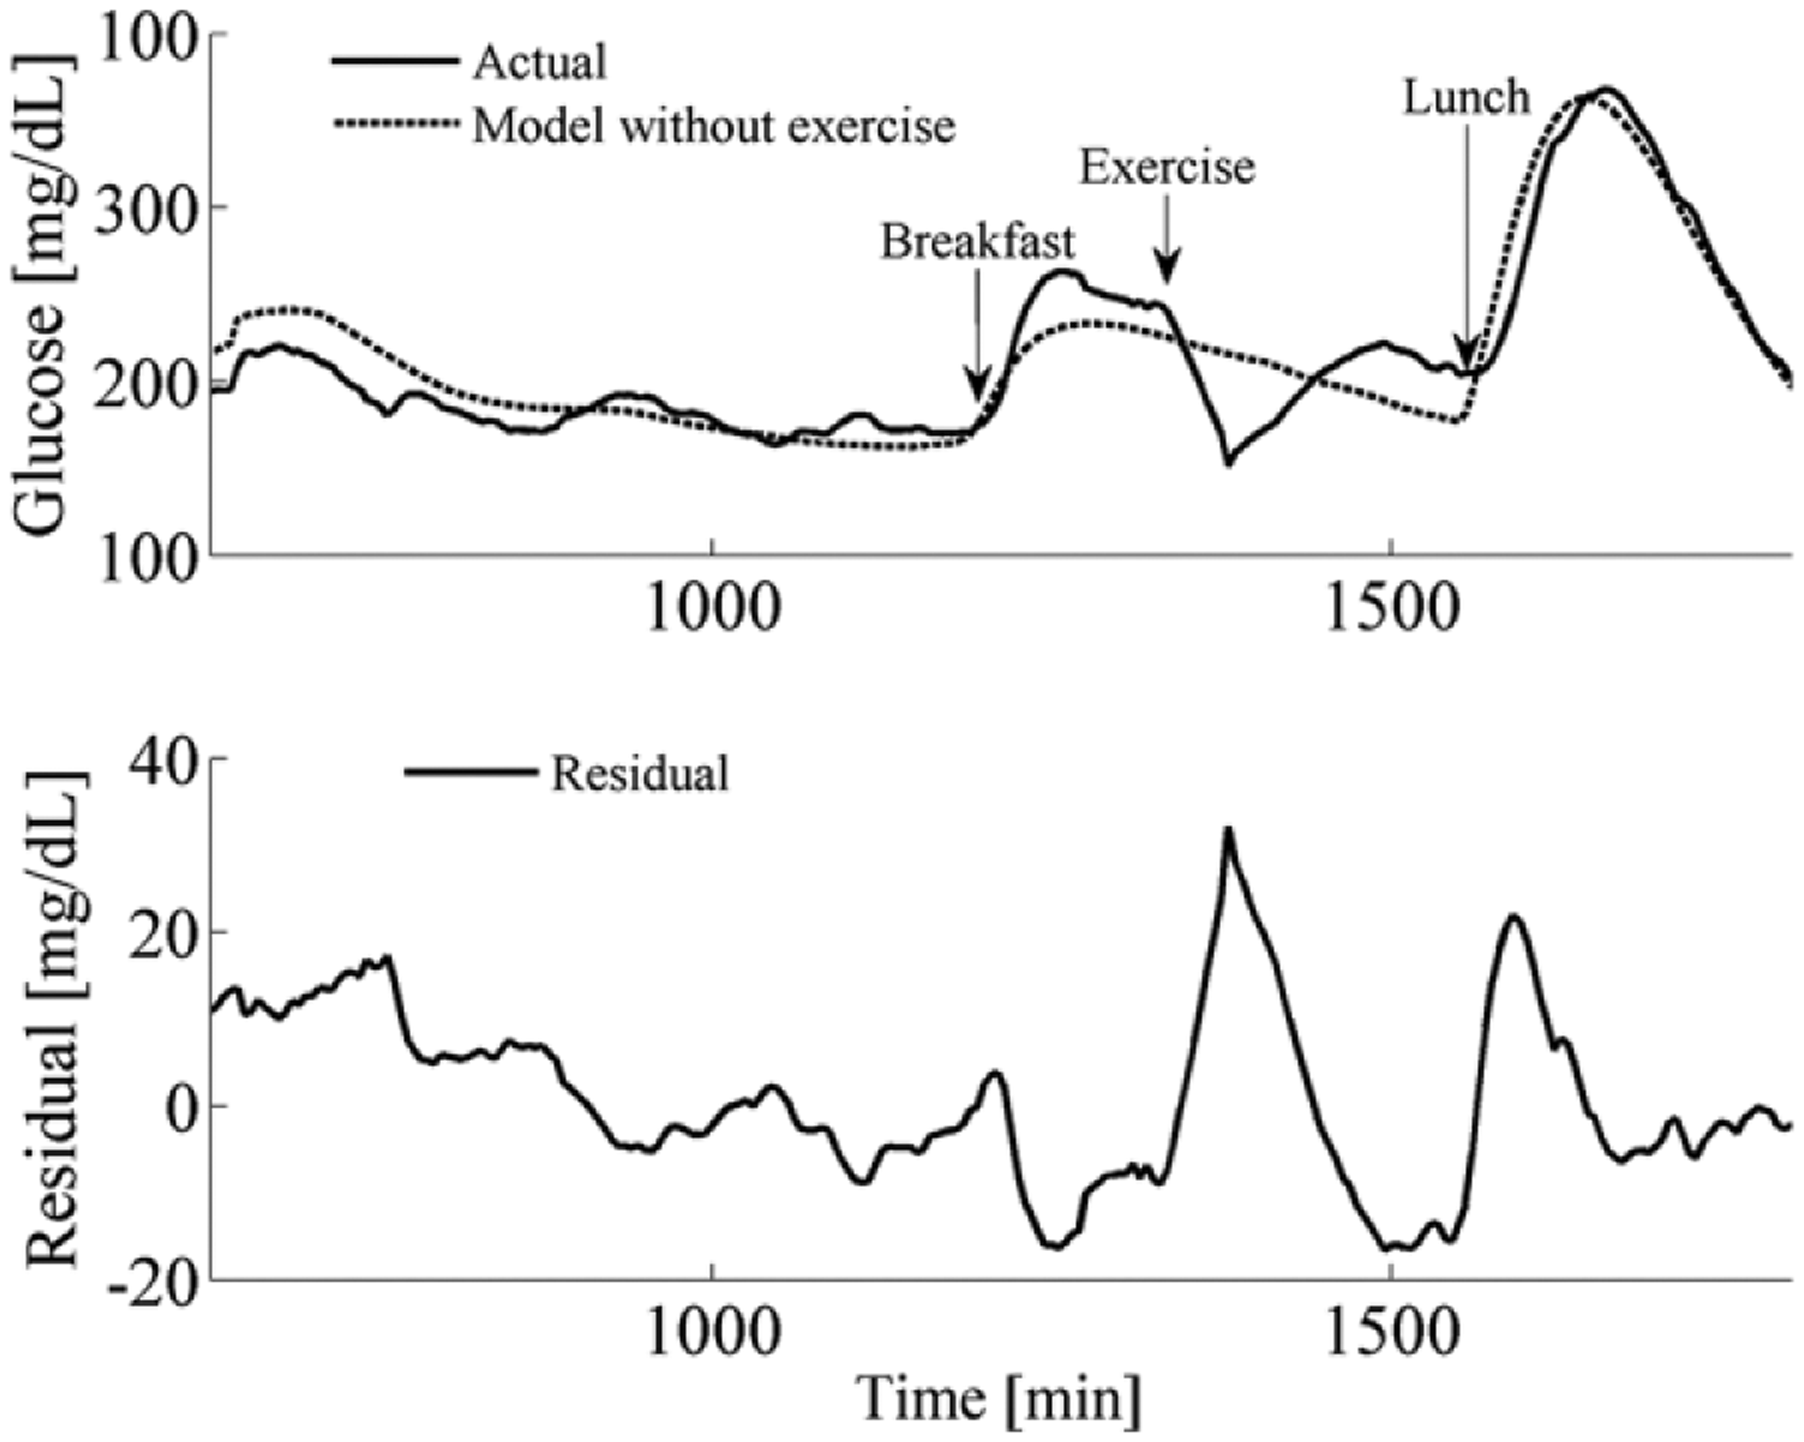
Mean glucose data during open-loop data collection across all subjects and mean model estimation across virtual subjects. The model is a reasonable approximation of the actual glucose changes. The model shown above did not include a model for exercise and notice that the highest residual errors are observed during exercise.
Results
Results of Detecting Mild Exercise
Figure 4a is an ROC curve showing the sensitivity and specificity of detecting mild exercise using the Zakeri et al 11 regression equation across different EE threshold values. Figure 4a was generated by considering the entire 22-hour open-loop study for each of the 13 subjects. The equation was used to detect exercise in each 5-minute segment of the 45-minute exercise period compared with the 5-minute nonexercise segments in the rest of the study. EE was calculated for each 5-minute time interval during the trials using the Zakeri algorithm along with the heart rate and accelerometry values acquired from the body-worn Zephyr during the study. As the EE threshold used for detecting an exercise event varies, so does the sensitivity and the specificity of the detection. A true positive is when EE exceeded the threshold during a 5-minute segment when the subject was exercising. A false positive is when EE exceeded the threshold during a 5-minute segment when the subject was not exercising. If we selected a threshold for EE of greater than 4 kcal/min to indicate mild exercise (30-50% maximum VO2), then we can detect this mild exercise event with a high sensitivity (97.2%) and specificity (99.5%). An AP system typically doses insulin every 5 minutes, since this is the time when a new glucose reading arrives from a continuous glucose sensor. Exercise can be detected using this approach within this 5-minute window required to make a dosing decision within the context of an AP system.
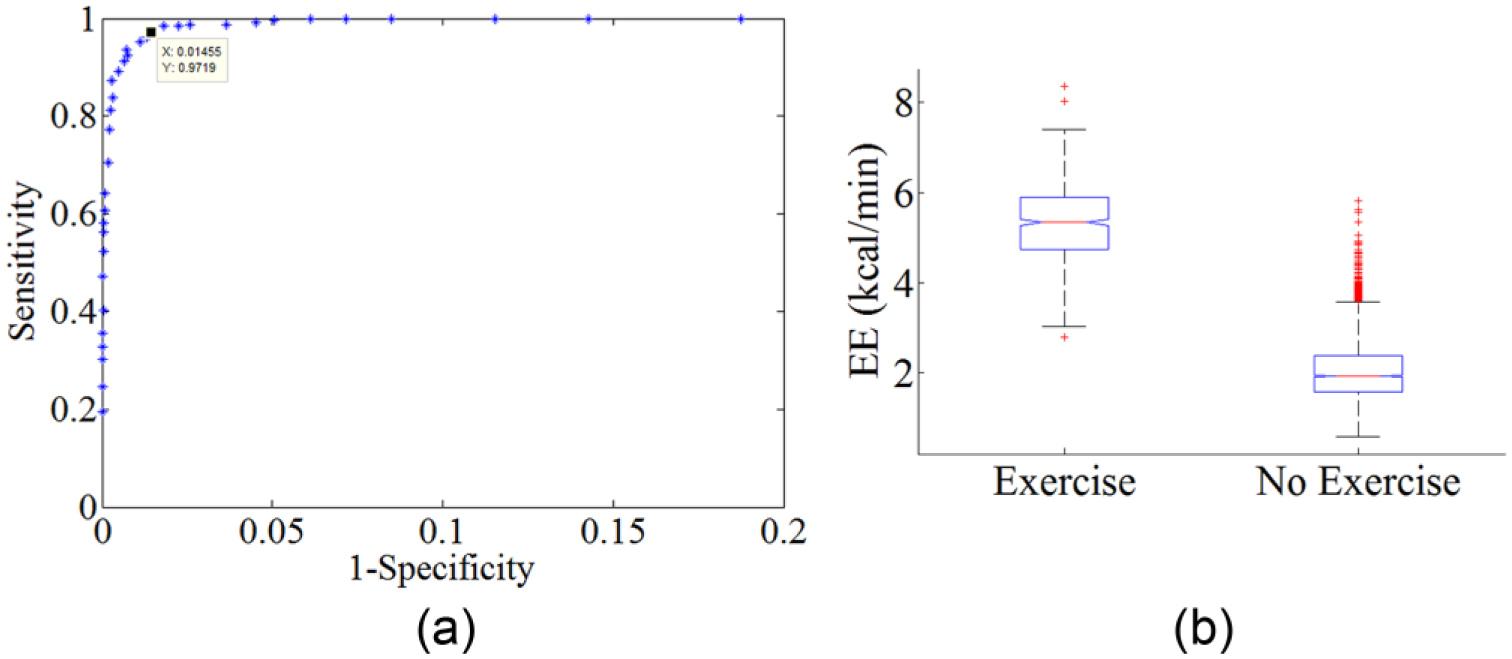
(a) Detection of person exercising at mild levels (60% of their maximum HR) during a 22-hour hospital study. Body-worn HR and accelerometer sensors were used for the detection. (b) Boxplot showing EE both during an exercise event and EE during nonexercise activities.
Energy expenditure was estimated as a percentage of maximum VO2 and the predicted versus the actual EE is shown in Figure 5. The correlation between predicted and actual percentage VO2 was moderate with an r2 of .55 and a mean absolute error of 7.4%.
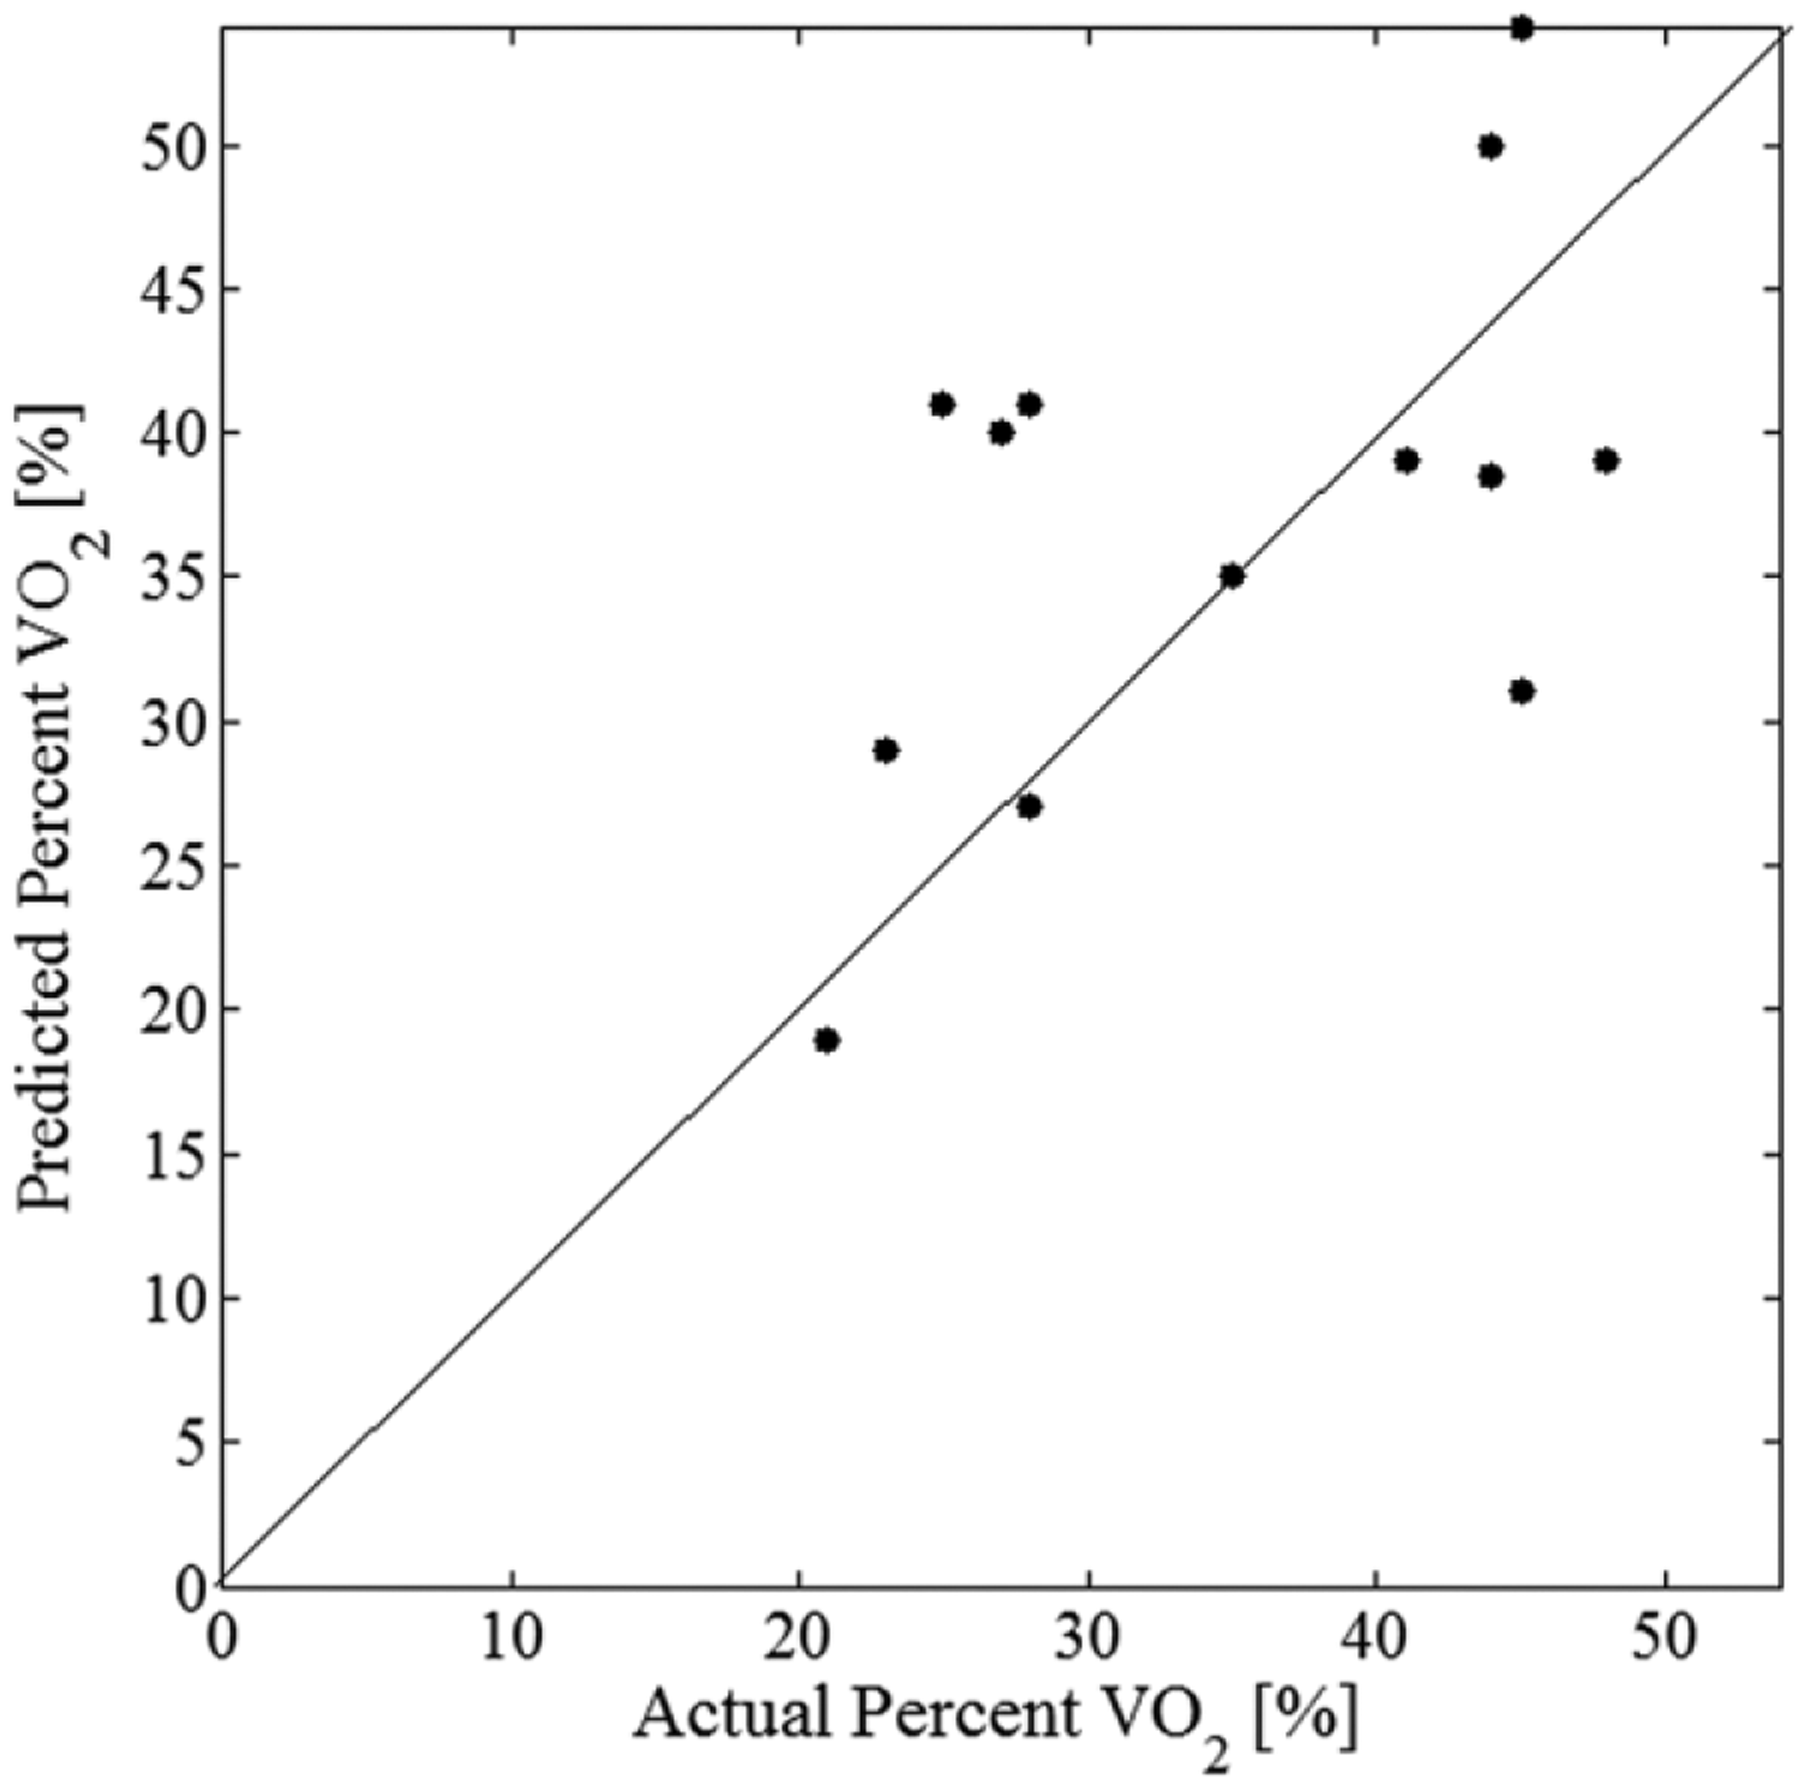
Estimated percentage of maximum VO2 vs actual percentage of maximum VO2 for all 13 subjects tested. Line shows perfect estimate.
Open-Loop Changes in Glucose During Mild Exercise: Model Versus Actual
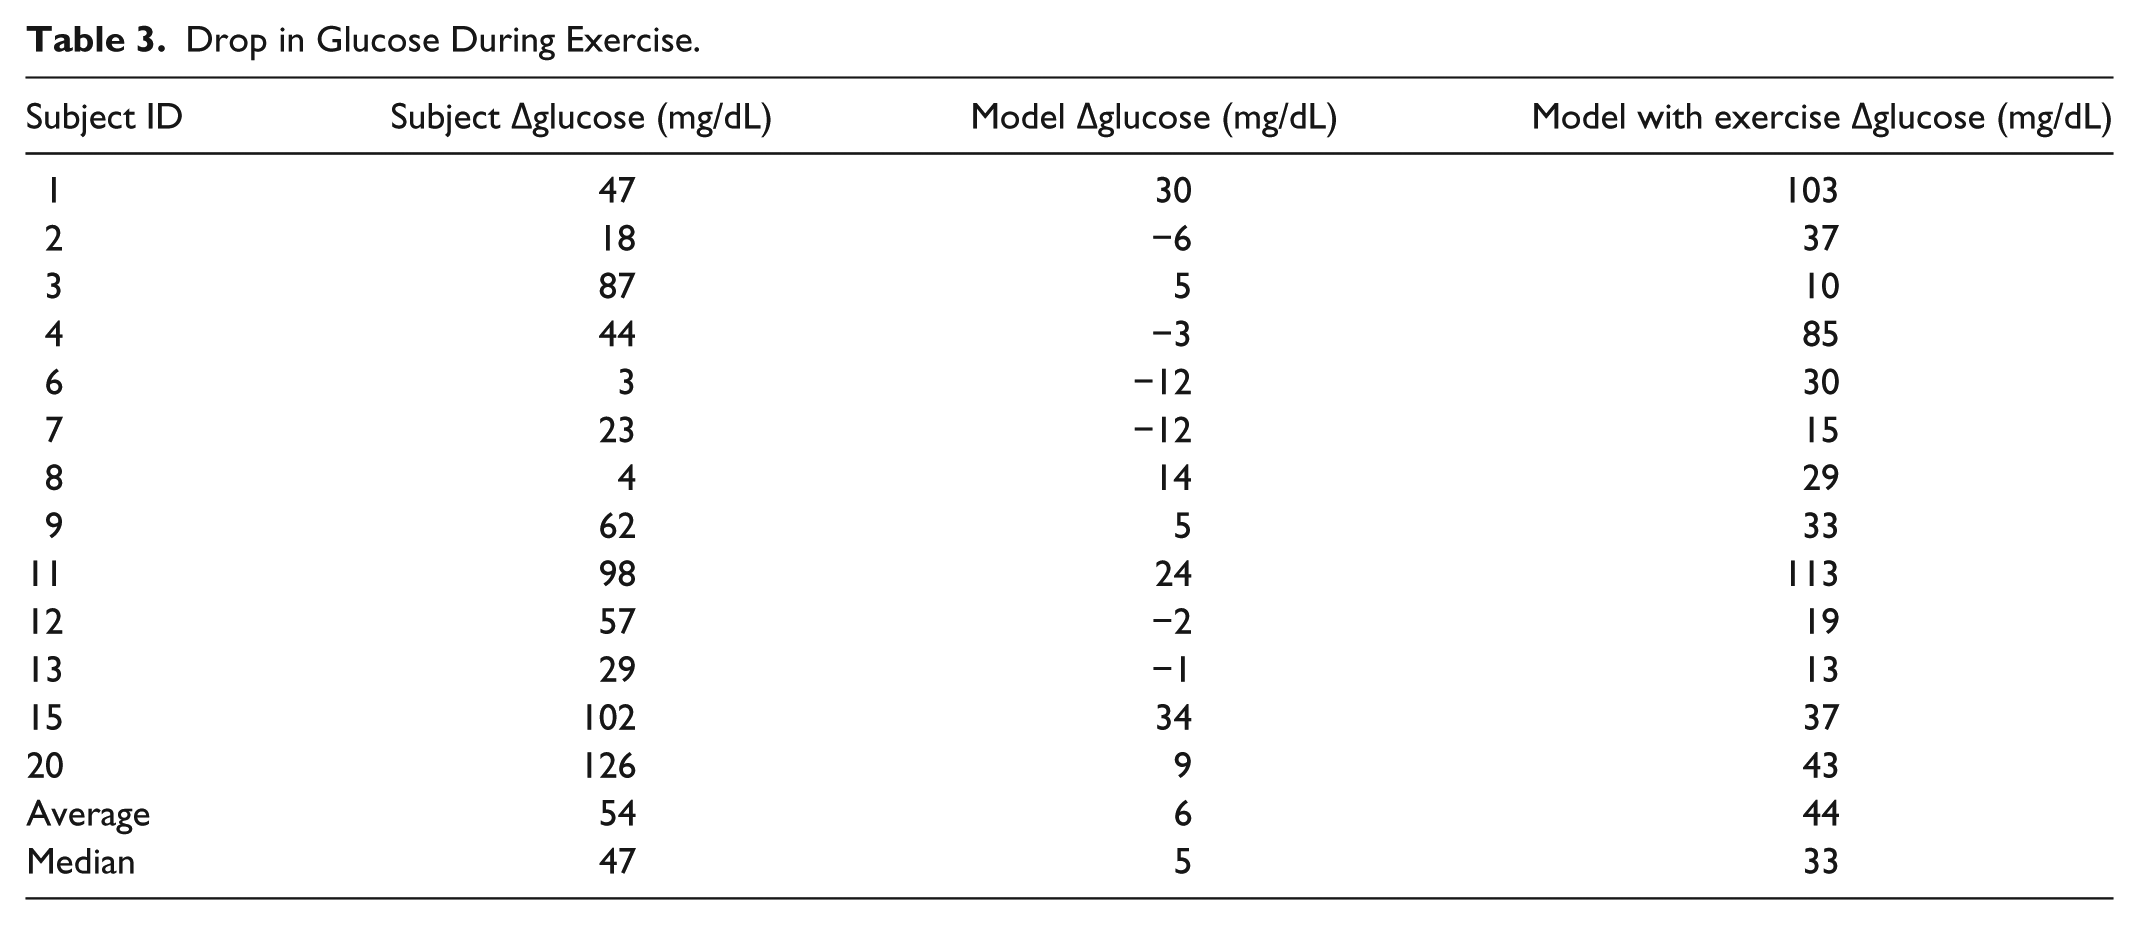
During the open-loop trial, all subjects’ glucose dropped during the 45 minute exercise event. Each subjects’ blood glucose was measured before and after the exercise event, and the drop in glucose for the subjects is shown as a boxplot in Figure 6 and for each individual subject in Table 3. Also shown in Figure 6 and Table 3 is the amount of drop in glucose predicted by the glucoregulatory model that did not include an exercise model when fit to each individual’s CGM data. Notice that the nonexercise model generally under-predicted the drop in glucose levels during exercise (P < .005). Figure 6 further shows that when exercise is included within the glucoregulatory model, the drop in glucose during exercise is closer to the patient data and is not statistically significant than the actual glucose drops of the subjects as determined using a 1-tailed paired t test (P = .22). An example of the drop in 1 subject (Subject 12) is shown in Figure 7. Notice again how including the exercise in the model improves the fit of the model to this subject’s data.
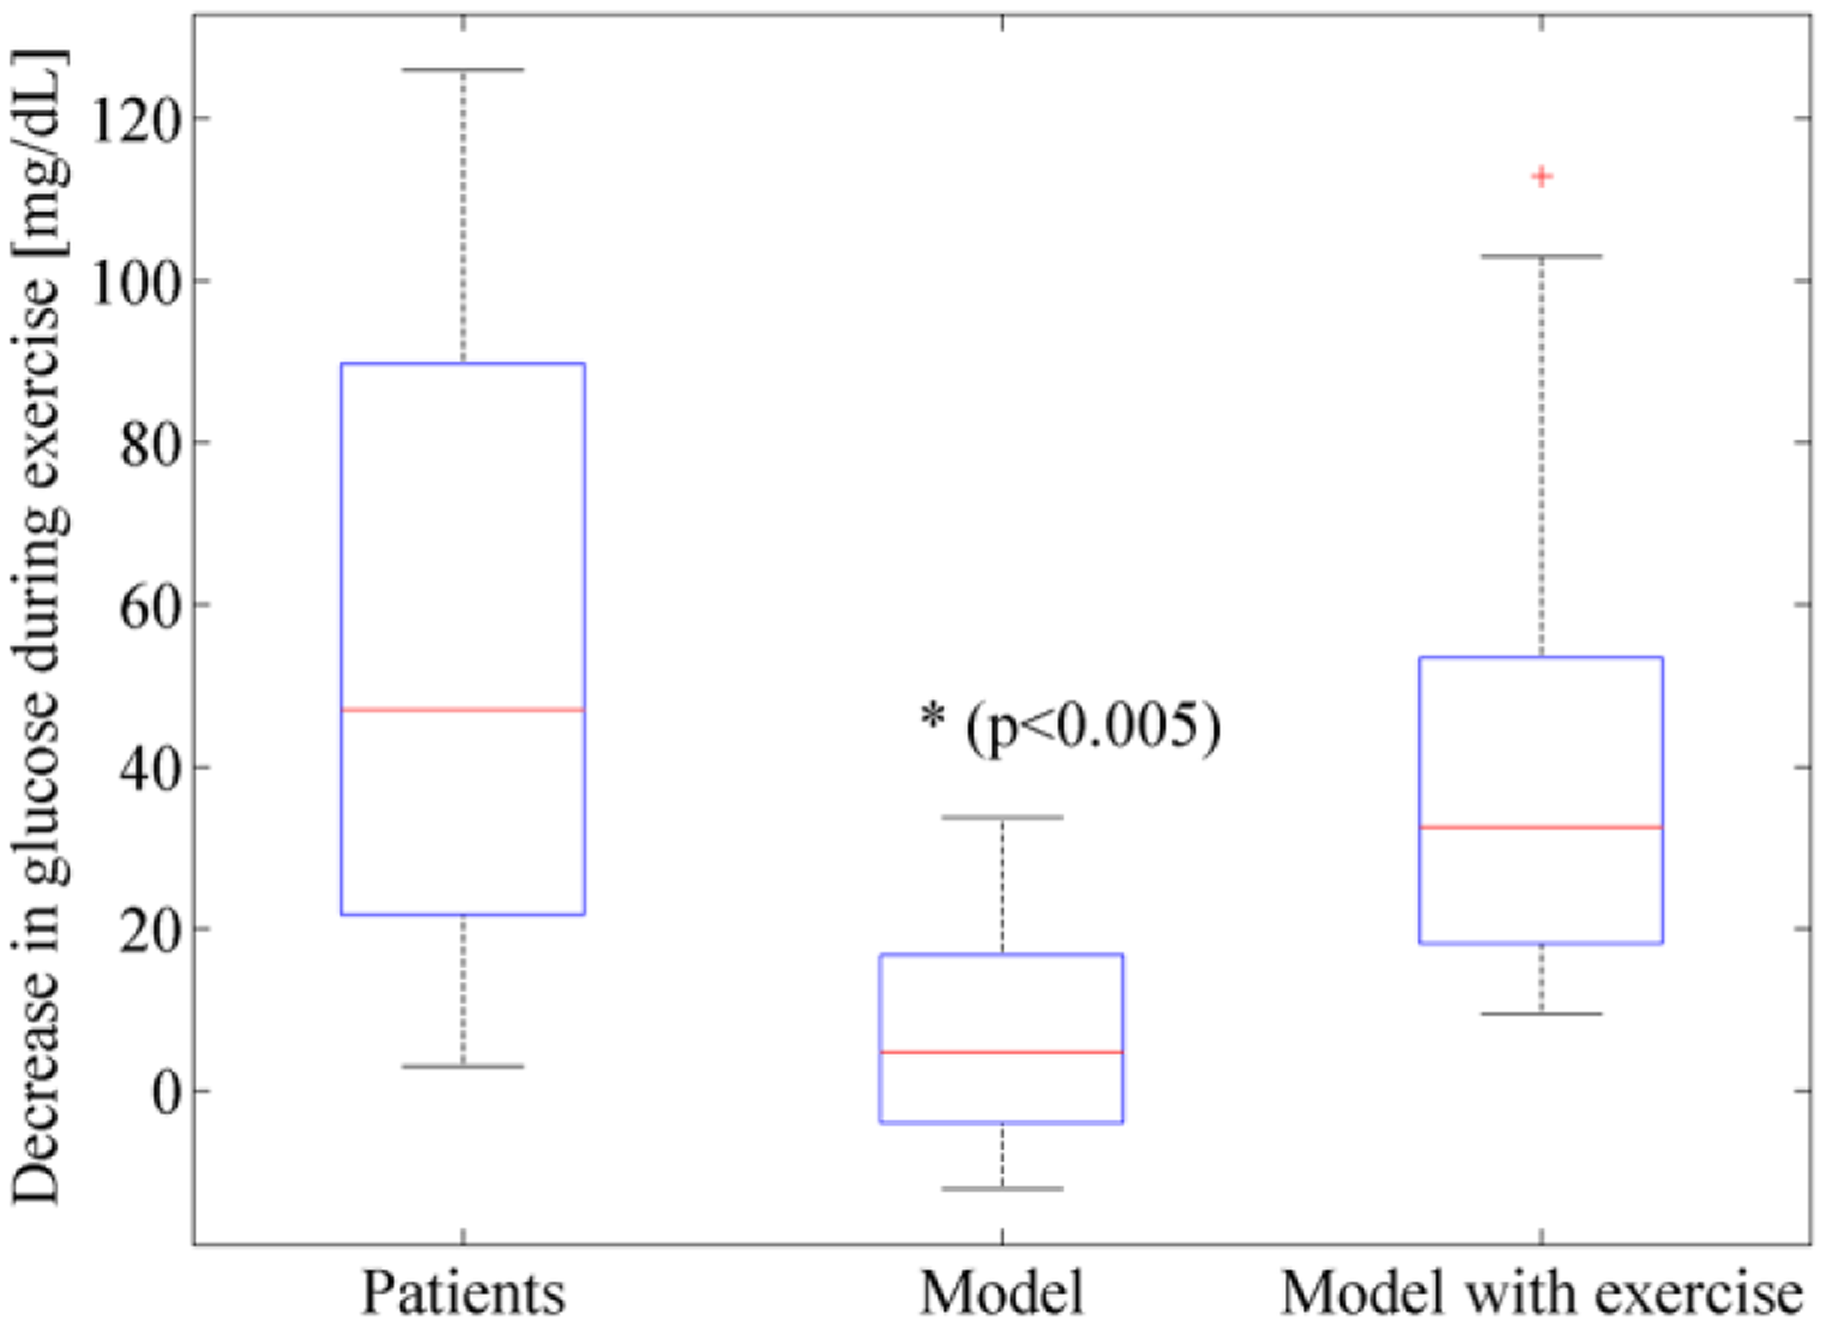
During exercise, patients’ glucose dropped. The glucoregulatory model also showed a drop in glucose, but it was significantly less than the drop measured in patients. When an exercise model was incorporated into the glucoregulatory model, the drop in glucose during exercise was more accurate and not statistically different from the actual drop in glucose.
Drop in Glucose During Exercise.
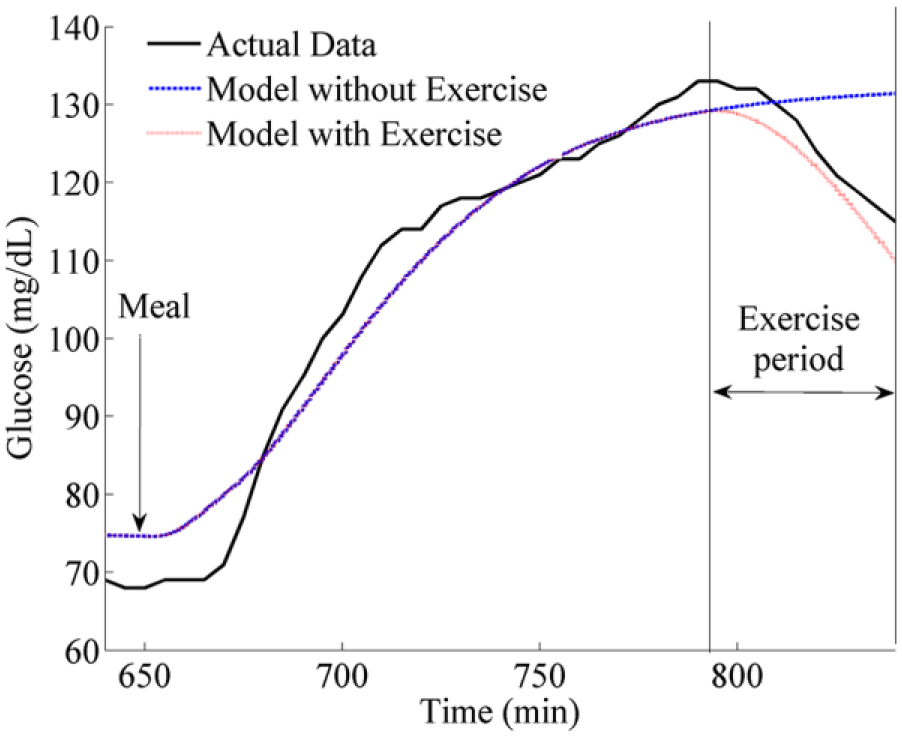
Glucose drop for subject 12 during exercise. Also shown is the model estimation of subject 12’s glucose drop and a trace showing how the model that includes exercise predicts the drop. Notice that when exercise is included in the model, the estimation is closer to the true drop for this subject.
Results of in Silico Testing and Parameter Tuning of Exercise Dosing Algorithm
Multiple clinical scenarios were used during optimization of the algorithm parameters. Each of the insulin and glucagon parameters described in Jacobs et al
12
were optimized as were the parameters for the exercise response model given in Table 1. The outcome measures used to optimize the parameters were in order of priority: (1) minimize time in hypoglycemia, (2) minimize time in hyperglycemia, (3) minimize glucagon delivery, and (4) minimize insulin delivery. As an example of a result of the parameter tuning for the exercise model parameters given in Table 1, we show in Figure 8 how we selected window A and window B (the time periods during which insulin was suspended / reduced, respectively) based on minimizing the amount of insulin and glucagon given during the study and minimizing time spent in hypo/hyperglycemia. The simulation we used to tune the exercise model parameters consisted of the following events: (1) a 60-minute run-in time, (2) a meal of 20 gm carbohydrates (simulated breakfast at 8
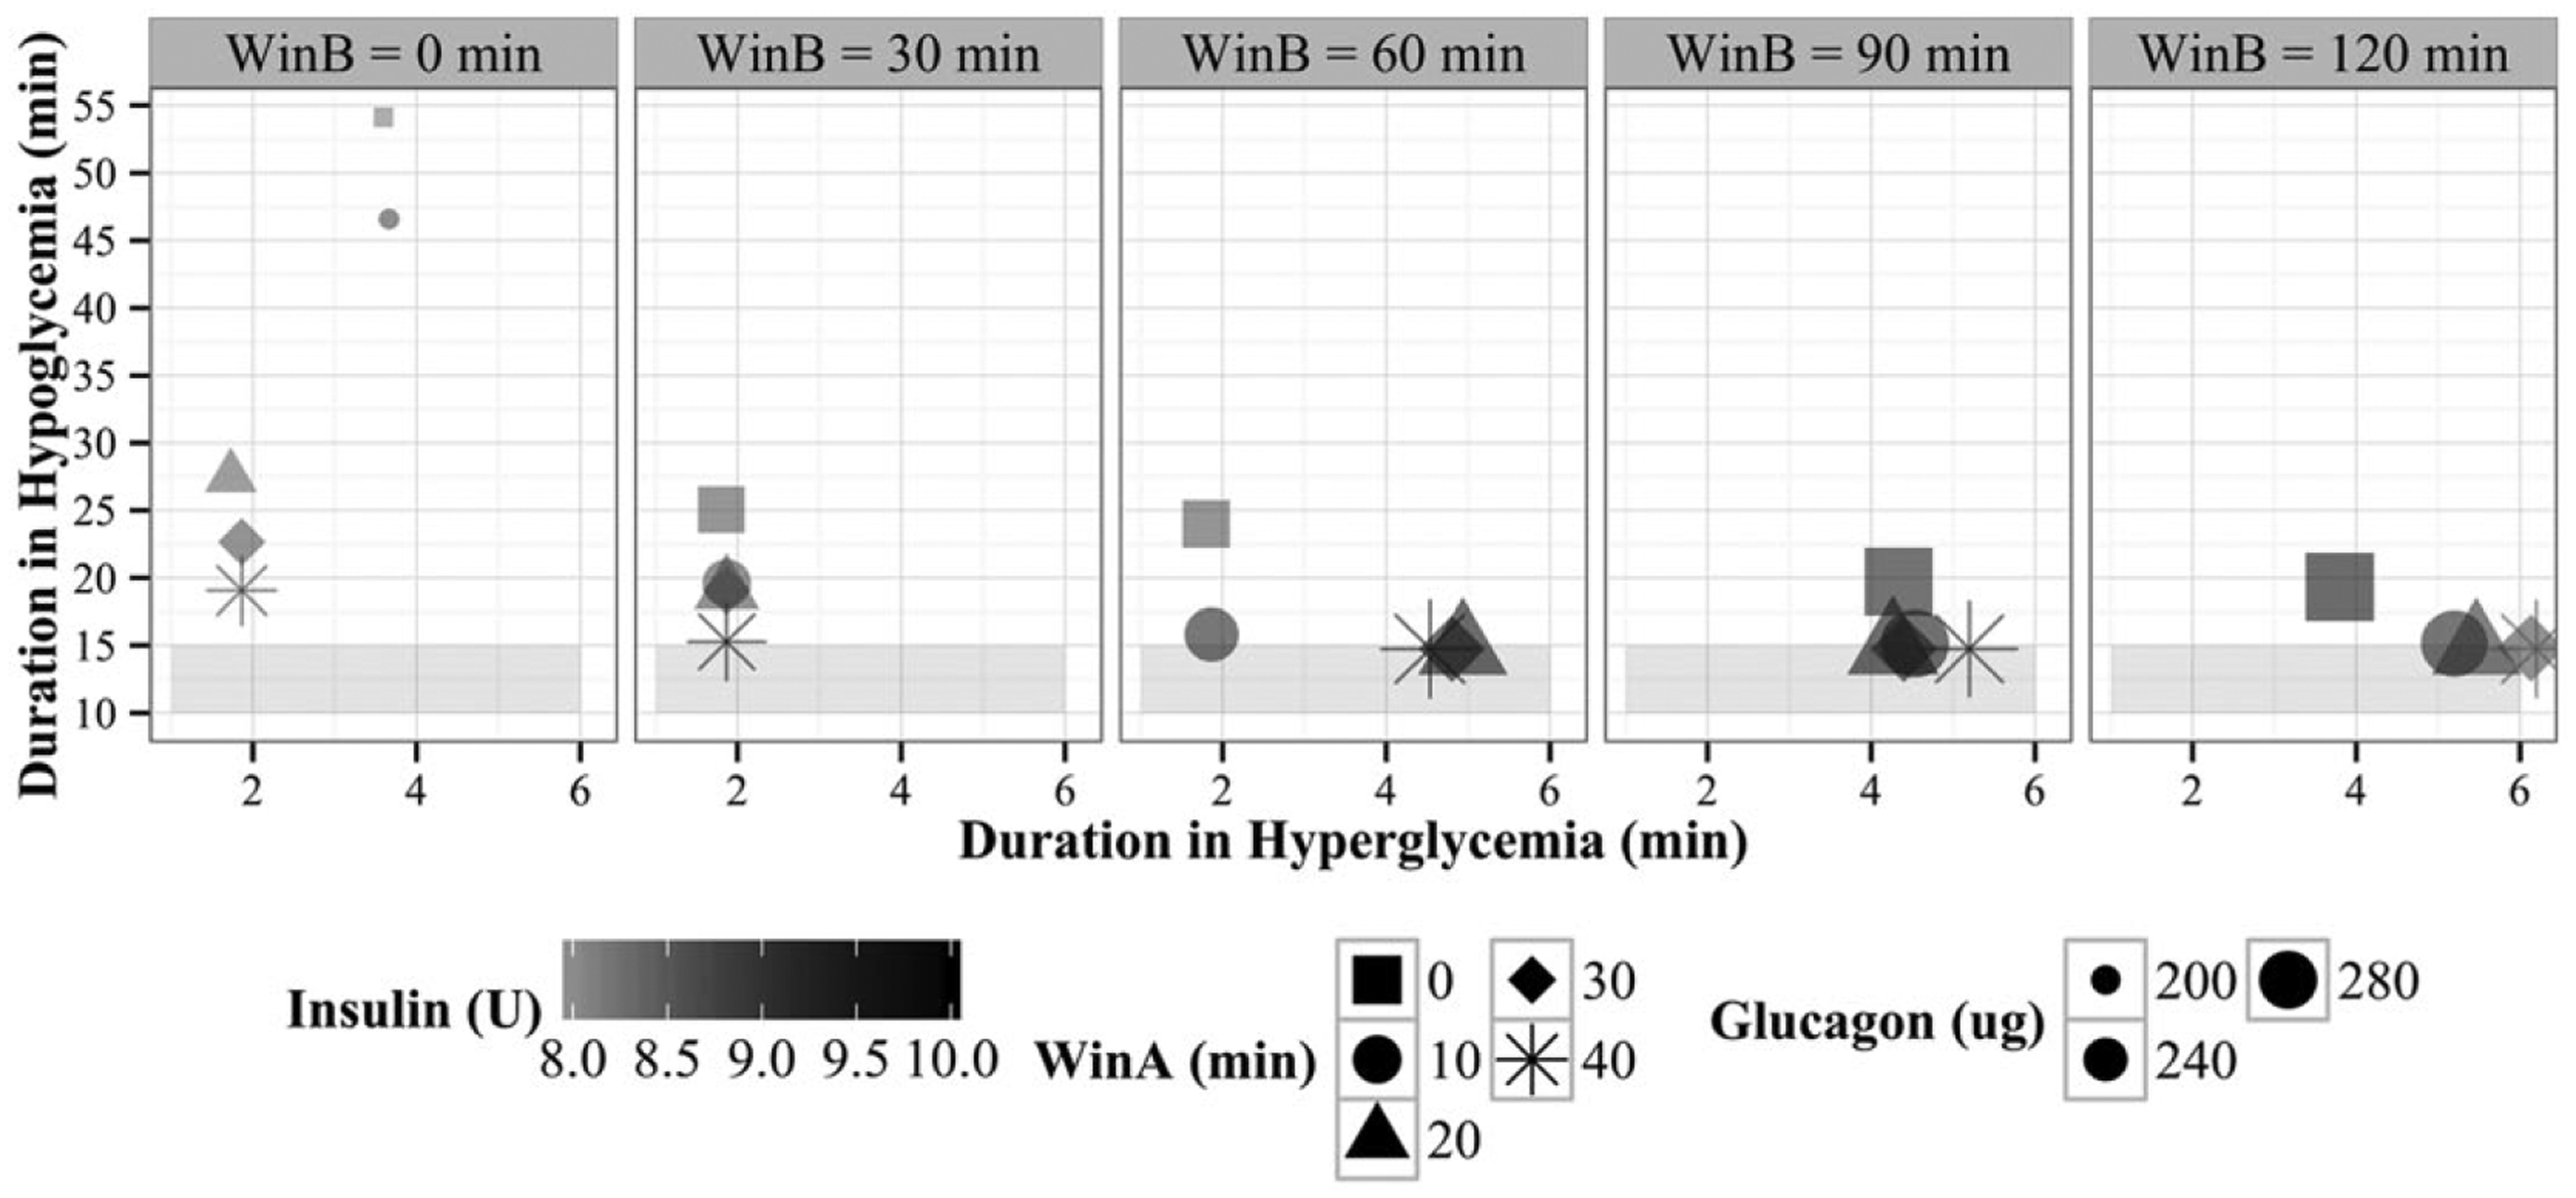
Exercise algorithm parameter optimization results when minimizing time spent in hypoglycemia (y-axis), time spent in hyperglycemia (x-axis), total glucagon delivered (larger shape is more), and total insulin delivered (dark shading is more insulin).
Discussion
In this article we have (1) demonstrated how a validated regression model using heart rate and accelerometer values can be used with a high level of sensitivity and specificity to automatically detect and grade mild aerobic exercise during an open-loop hospital stay for 13 adults with T1D, (2) provided results on the decline in glucose during mild exercise in the setting of T1D, (3) demonstrated the importance of integrating an exercise model into in silico testing paradigms and ultimately model predictive control (MPC) algorithms because of the improved accuracy in estimating glucose decline during mild aerobic exercise, (4) presented a new exercise dosing adjustment algorithm that calls for increased glucagon and decreased insulin if aerobic exercise is either announced or automatically detected, and (5) described a method for tuning the algorithm and presented in silico testing results of use of the algorithm during closed-loop control.
This study confirmed other studies 6 that have shown that even for mild exercise (30-50% of VO2 maximum), glucose can fall rapidly and significantly. Figure 6 shows that the mean drop in glucose was 53 mg/dL. However, there was a wide variation. One subject dropped only 3 mg/dL during the exercise while another subject dropped 126 mg/dL. Such high variability in response to exercise is likely explained by a number of factors including the amount of insulin-on-board, starting glucose, total muscle mass, BMI, age, duration of diabetes, and stress level. Such high variability makes it particularly challenging to adjust dosing during exercise, and future work will need to examine whether such dosing adjustments within an AP system are possible and safe. It is likely that algorithms will need to adapt to the particular patient who is using the AP and respond in a way that accounts for the current environment but also considers prior information that reflects past physiologic responses.
It is important to note the work presented here is only for mild aerobic exercise. Prior work has shown that anaerobic exercise can lead to increases in glucose rather than decreases. 24 Any future exercise detection and grading algorithm will need to accurately disambiguate between aerobic and anaerobic exercise. Future work will also need to examine the effectiveness of the exercise dosing adjustment algorithm presented for moderate and high levels of both aerobic and anaerobic exercise. Finally, the current exercise model presented by Hernandez-Ordonez et al may need to be adjusted to account for longer term impacts of exercise. It has been shown that exercise can lead to hypoglycemic episodes 7-11 hours 25 and in another study 6-15 hours 26 after exercise. Future extensions of exercise models will need to consider both the acute and longer term impacts of exercise on glucose control. A further limitation of this study was with regards to the methods used to run the simulations using a virtual population. Other groups have published articles describing the method of fitting physiologic data to models to create a virtual patient populations for running simulations including those by Haidar et al 27 and Wilinska et al, 22 for example. While each of the individual models used for insulin kinetics, insulin dynamics, carbohydrate absorption, and exercise have been validated independently, there has not yet been an extensive validation of these models together to form a virtual patient population. However, in a recent publication by our group, 28 we used a similar method of generating a virtual patient population by fitting physiologic data to the model, and in that article we included an appendix showing the residuals from the model fits to demonstrate that the model fit. A further limitation of our modeling is that we did not account for the time-varying nature of the model parameters. For example, Visentin et al 29 recently showed that insulin sensitivity changes differently for various subjects during the course of a 24-hour period. In the future, we will need to account for the circadian variability of the model parameters, especially insulin sensitivity. Finally, we acknowledge that that the models that we used model the influence of exercise on glucose uptake and production limited to insulin dependent terms only. In the future, we will explore how exercise impacts the non-insulin-dependent terms in the model.
Conclusions
Automated detection and grading of exercise is possible with a high degree of accuracy, at least within an in-hospital setting, using a previously validated regression algorithm. Automating the adjustment of insulin and glucagon dosing in response to exercise is important within an AP system to prevent hypoglycemia. Current exercise models will be critical in supporting such automated detection and dosing.
Footnotes
Abbreviations
ANN, artificial neural network; AP, artificial pancreas; CGM, continuous glucose meter; EE, energy expenditure; EGP, endogenous glucose production; GIR, glucagon infusion rate; HGP, hepatic glucose production; HR, heart rate; IIR, insulin infusion rate; MPC, model predictive control; PA, physical activity; PAMM, percentage active muscle mass; PGU, peripheral glucose uptake; PIU, peripheral insulin uptake; PVO2max, maximum percentage VO2; T1D, type 1 diabetes; fading memory proportional derivative,(FMPD).
Declaration of Conflicting Interests
The author(s) declared the following potential conflicts of interest with respect to the research, authorship, and/or publication of this article: PGJ and JC have a financial interest in Pacific Diabetes Technologies Inc, a company that may have a commercial interest in the results of this research and technology. This potential conflict of interest has been reviewed and managed by OHSU.
Funding
The author(s) disclosed receipt of the following financial support for the research, authorship, and/or publication of this article: This work was supported by grants from the National Institutes of Health (NIH) (grant 1DP3DK101044). This publication was also supported by Oregon Clinical and Translational Research Institute (OCTRI), grant number UL1TR000128, from the National Center for Advancing Translational Sciences (NCATS) at the NIH. The content is solely the responsibility of the authors and does not necessarily represent the official views of the NIH.