
Abstract
Background:
Exposure to extreme temperature can affect the performance of blood glucose monitoring systems. The aim was to determine the non-equilibrated performance of these systems at extreme high and low temperatures that can occur in daily life.
Methods:
The performances of 5 test systems, (1) Abbott FreeStyle Freedom Lite, (2) Roche AccuChek Aviva, (3) Bayer Contour, (4) LifeScan OneTouch Verio, and (5) Sanofi BG Star, were compared after “cooking” (50°C for 1 hour) or “chilling” (−5°C for 1 hour) with room temperature controls (23°C) using whole blood with glucose concentrations of 50, 100, and 200 mg/dl.
Results:
The equilibration period (time from the end of incubation to when the test system is operational) was between 1 and 8 minutes, and each test system took between 15 and 30 minutes after incubation to obtain stable measurements at room temperature. Incubating the strips at −5°C or 50°C had little effect on the glucose measurement, whereas incubating the meters introduced bias in performance between 0 and 15 minutes but not subsequently, compared to room temperature controls and at all 3 glucose levels.
Conclusions:
Compensating technologies embedded within blood glucose monitoring systems studied here perform well at extreme temperatures. People with diabetes need to be alerted to this feature to avoid perceptions of malperformance of their devices and the possible inability to get blood glucose readings on short notice (eg, during time of suspected rapid change or before an unplanned meal).
Keywords
The year 2014 was the warmest across global land and ocean surfaces since record keeping began in 1880. 1 Changes in environmental temperature can adversely affect people living with diabetes with higher numbers of emergency department visits, hospitalizations, and mortality during hot weather. Numerous studies have also reported higher HbA1c levels occur during the colder months. 2 Furthermore, in real life people often store their medicines in areas exposed to extreme temperatures such as in a motor car during the summer or in the hold of an aircraft where the ambient temperature can be very cold. In both situations extreme temperatures can adversely affect the action of medical therapies. 3 In diabetes care, for example, exposure to elevated temperatures can induce conformational changes to the insulin, promoting precipitation, chemical degradation, and fibrillation impairing insulin action. 4
The analytical quality of blood glucose monitoring systems can also be affected by environmental conditions especially the prevailing temperature and humidity 5 as well as rapid shifts in ambient temperature. 6 Currently, most manufacturers of blood glucose monitoring systems recommend operating temperature ranges between 4 and 40°C. However in areas such as the Middle East, where there is a very high prevalence of individuals with diabetes, their diabetes monitoring equipment may be exposed to very high temperatures, 7 with the risk that storage circumstances of blood glucose monitoring equipment might impact on device performance. In less extreme environments, even leaving a meter in a car during summer months can also expose the device to temperatures 20°C above the outside temperature, or well below freezing during winter.8,9 Most modern meters have lockout systems that prevent an inaccurate blood glucose value being obtained if the surrounding temperature is out with the manufacturers recommended range. Under these circumstances, manufacturers recommend that the test system placed at ambient temperature until the desired operating temperature is reached for example, if the user trying to test outside on a cold day (temperature 0°C) the low temperature warning will appear and they will not be able to test, if the user returns indoors with the meter as the meter will acclimatizes to the room temperature, as soon as the temperature probe detects the test system is with the temperature range it will allow the user to perform a test. The purpose of this study is to determine how the glucose measurement obtained from the test system change as the test systems acclimatize from extreme temperature to room temperature. In addition, this study looks at the effect of temperature acclimatization on both the test strips and test meters in isolation.
Methods
Blood Glucose Meters
The following 5 test systems were evaluated in this study as they are representative of the different test systems currently on the market: (1) Abbott FreeStyle Freedom Lite, (2) Roche AccuChek Aviva, (3) Bayer Contour, (4) LifeScan OneTouch Verio, and (5) Sanofi BG Star. Meters (15 for each manufacturer) and test strips (one batch from each manufacturer) were purchased from pharmacies; a single batch or lot of test strips was evaluated in this study to eliminate batch to batch test strip variability.
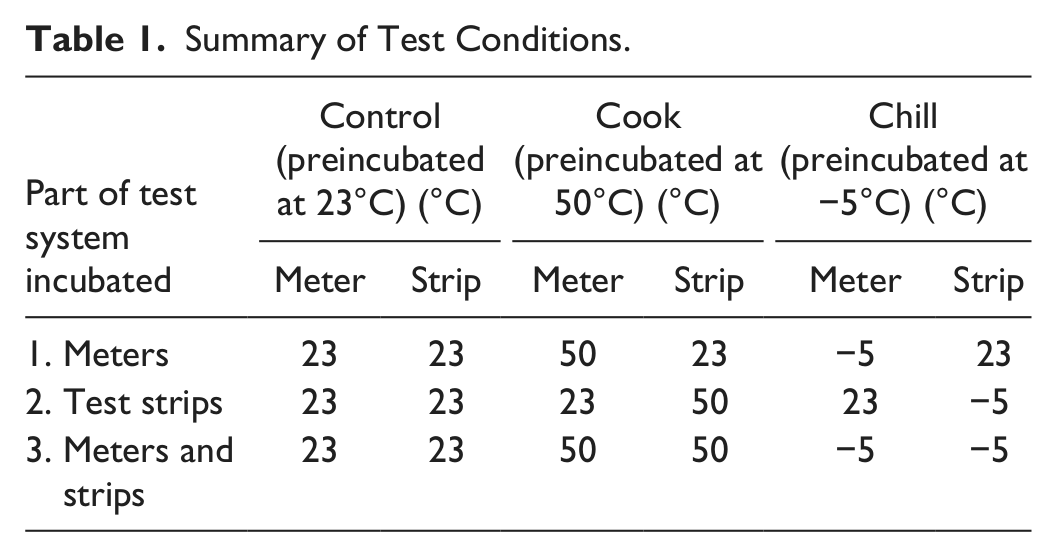
Prior to each test, a quality check was performed using the manufacturers’ guidelines. Briefly, a QC solution test was performed using each meter to ensure they were operating correctly; if a meter failed the QC test it was replaced. Meters were then randomly assigned a test condition (Table 1): cook (n = 5) (part or all of the blood glucose test system was incubated at 50°C for 1 hour before testing), chill (n = 5) (part or all of the blood glucose test system was incubated at −5°C for 1 hour before testing), or control (n = 5) (part or all of the blood glucose test system was incubated at 23°C). Individual meters were kept at this condition for the duration of the study, so that meters were not damaged by using a different condition.
Summary of Test Conditions.
Temperature Lockout Feature Determination
The temperature lockout threshold was determined for both the upper and lower temperature limits of each test system (Figure 1). The upper temperature limit (TH) was determined by placing the test systems in an environmental chamber (VC0018, Vötsch Industrietechnik) incrementally increasing the temperature (by 1°C) from ambient up to 50°C. After each increase in temperature a test strip was inserted into the meter to determine if the meter would allow a measurement. TH was defined at the first temperature at which the meter would not allow a measurement and a high temperature error message was displayed. Similarly, the lower temperature limit (TL) was determined by incrementally decreasing the temperature from ambient down to −5°C in the environmental chamber. After each decrease in temperature a test strip was inserted into the meter to determine if the meter would allow a measurement. TL was defined at the first temperature at which the meter would not allow a measurement and a low temperature error message was recorded
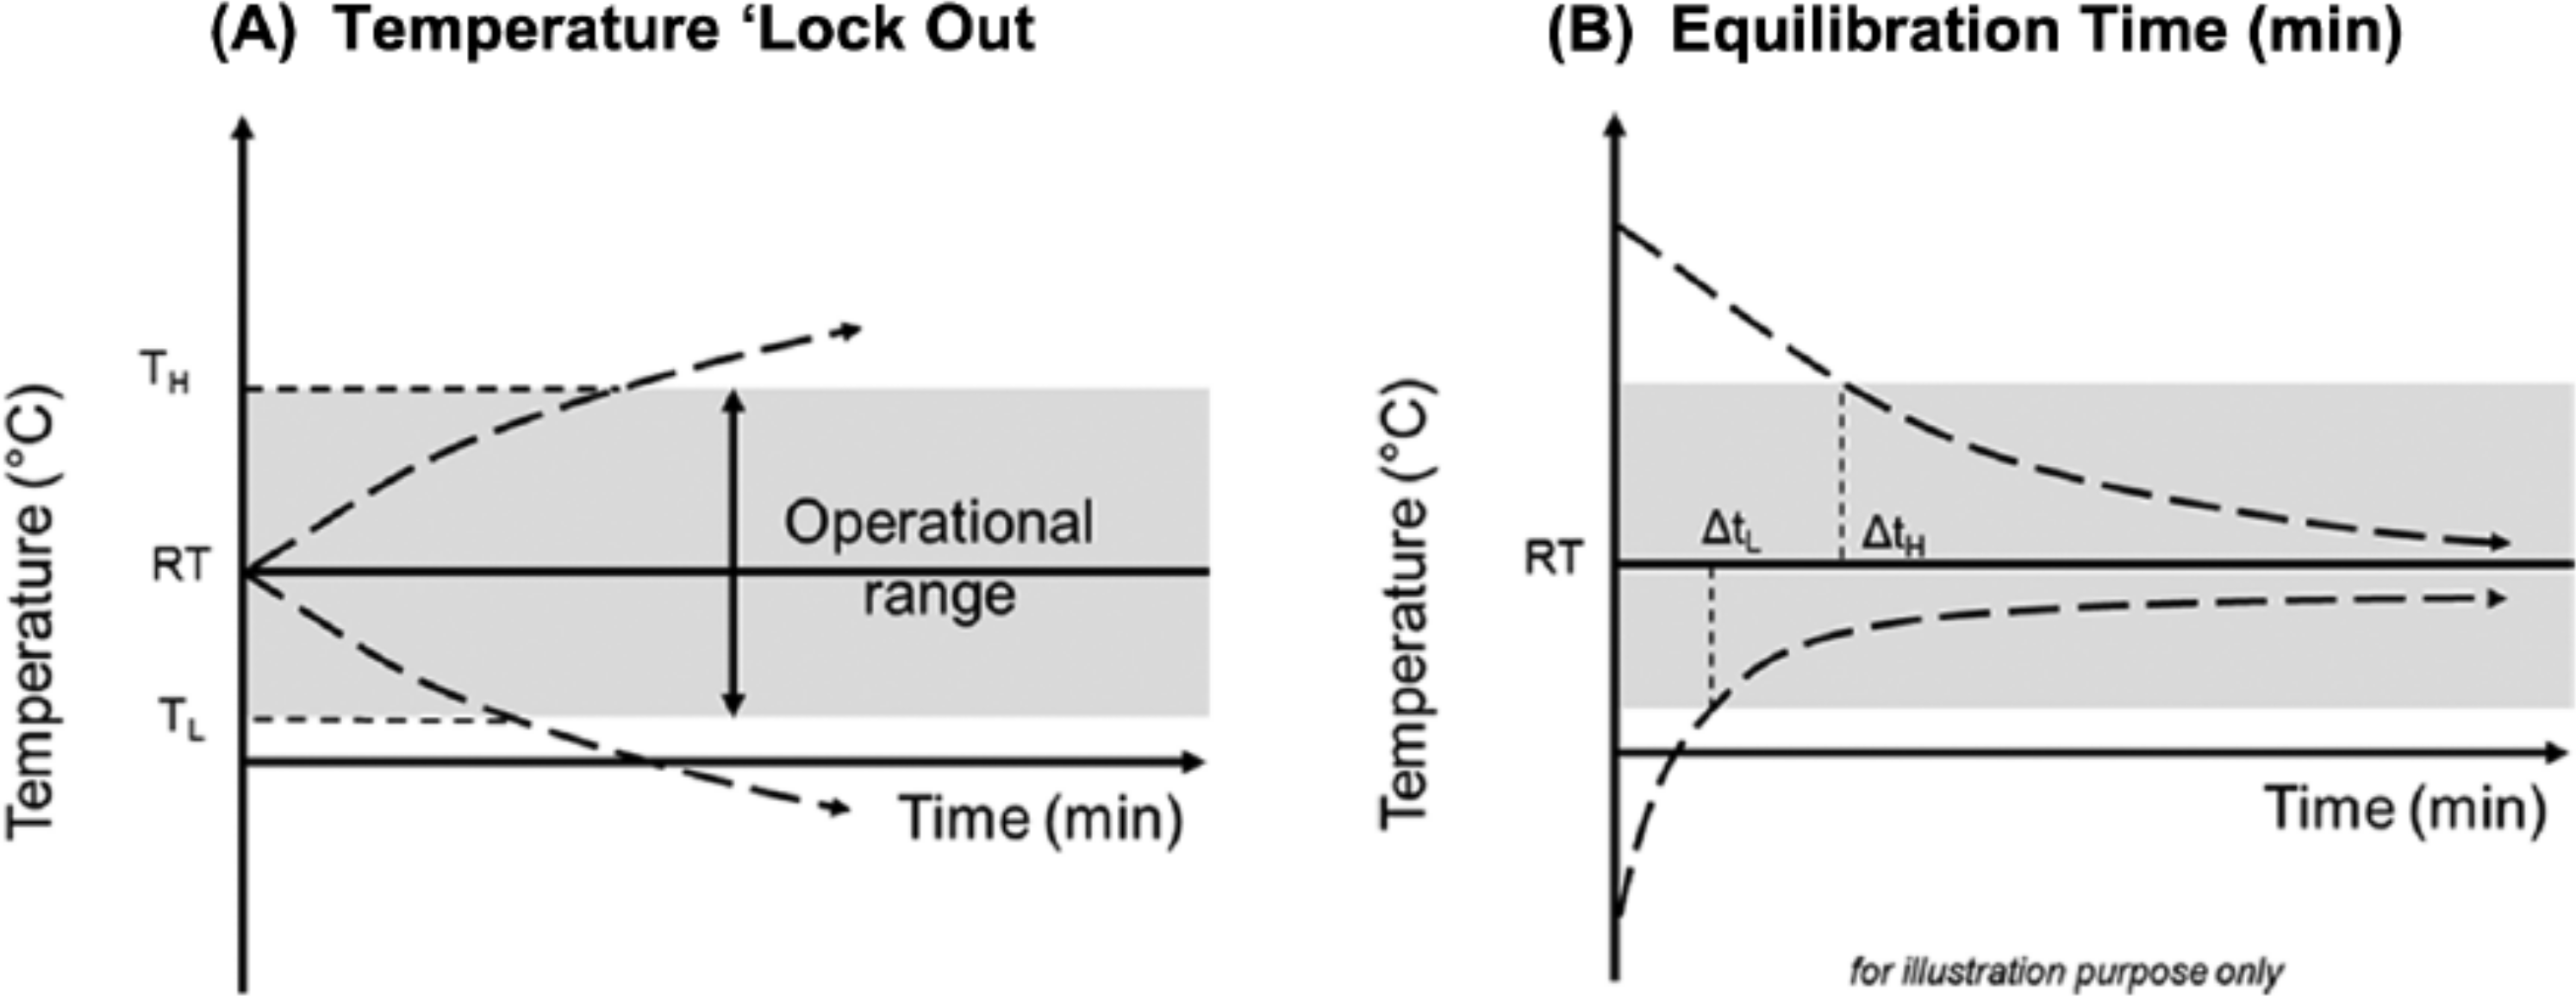
Illustration of temperature lockout feature and equilibration times. (A) Illustrates the temperature lockout feature (TH = high temperature; TL = low temperature). (B) Illustrates equilibration period (ΔtH = high temperature; ΔtL = low temperature).
Equilibration Period Determination
The equilibration period was determined as the time taken for a blood glucose meter to disable the temperature lockout feature/notification from the extreme test conditions (−5 or 50°C) and display a glucose result (Figure 1). The upper temperature (ΔtH ) equilibration period was determined by preincubating the test systems at 50°C for 1 hour, in the environmental chamber (temp: 50°C ± 1, RH: 50%) before transfer to benchtop conditions (temp: 23°C ± 2, RH: 50% ± 5); test strips were inserted into the meter repeatedly until the high temperature error was not displayed. ΔtH was the time taken for the meter to allow a measurement to be taken.
In the same manner, the lower temperature equilibration period (ΔtL) was determined by preincubating the test systems at −5°C for 1 hour in the environmental chamber (temp: −5°C ± 1, RH: 50%) before transfer to benchtop conditions (temp: 23°C ± 2, RH: 50% ± 5); test strips were inserted into the meter repeatedly until the low temperature error was not displayed. ΔtL was the time taken for the meter to allow a measurement to be taken.
Blood Sample Preparation
Venous blood samples from healthy volunteers were collected into heparinized vacutainers. Native glucose concentrations of the blood samples were measured using an YSI 2300 STAT Plus Glucose Analyzer (YSI Instruments, Yellow Springs, OH). From each blood sample was manipulated to 3 clinically relevant glucose concentrations: 50, 100, and 200 mg/dl. A blood sample was placed into a water bath at 37°C to accelerate glycolysis and thus reduce the glucose level to 50 mg/dl. Two further blood samples were prepared, by addition of a glucose solution, with concentrations of 100 mg/dl and 200 mg/dl. After preparation, the glucose concentration of each blood sample was confirmed using the YSI 2300.
In separate experiments, test strips, meters, and both test strips and meters were preincubated for 1 hour in an environmental chamber at low temperature (−5 ± 1°C, RH: 50%) or high (50 ± 1°C, RH: 50%) or on the benchtop (23 ± 2°C, RH: 50 ± 5%) as per Table 1, before being transferred to the benchtop (temp: 23 ± 2°C, RH: 50 ± 5%). As soon as the temperature lockout feature was disabled on meters that were preincubated at extreme temperatures, blood samples were applied to sequentially to each meter at the following time points: 0, 2, 5, 15, 30 minutes after temperature lock disabled.
Data were plotted as bias to control (ambient temperature, 23°C) glucose measurement, over time, for each test system and for each temperature condition.
Results
The temperature lockout ranges determined by this study, for each of the blood glucose test systems, are shown in Table 2; manufacturers’ operating ranges are also shown. All test systems with the exception of the Abbott FreeStyle were unable to perform a test when the test system was out with the temperature range. The Abbott FreeStyle Freedom Lite system does not have a temperature lockout, therefore the test system will allow tests to be performed with the temperature range, but the symbol is present to notify the user that the test system is operating out of the temperature range.
Temperature Lockout and Equilibration Times.
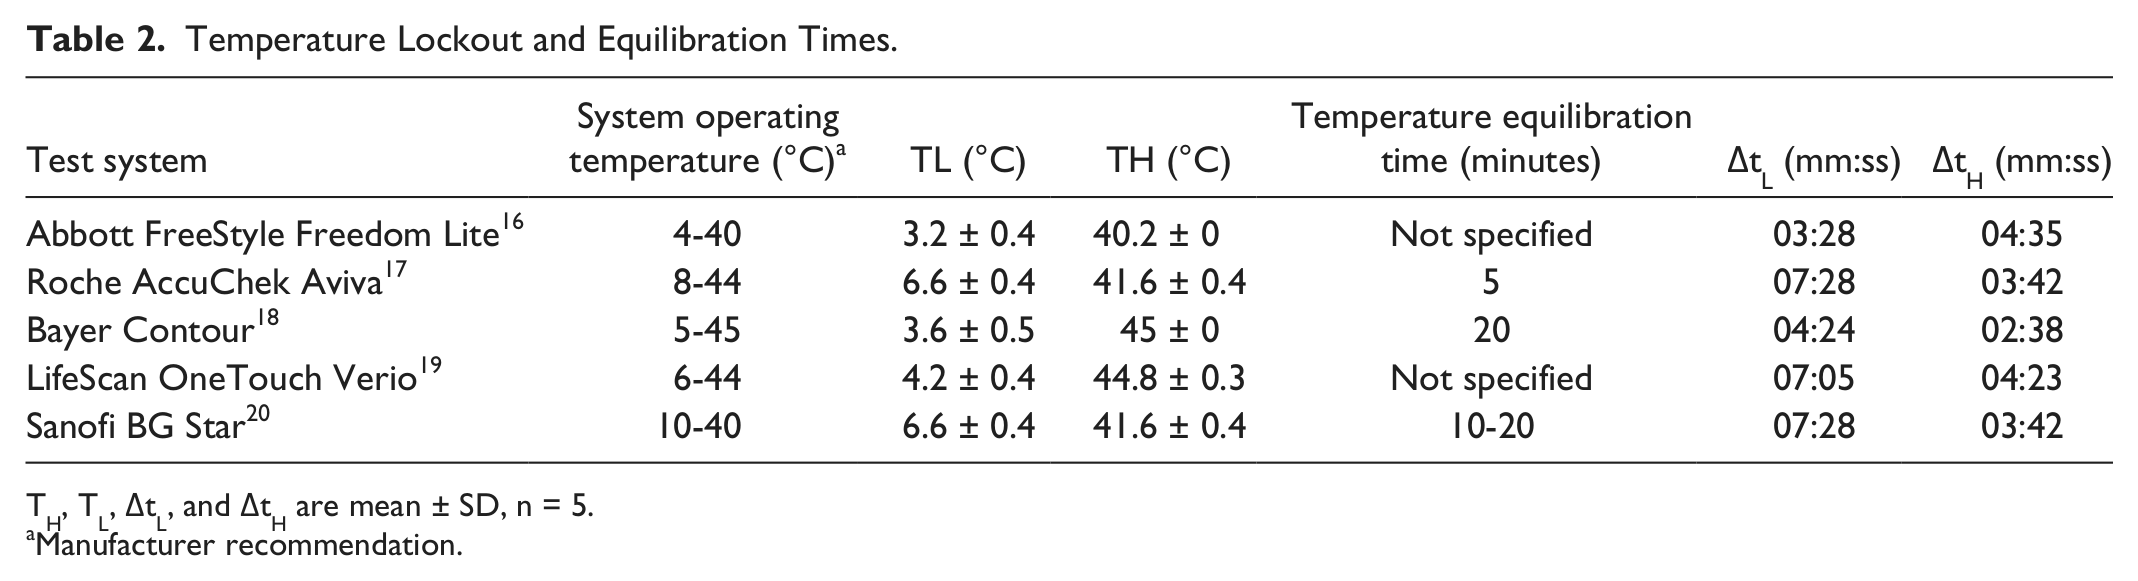
TH, TL, ΔtL, and ΔtH are mean ± SD, n = 5.
Manufacturer recommendation.
The equilibration periods (time taken for a blood glucose meter to disable the temperature lockout feature and display a glucose result after incubation) for each of the blood glucose test meter systems are shown in Table 2. As the Abbott FreeStyle Freedom Lite test system does not have a lockout feature, the equilibration period is defined as the time taken for the temperature symbol to disappear from the display after incubation. Equilibration period (the time from end of incubation to when the test system is operational) is between 1 and 8 minutes depending on the test systems (Figure 1 and Table 2). Each test system takes between 15 and 30 minutes after incubation to obtain measurements stable with the room temperature (23°C) (Figures 2-6).
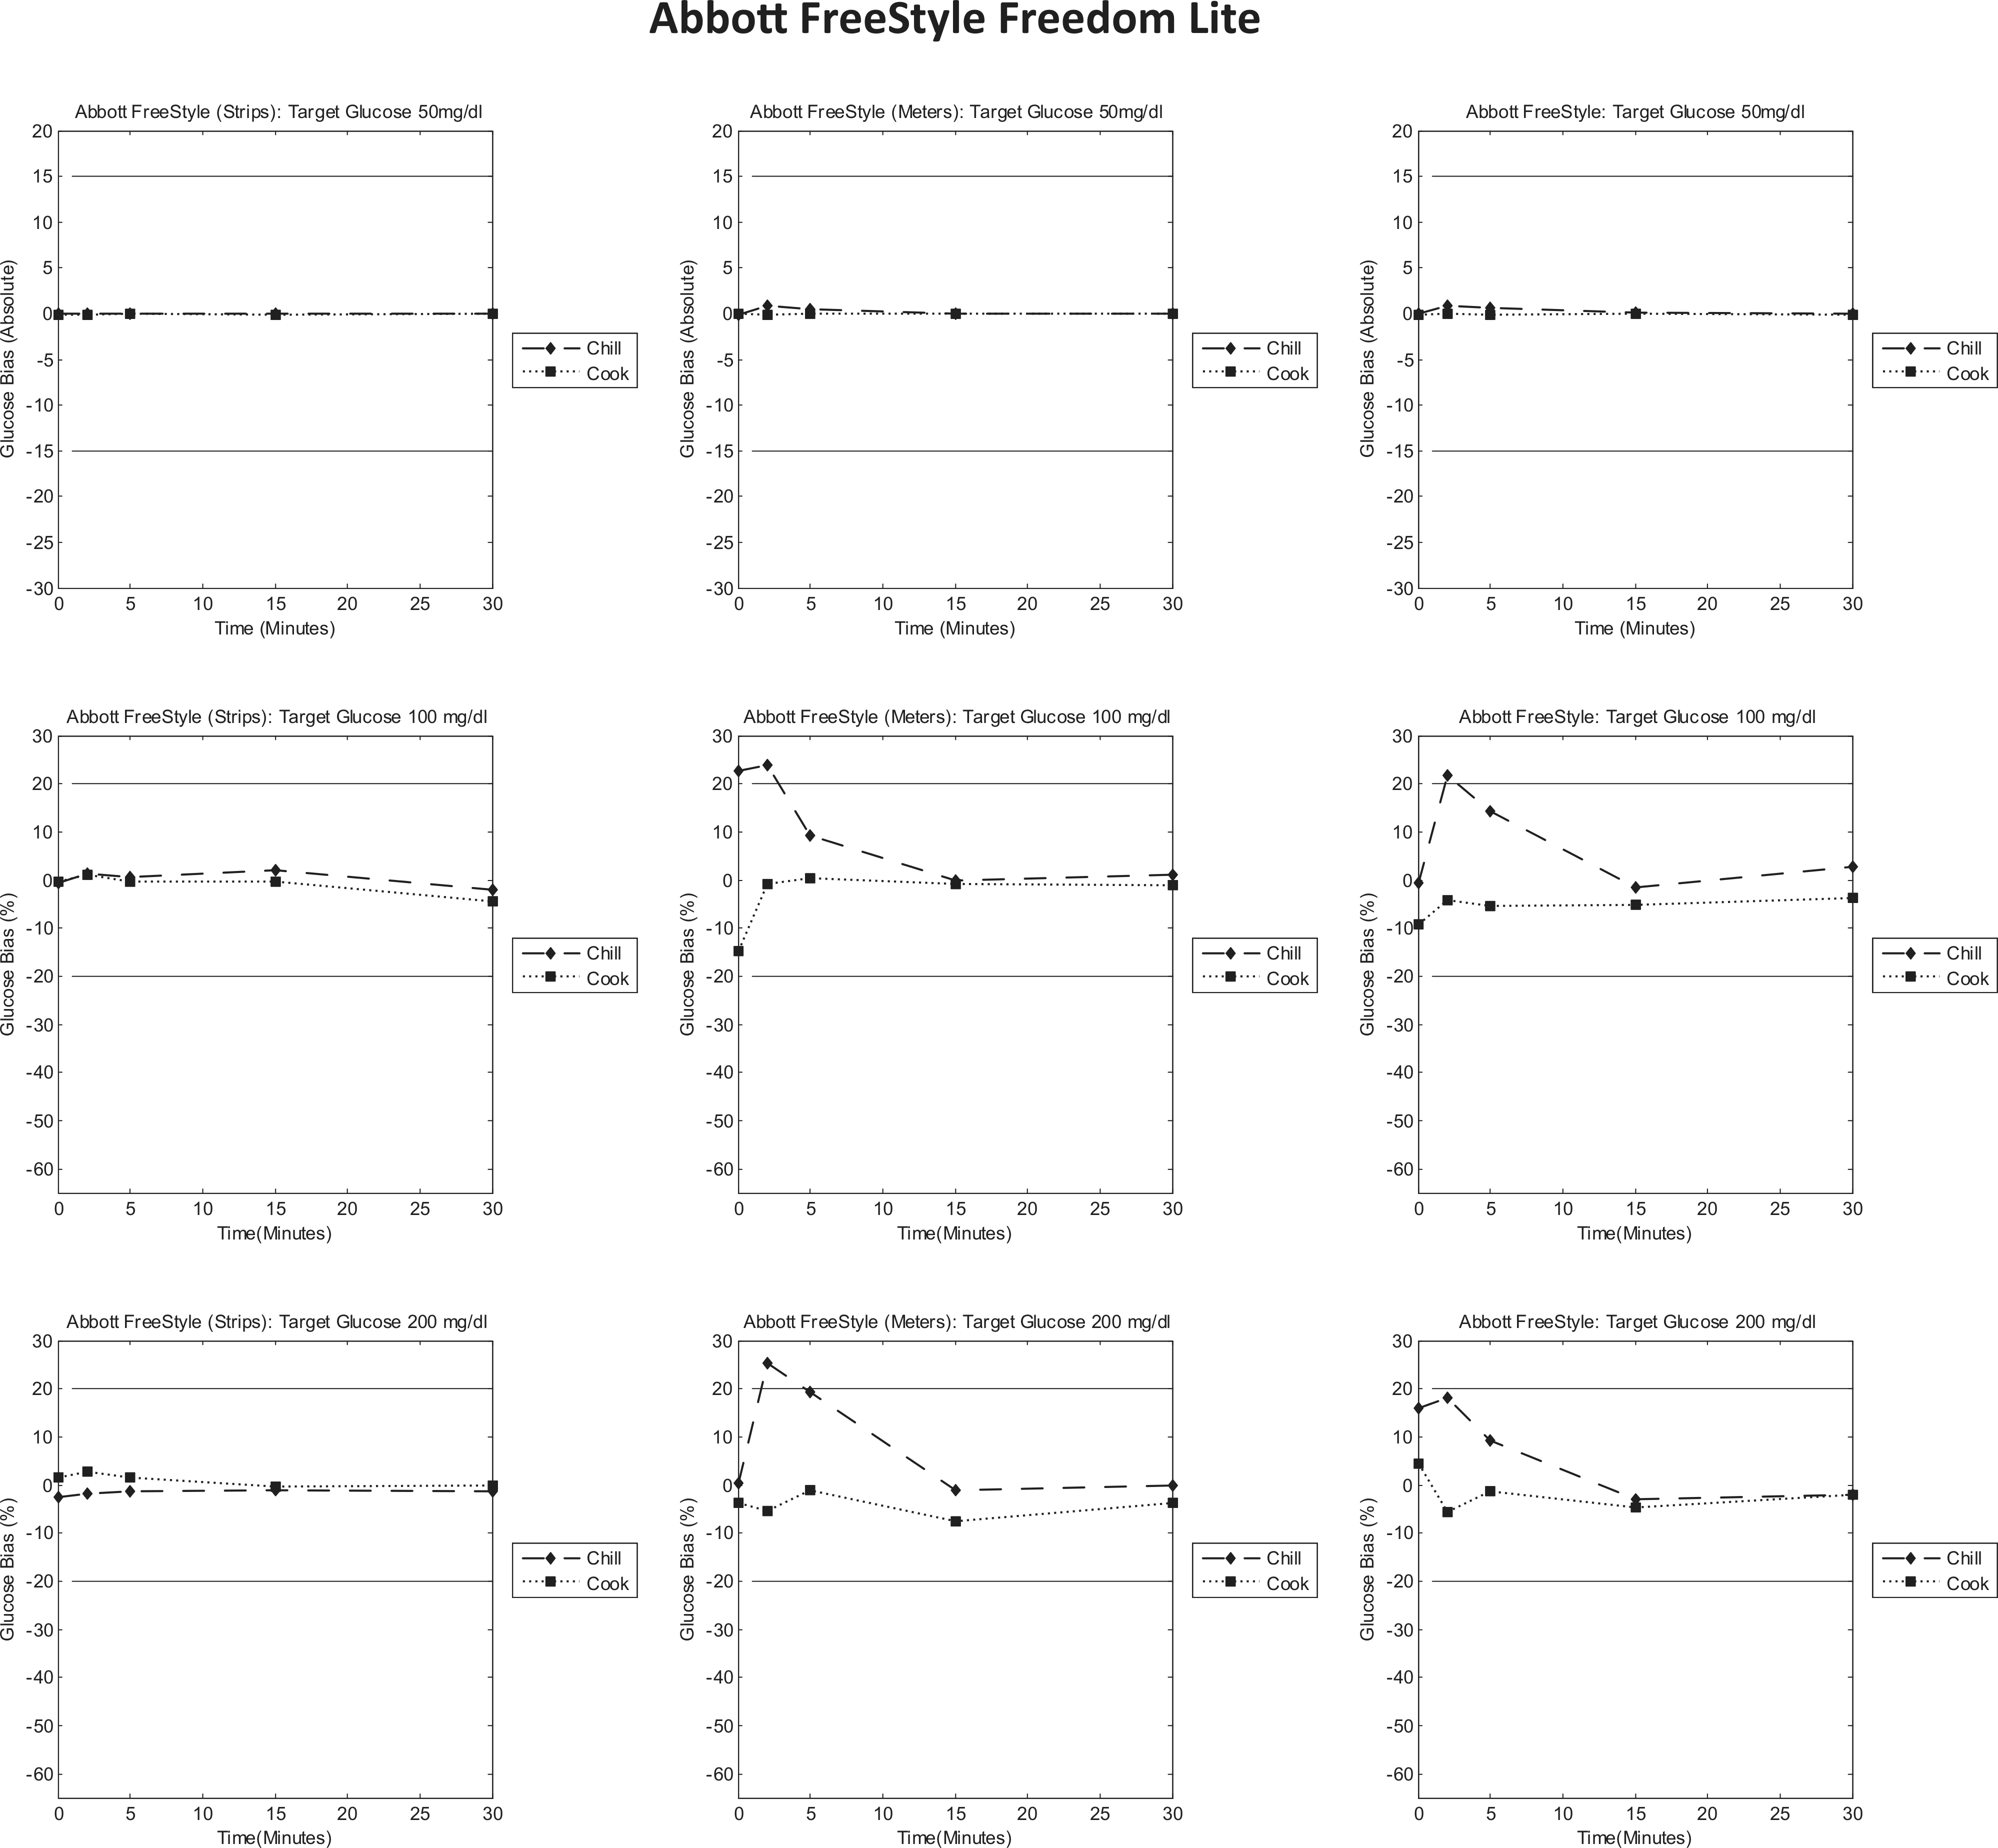
Abbott FreeStyle Freedom Lite bias to control plots. Each column represents individual tests (strips/meters/test system); each row represents a target glucose level (50/100/200 mg/dl). Each graph is a bias plot versus the control condition (room temperature). The dotted lines (squares) represent the cook test condition, and the dashed lines (diamonds) represent the chill test condition. The black limit lines are ±15 mg/dl at 50 mg/dl and ±20% at 100 and 200 mg/dl. 20
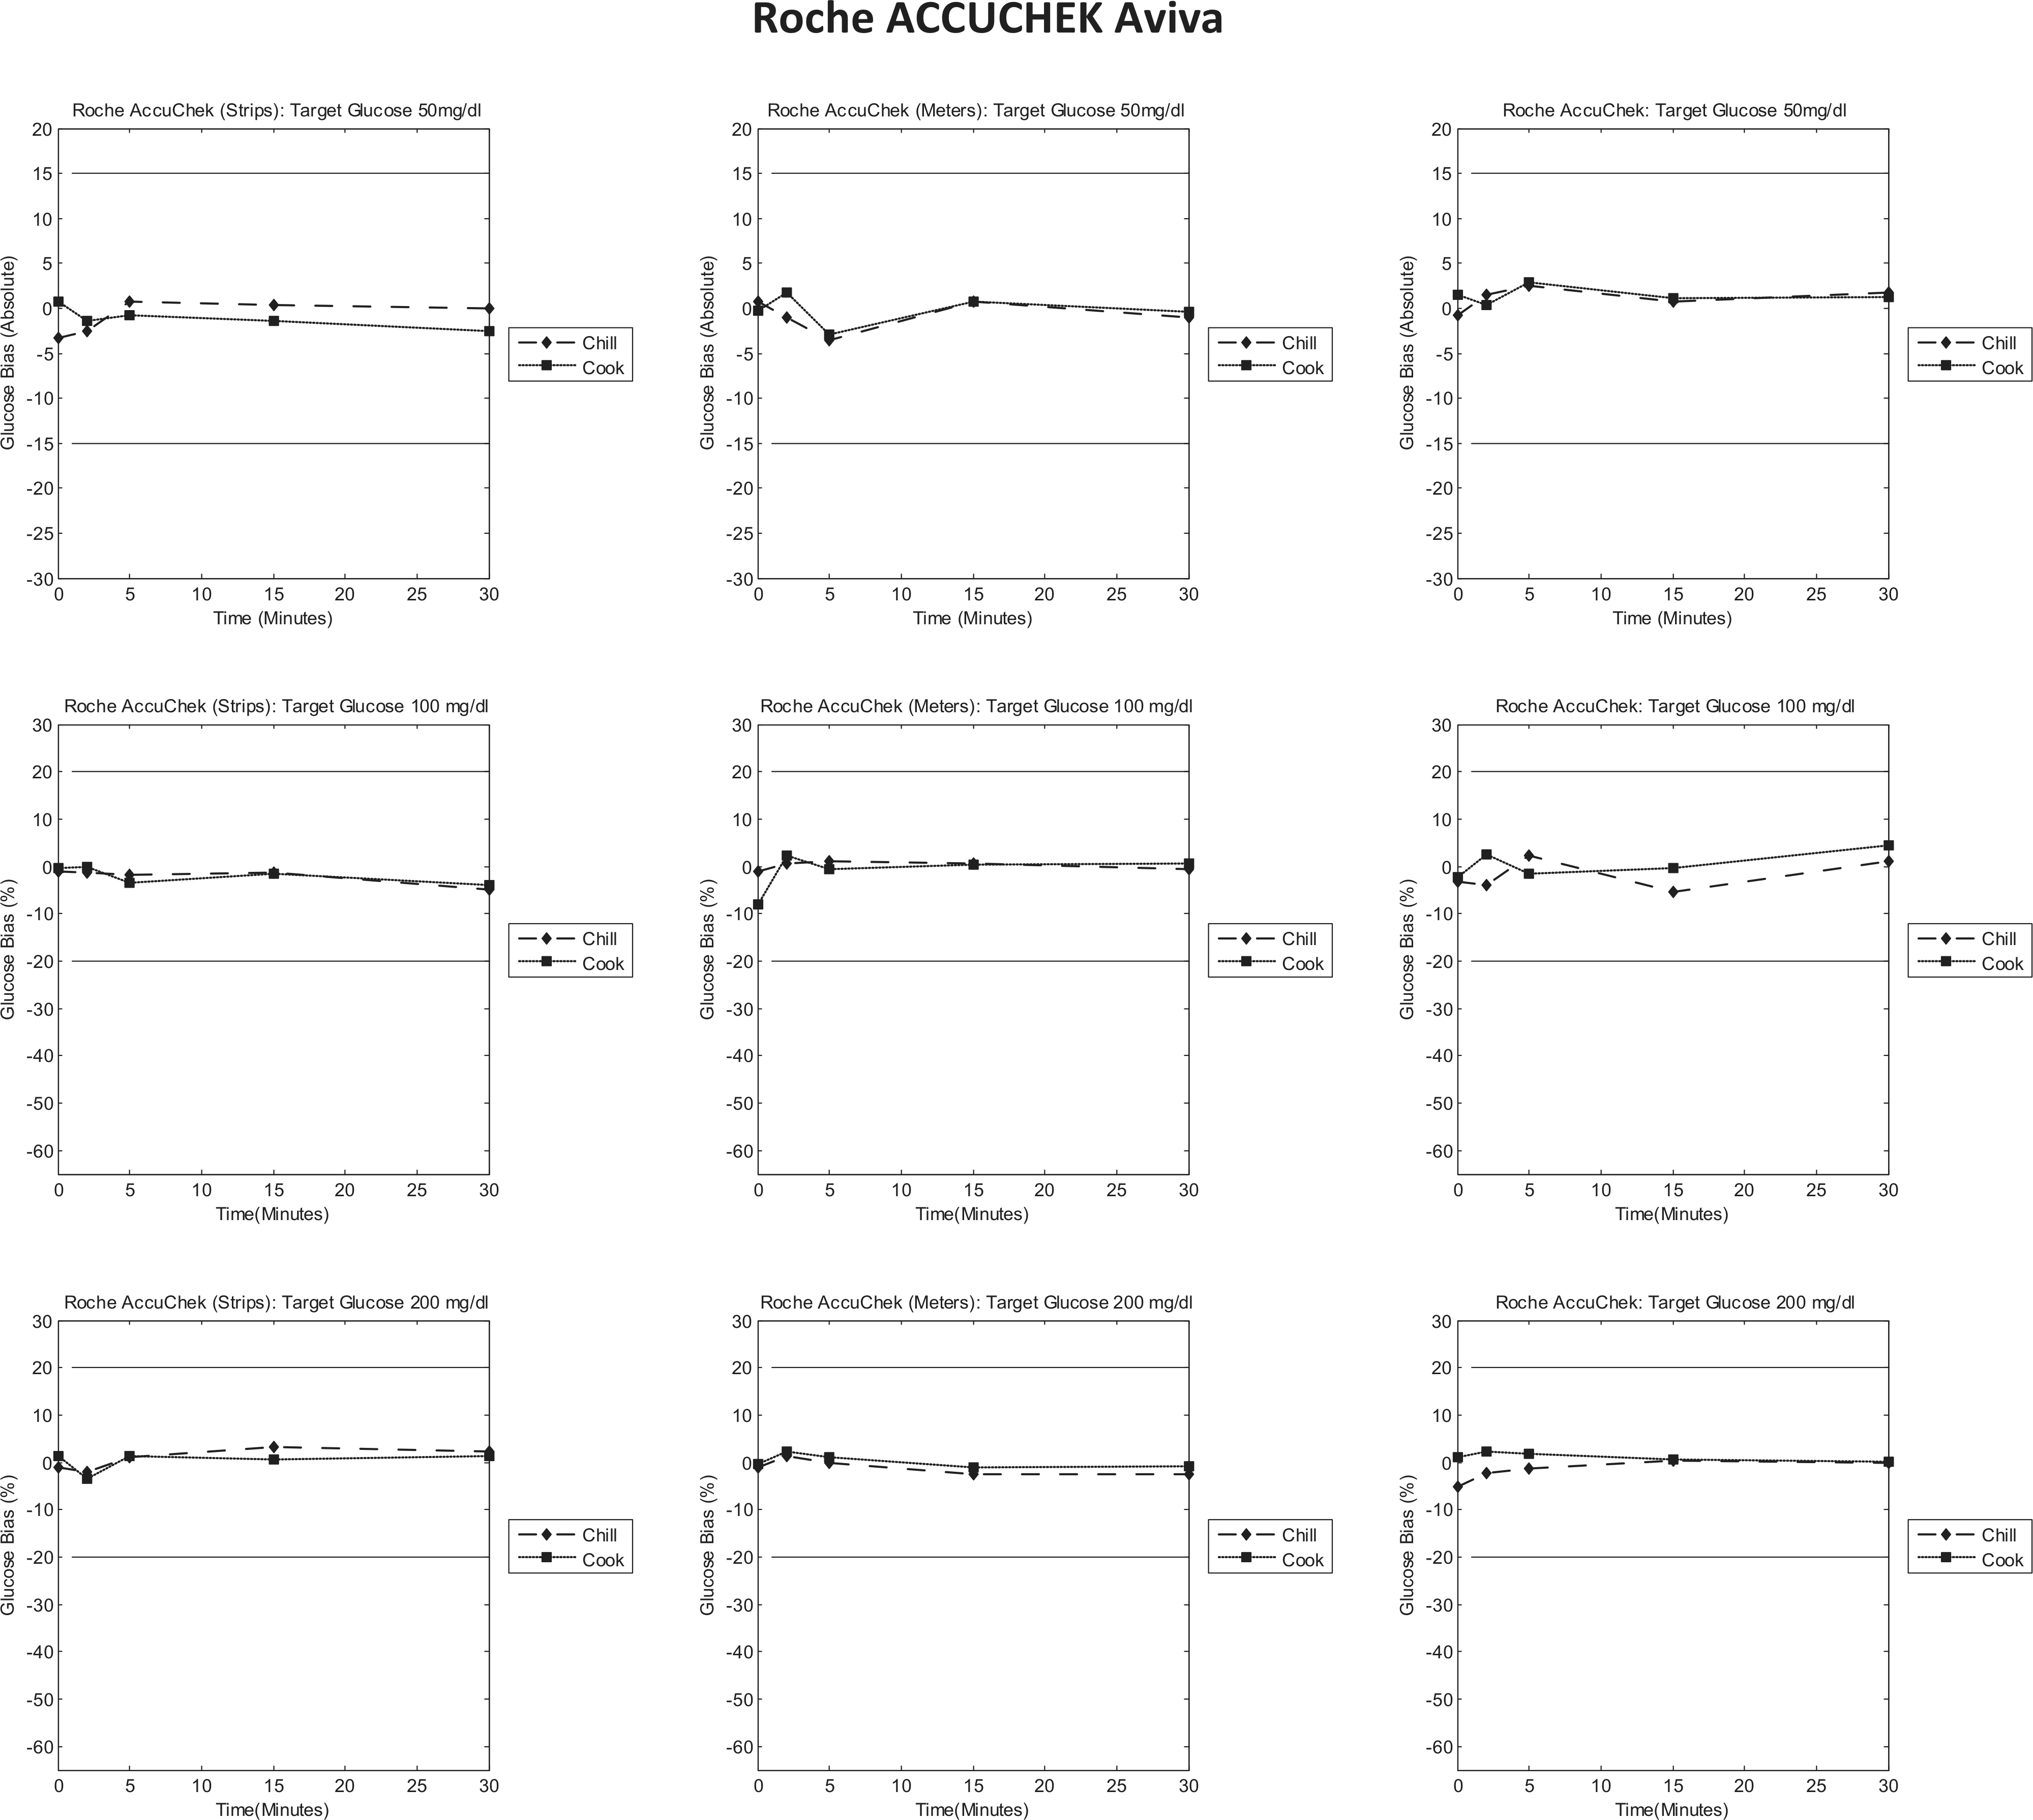
Roche AccuChek Aviva bias to control plots. Each column represents individual tests (strips/meters/test system); each row represents a target glucose level (50/100/200 mg/dl). Each graph is a bias plot versus the control condition (room temperature). The dotted lines (squares) represent the cook test condition, and the dashed lines (diamonds) represent the chill test condition. The black limit lines are ±15 mg/dl at 50 mg/dl and ±20% at 100 and 200 mg/dl.
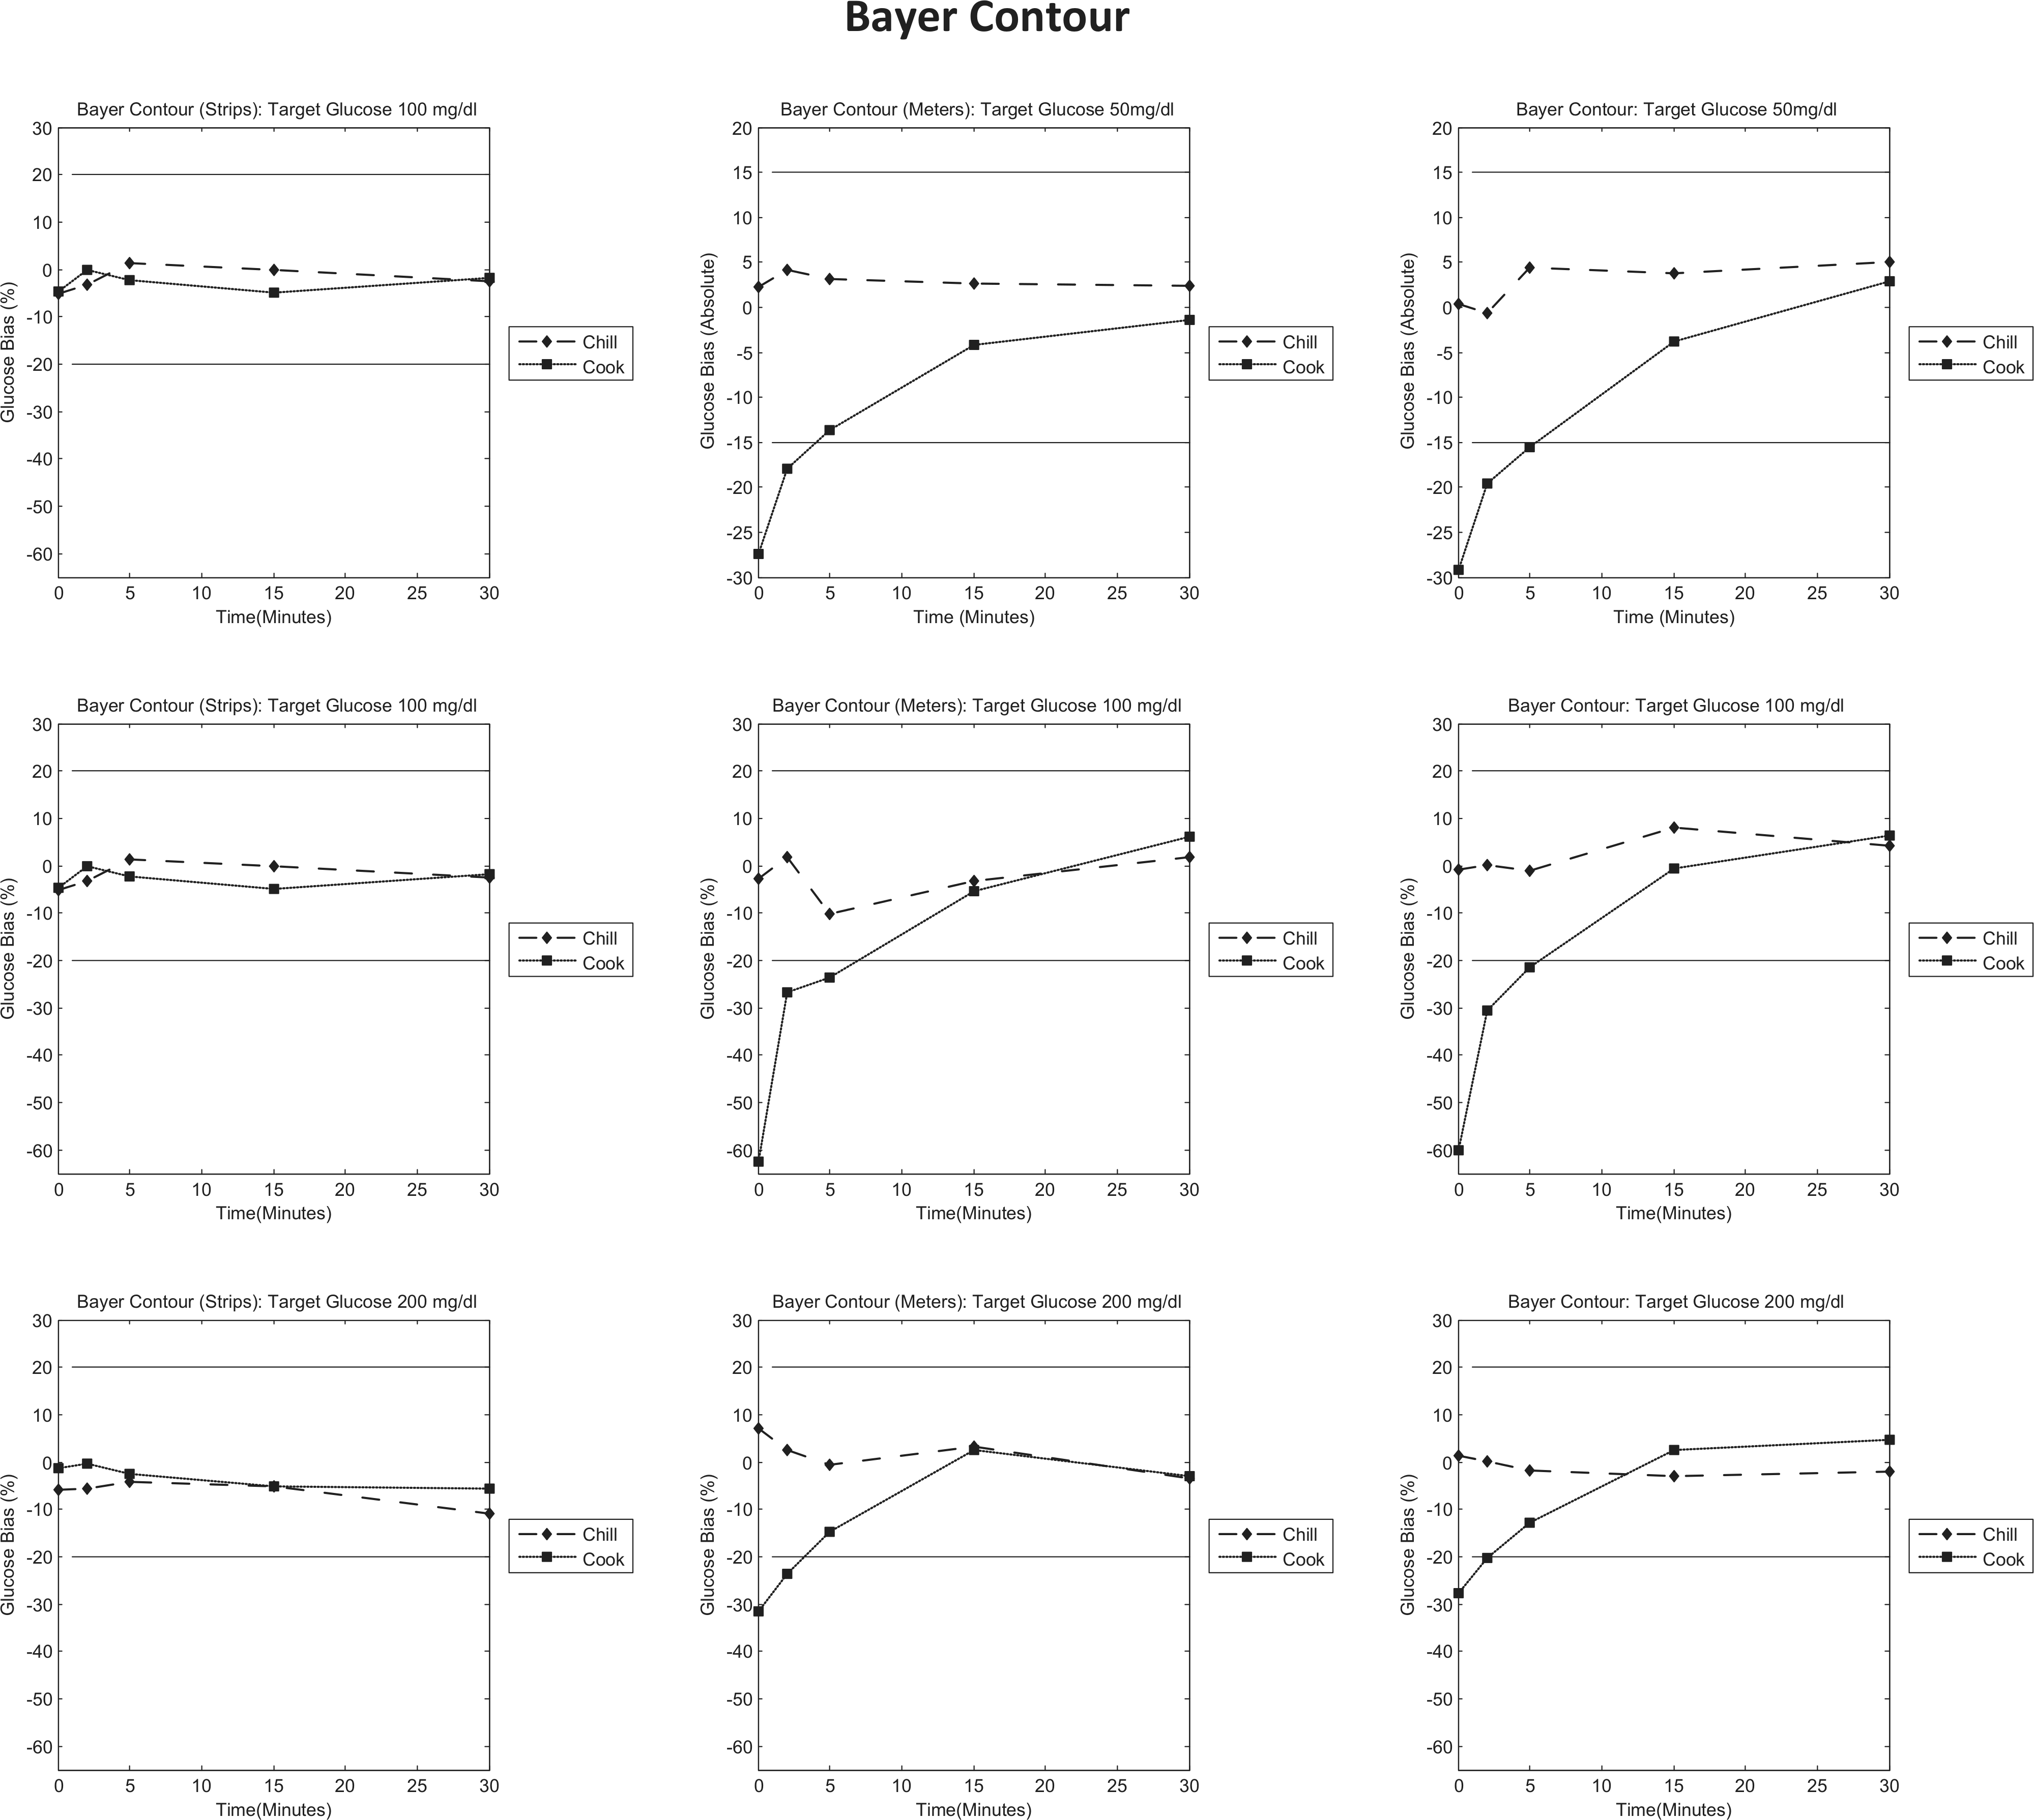
Bayer Contour bias to control plots. Each column represents individual tests (strips/meters/test system); each row represents a target glucose level (50/100/200 mg/dl). Each graph is a bias plot versus the control condition (room temperature). The dotted lines (squares) represent the cook test condition, and the dashed lines (diamonds) represent the chill test condition. The black limit lines are ±15 mg/dl at 50 mg/dl and ±20% at 100 and 200 mg/dl.
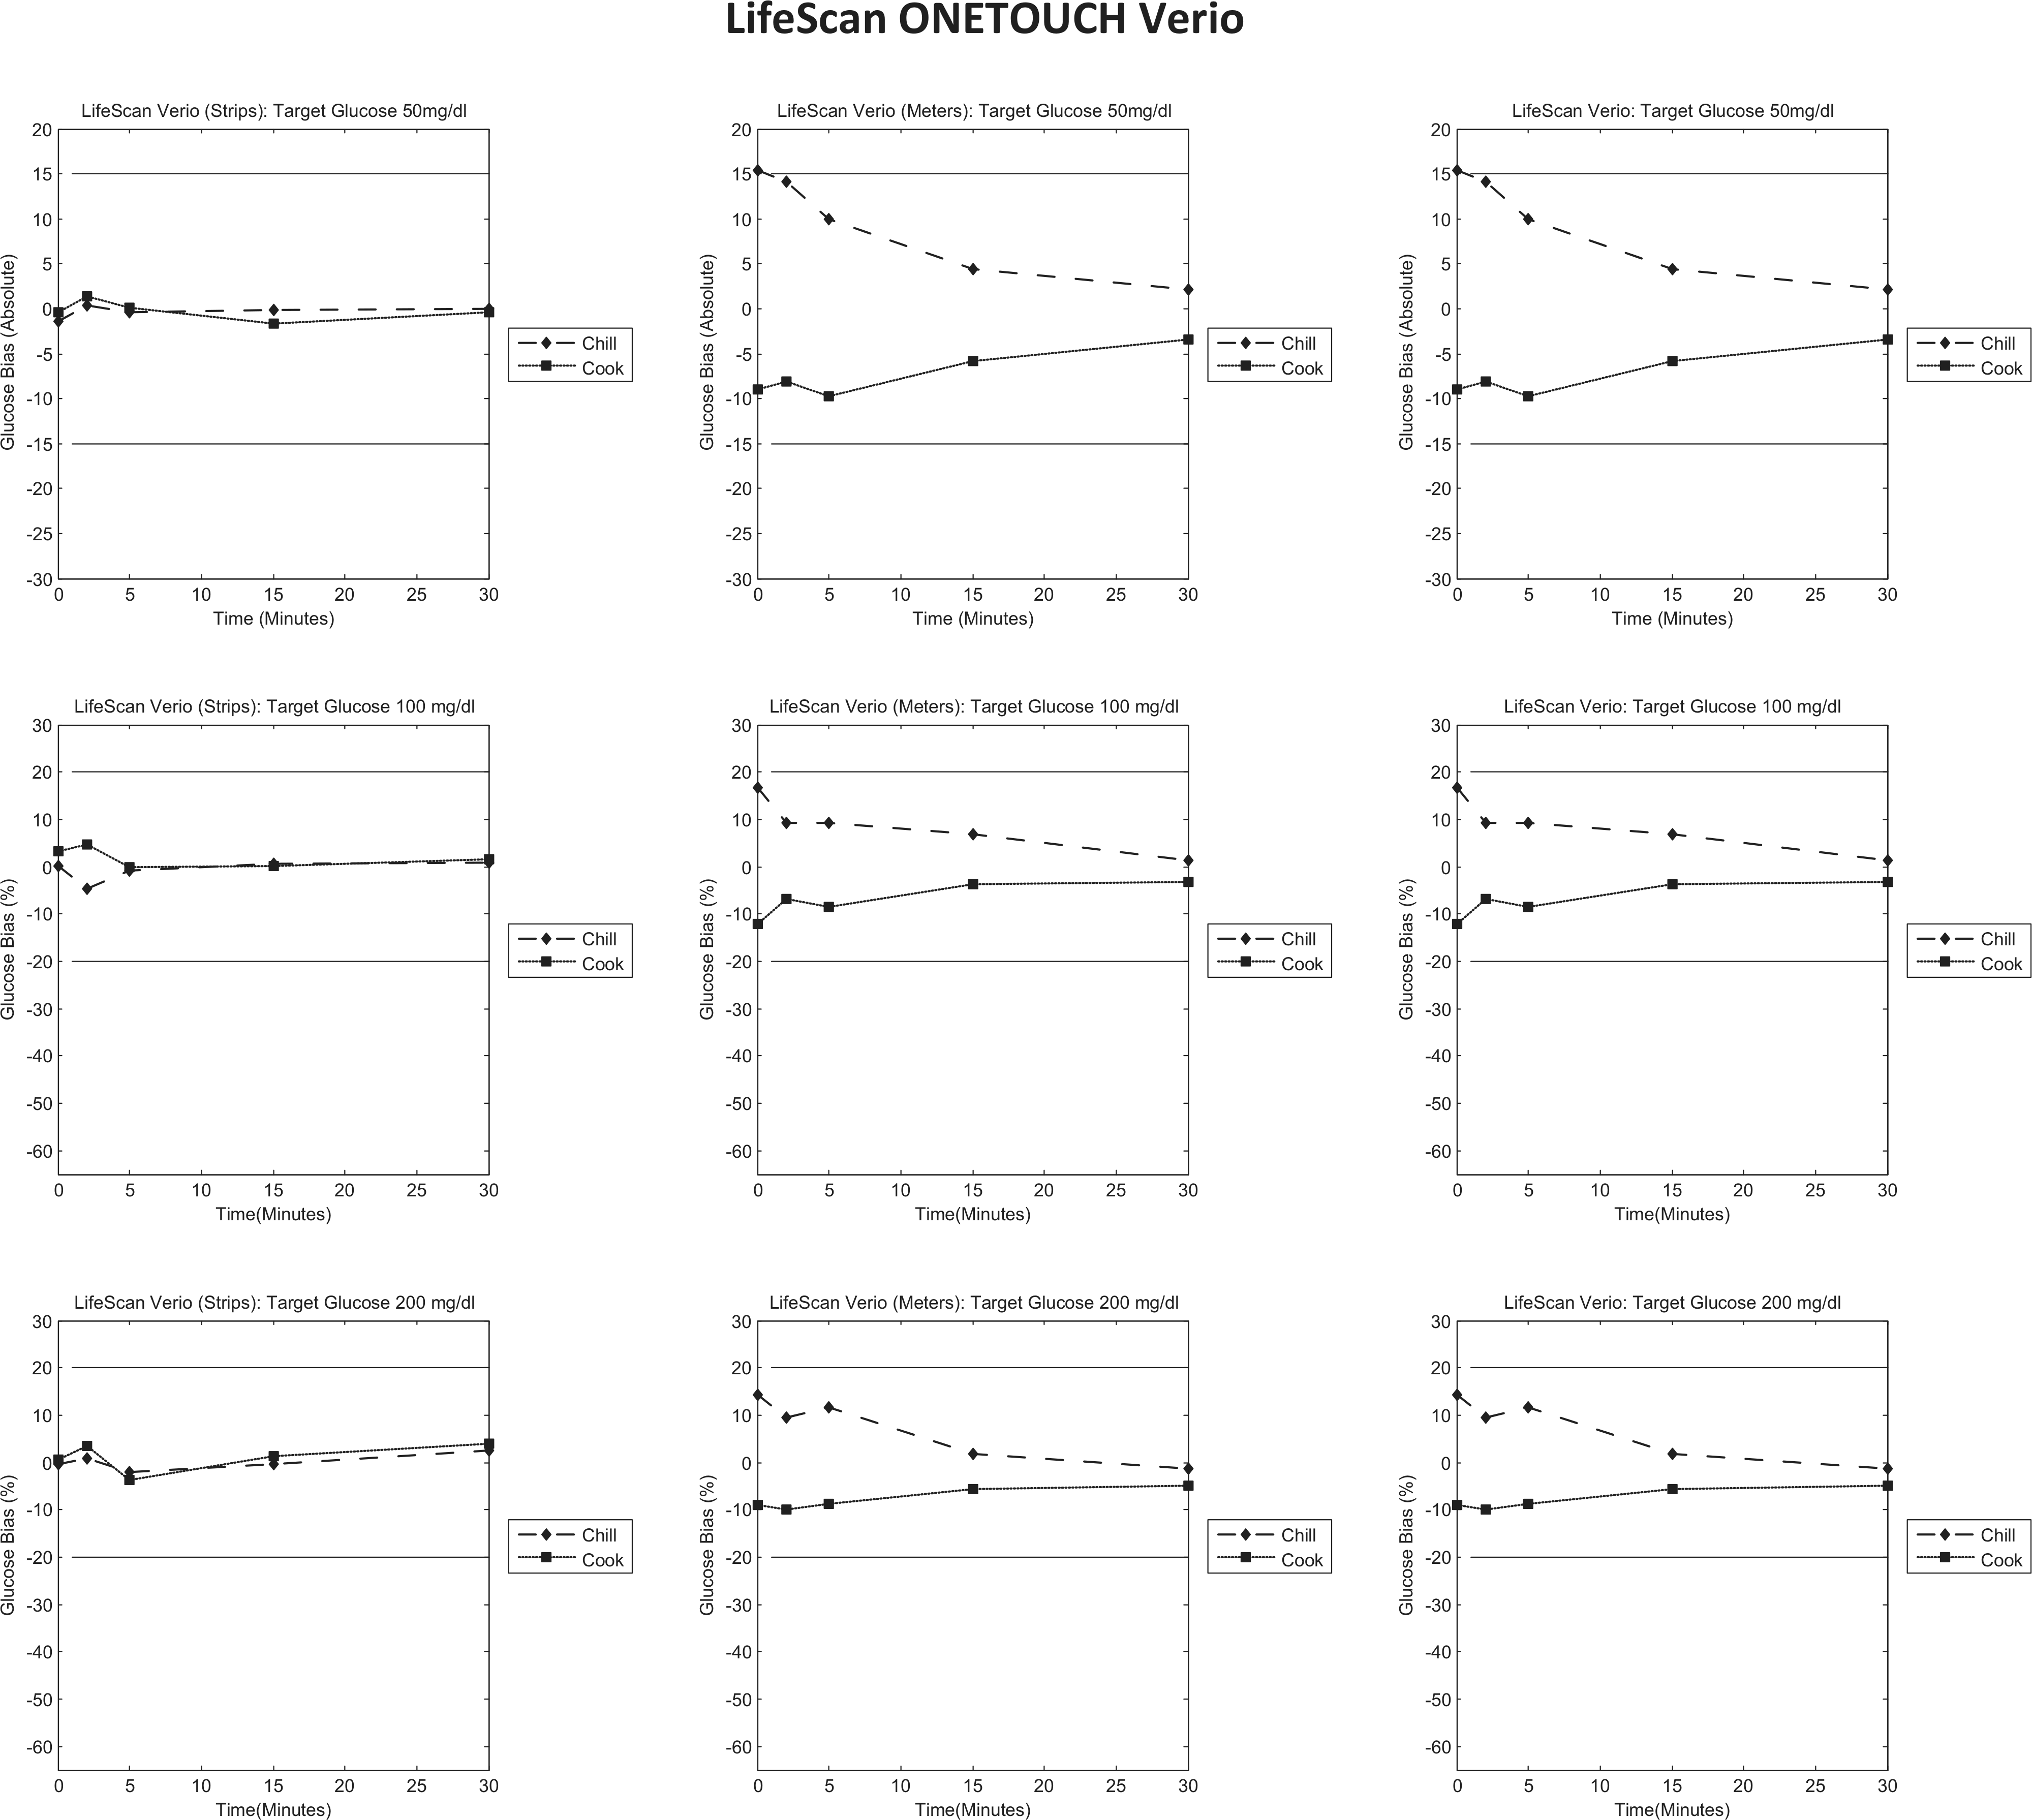
LifeScan OneTouch Verio bias to control plots. Each column represents individual tests (strips/meters/test system); each row represents a target glucose level (50/100/200 mg/dl). Each graph is a bias plot versus the control condition (room temperature). The dotted lines (squares) represent the cook test condition, and the dashed lines (diamonds) represent the chill test condition. The black limit lines are ±15 mg/dl at 50 mg/dl and ±20% at 100 and 200 mg/dl.
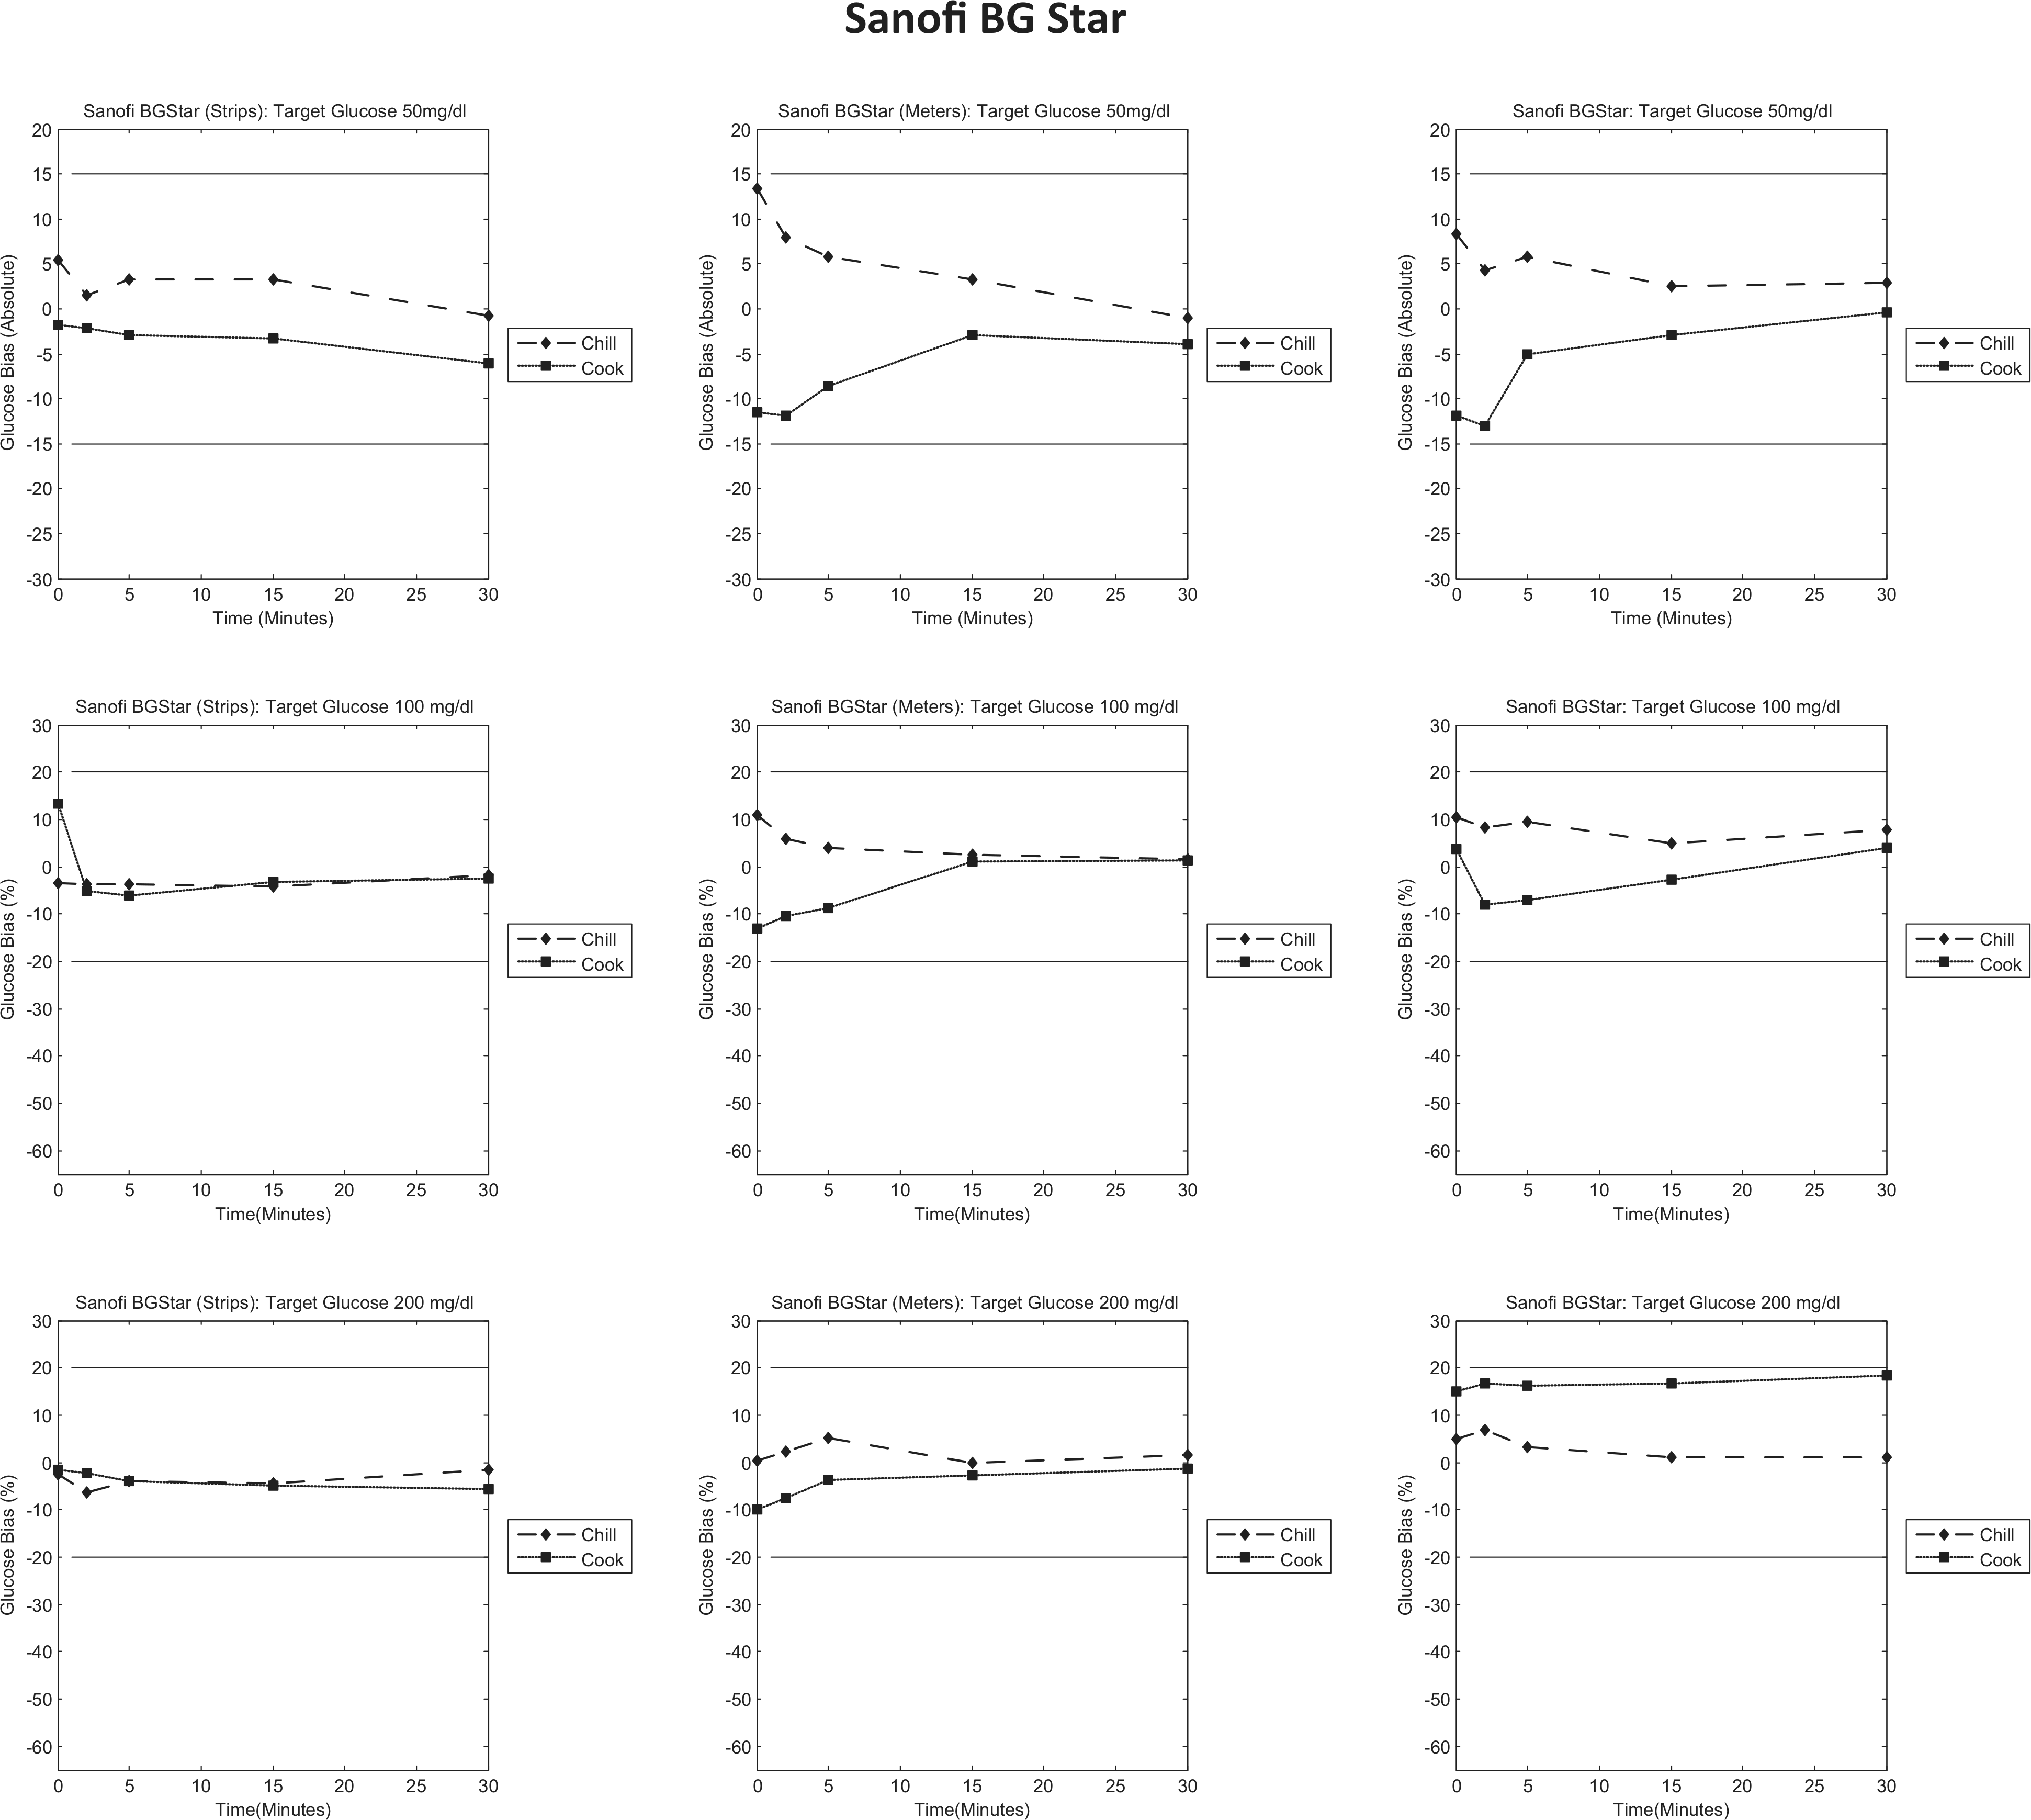
Sanofi BG Star bias to control plots. Each column represents individual tests (strips/meters/test system); each row represents a target glucose level (50/100/200 mg/dl). Each graph is a bias plot versus the control condition (room temperature). The dotted lines (squares) represent the cook test condition, and the dashed lines (diamonds) represent the chill test condition. The black limit lines are ±15 mg/dl at 50 mg/dl and ±20% at 100 and 200 mg/dl.
Overall, incubating the test strips at −5°C and 50°C, then performing a measurement at room temperature had little effect on the glucose measurement, as the bias to the room temperature control was less than 5 mg/dl (glucose below 75 mg/dl) or 5% (glucose above 75 mg/dl) in all cases.
Incubation of the meters and test systems at 50°C resulted in a negative bias to the room temperature between 0 and 15 minutes postincubation. Between 15 and 30 minutes postincubation there was little or no bias to the room temperature. Incubation of the meters and test system at −5°C resulted in a positive bias to the room temperature between 0 and 15 minutes postincubation. Between 15 and 30 minutes there was little or no bias to the room temperature.
Individual Meter Performance
For each blood glucose monitoring test system each column represents individual experiments defined in Table 1: The first column presents the results from incubating test strips at extreme low and high temperature, the second column the results from incubating the meter at extreme low and high temperature, and the third column the results from incubation of both the meter and test strips at extreme low and high temperature. Each row represents a glucose level the top row is 50 mg/dl (±5 mg/dl), the middle row is 100 mg/dl (±5%), and the bottom row is 200 mg/dl (±5%). Each graph is a bias plot versus the control condition (23 ± 2°C); the dotted lines represent the cook (incubation at 50°c) test condition and the dashed lines represent the chill test condition (incubation at −5°C); the black limit lines are ±15 mg/dl for 50 mg/dl and ±20% for 100 and 200 mg/dl. 10
Abbott FreeStyle Freedom Lite
The data in the first column of Figure 2 show the results of incubation the test strips at extreme low and high temperature that testing at 23°C with a test strip preincubated at −5°C does not significantly alter the result obtained from the test system. However, at nominal and high glucose levels, testing at ambient conditions with test strips preincubated at 50°C has a small effect initially, where a negative bias to the room temperature control was observed.
The second columns show that when the meters are preincubated at low and high temperatures (at 100 and 200 mg/dl glucose), the early results show a positive bias when preincubated at low temperature conditions and a negative bias when preincubated at high temperature conditions. However, this was not observed at 50 mg/dl glucose with preincubation of the test strips, as the results obtained were similar to the control.
Likewise, this was also observed when both the test strips and meters were preincubated together. This suggests the meter when preincubated at extreme temperature impacts the glucose measurement displayed by the test system more than preincubating the test strips at extreme temperatures.
Roche AccuChek Aviva
The data collected show that this test system does not appear to be significantly affected by preincubation at extreme temperatures. All experiments indicate that the glucose measurements obtained after preincubation, displayed below, show little or no bias to the room temperature control (Figure 3). This suggests that preincubation at extreme temperatures does not impact the glucose measurement displayed.
Bayer Contour
The first column shows that when the strips are preincubated at extreme temperatures (at 100 and 200 mg/dl), the glucose results show little bias to the control. The data in the second and third columns of Figure 4 show that preincubation of the meter at low temperature obtains measurements in line with the control. However, preincubation at high temperature shows a large negative bias compared to the room temperature control, which attenuates over time. Likewise, preincubation of the meter and test strips obtains a similar result to preincubation of the meter alone. This indicates that preincubation of the meter impacts the glucose measurement more than preincubation of the test strips.
LifeScan OneTouch Verio
Figure 5 shows that preincubation of test strips at extreme temperatures (column 1) has little impact on the measurement obtained as there is little bias compared to the control temperature. However, when the meters are preincubated at extreme temperatures, low temperature preincubation results in a positive bias to the control that resolves over time, and high temperature preincubation results in a negative bias to the control that resolves over time. Likewise, this is also observed when both the meter and the test strips are preincubated.
Sanofi BG Star
Figure 6 shows that preincubation of test strips (column 1) has little impact on the glucose measurement obtained and shows little bias to the control condition. However, when the meters are preincubated, both independently or as part of the whole test system, preincubation at low temperature results in a positive bias that resolves over time, and preincubation at high temperature results in a negative bias that resolves over time.
In general, of the glucose monitoring devices tested, preincubation of the test strips at extreme temperatures prior to room temperature testing did not affect the glucose measurements obtained. However, preincubation of the meters at extreme temperatures prior to room temperature testing gave glucose measurements that differed from the control initially after the temperature lockout feature was disabled.
Discussion
It is well established that the prevailing environmental temperature can negatively impact people with diabetes. 11 Here we tested the effectiveness of lockout systems from major manufacturers that are embedded within blood glucose monitoring systems in the event of extreme heat or cold. We also measured the time taken for meters to disable the lockout feature and display a glucose result as temperatures move toward normal room temperature. Although we exposed the meters and strips to extreme temperatures, we used values that do occur across the globe as part of the local weather systems and also where diabetes equipment might be exposed under common conditions, for example, being left in a car during the day in summer or overnight during winter.
Here, we found that the Abbott FreeStyle Freedom Lite was the only system that we tested that did not have a temperature lockout feature or an equilibration period defined by the manufacturer. All other test systems evaluated had a temperature lockout that did not allow the system to be operated out with the temperature range recommended by the manufacturer. Equilibration period (the time from end of incubation to when the test system is operational) was between 1 and 8 minutes, and each test system took between 15 and 30 minutes after incubation to obtain measurements stable with a room temperature control. Preincubating the test strips at −5°C and 50°C and then performing a measurement at room temperature had little effect on the glucose measurement; by comparison to the meter, the test strip is much smaller and as such will equilibrate to room temperature much quicker than the meter. Preincubation of the meter at extreme temperatures, prior to testing at room temperature, in the initial measurements after the temperature lock was disabled in 4 out of 5 test systems used here displayed a bias that resolves over time as the meter equilibrates to room temperature. Our results showed effective compensation mechanisms used by the meters studied here.
From an educational perspective, people using blood glucose monitoring systems need to be aware that the failure to provide a glucose value after exposure to extreme high and low environmental temperatures is a safety feature and decisions around the timing of the calculation of a safe and effective meal time insulin bolus need to take the lag of 15 to 30 minutes into consideration.
Advice related to diabetes equipment performance and the effects of temperature should be part of a wider initiative to improve knowledge about the effects of extreme temperature on health and well-being. 12 Few educational resources focusing on temperature and diabetes are available,13,14 and personal knowledge of individuals living with the condition on this topic appears variable. 15
In conclusion, compensating technologies embedded within blood glucose monitoring systems by the manufacturers studied here perform well at extreme high and low temperatures, although it may be valuable to assess this with a larger number of randomly selected systems. Due to a time lag of 15 to 30 minutes to obtain measurements stable with room temperature, people with diabetes need to be alerted to this feature to avoid perceptions of malperformance of their devices and the possible inability to get blood glucose readings on short notice (eg, during period of suspected rapid change or before an unplanned meal). From a safety perspective, it may be prudent to check the functionality of all available blood glucose monitoring systems at extreme temperatures.
Footnotes
Abbreviations
SMBG, self-monitoring blood glucose; YSI, Yellow Springs Instrument; RH Relative Humidity.
Declaration of Conflicting Interests
The author(s) declared the following potential conflicts of interest with respect to the research, authorship, and/or publication of this article: 1. AccuNostics employees as part of their remuneration package receive share options in the company 2. DK has received consultancy fees from AccuNostics, Abbott Diabetes Care, and Roche Diagnostics. 3. RL is a former employee of Roche and owns shares in Johnson & Johnson and Roche.
Funding
The author(s) received no financial support for the research, authorship, and/or publication of this article.