
Abstract
Background:
Restaurant eating while optimizing nutrition and maintaining a healthy weight is challenging. Even when nutritional information is available, consumers often consider only calories. A quick and easy method to rate both caloric density and nutrition is an unmet need. A food rating system created to address that need is assessed in this study.
Methods:
The food rating system categorizes food items into 3 color-coded categories: most healthy (green), medium healthy (yellow), or least healthy (red) based on calorie density and general nutritional quality from national guidelines. Nutritional information was downloaded from 20 popular fast-food chains. Nutritional assessments and the 3 color coded categories were compared using the Wilcoxon and Median tests to demonstrate the significance of nutrition differences.
Results:
Green foods were significantly lower than yellow foods, which in turn were significantly lower than red foods, for calories and calories from fat, in addition to content of total fat, saturated fat and carbohydrates per 100 g serving weight (all P < .02). The green foods had significantly lower cholesterol than the yellow (P = .0006) and red (P < .0001) foods. Yellow foods had less sugar than red foods (P < .0001). Yellow foods were significantly higher in dietary fiber than red foods (P = .001).
Conclusion:
The food rating color-coded system identifies food items with superior nutrition, and lower caloric density. The smartphone app, incorporating the system, has the potential to improve nutrition; reduce the risk of developing diabetes, hypertension, heart disease, and stroke; and improve public health.
The combined prevalence of overweight and obesity in the United States adult population in the 2011-2012 National Health and Nutrition Examination Survey (NHANES) was 69%, one of the highest in the world. 1 Eating outside the home has been associated with obesity and higher body fat. 2 Household spending on food away from home has reached record levels, nearing 50% of food expenditures. 3 Eating at both fast-food and full-service restaurants, has been associated with an increase in daily calories. 4 Caloric intake contributes to the weight gain in the United States. 5 The increased prevalence of obesity in a population is followed by a higher prevalence of type II diabetes after a lag of about a decade. 6 Obesity and diabetes are both associated with cardiovascular disease. 7
In 2014 the FDA finalized menu labeling requirements requiring chain restaurants to include calorie information on menus. Most restaurants are not chain restaurants and will not offer any caloric or nutritional information. New York passed a law in 2008 mandating chain restaurants to inform the public of the calories and nutritional content of their food items. Dumanovsky et al evaluated customer knowledge of nutritional information 3 months before and 3 months after the institution of the New York statute. Although calorie information was utilized, nutritional information was not, suggesting that the presentation of nutritional information needed a simpler format. 8
Consumers find nutrition labels confusing and have difficulty understanding the information they convey. 9 Consumers are also likely to abandon the use of a system that is not simple, clear, or makes product comparisons difficult. 10 Underestimation of calories is more common when restaurants market themselves as healthy. 11 A survey of dieticians showed that even these professionals consistently underestimate the calorie and fat content of restaurant meals. 12
Past studies have evaluated the use of traffic light (TL) systems to determine if they are a simpler format to understand. The majority of the literature focuses on the use of TL systems relative to front of package (FOP) labels during grocery shopping and how the TL systems affect choice. A popular system for study is the multiple-traffic-light (MTL) system developed by the UK Food Standards Agency, and variations of it. 13 The FOP labels place multiple nutrients, commonly total fat, saturated fat, sugar, and sodium, on the front of food packages. Each nutrient is then color-coded to indicate if the product contains a high (red), medium (yellow), or low (green) amount of each nutrient. Studies have mainly focused on evaluating TL systems against other FOP labels based on percentage daily recommended values (%DV) of multiple nutrients.
In a review of the literature on FOP labels, Hawley et al found that consumers generally preferred a MTL label, though this was not true in all markets; a study of Belgium consumers found they preferred a %DV system. 14 A survey in New Zealand included a simple-traffic-light (STL) system along with an MTL system and found that a MTL label was preferred over all other label types, including the STL label. 15 It is obvious that consumer opinions on TL systems vary.
Hawley et al point out, consumer preference is not indicative of successful use of the labels. 14 In New Zealand the STL system outperformed the other systems including the MTL when measuring consumer ability to correctly determine if a food was healthy. 15 The results were found across all ethnic and income groups in the study. Studies in Australia and Germany also found TL systems outperformed other systems in their ability to enable consumers to correctly identify healthier choices.16,17
Studies of TL systems in restaurant and restaurant like (eg, cafeteria) settings have not been conducted as often as they have been done in grocery settings. Ellison et al conducted 2 such studies in restaurants. Both studies compared the ability of multiple menu labeling techniques to reduce calories consumed. A control menu labeling system contained no information, the second system gave calorie labels next to each item, and the third system included both calorie labels and a STL symbol next to each item, denoting a high (red), medium (yellow), or low (green) level of calories. The results of the calorie only labels were mixed, with 1 study finding an impact only on consumers who were not already health conscious. The studies concluded that the addition of a STL symbol reduced calories consumed over both other menu labeling systems. The addition of an STL symbol impacted both consumers who were not already health conscious and those who were.18,19 Enax et al demonstrated, using functional MRI, that the TL system colors activate specific areas of the brain, potentially explaining the superior performance of the TL system. 20
Thorndike et al conducted a study in the main cafeteria at Massachusetts General Hospital. The study consisted of 2 phases. After a 3-month baseline, all cafeteria items were labeled using a STL system. The categorization of items was based on the US Department of Agriculture’s 2005 My Pyramid healthy eating recommendations. During this phase, which lasted 3 months, sales of red items decreased 9.2% and sales of green items increased 4.2%. The second phase consisted of rearranging items for sale to make green items more prominent; green sales increased further and red sales decreased further. 21 In a 2-year follow-up, during which time the cafeteria made the changes permanent, sales of green items remained at the elevated levels, while sales of red items remained at the depressed levels. 22
There are many advantages to incorporating nutritional information into a decision regarding which food items to consume, in addition to taking calories into account. Rolls emphasized the role of foods with a lower caloric density in helping to maintain a healthy weight. 23 Higher sodium intake is associated with a greater risk of hypertension and heart disease, but a higher protein intake is associated with a lower blood pressure.24,25 Higher dietary sugar is associated with obesity and diabetes, while higher fiber in the diet is protective from diabetes.26,27
In view of the advantages of representing caloric and nutritional information when choosing food items, a proprietary STL food rating system (JoinTheChallenge LLC, Old Westbury, NY) was constructed that categorizes food items as red (least healthy), yellow (medium health), and green (most healthy), without using the caloric or nutritional information directly with specific ranges. Nutritional information such as calories or fat content is never entered into the system. Therefore, the system is not dependent on nutritional information being available. The rating system uses only the name and description of the food item just as they are provided on restaurant menus. If an item category (eg, salads, hamburgers, desserts) is available, the system incorporates the category into the name of the item by appending it to the beginning of the name. This article evaluates the ability of this rating system to correctly categorize foods.
Methods
Data
The following 20 fast-food chains were selected to test the rating system, because they all had readily available nutritional information: A&W, Arby’s, Blimpie, Bob Evans, Burger King, Burgerville, Carl’s Jr., Checkers, Del Taco, Hardee’s, In-N-Out Burger, KFC, Maoz, McDonald’s, Panda Express, Taco Bell, Taco Del Mar, Wendy’s, Whataburger, and White Castle.
Nutritional data were downloaded from the respective websites of these restaurant chains and converted to excel files. These data were specifically aggregated for the purpose of this study. In addition to the nutritional data, food items included a category, name, and description in the downloaded files. Data not available across all menus (eg, vitamin A and calcium) were eliminated from the analysis. The nutritional weights were converted to grams or milligrams. Soups and drinks were excluded from the analysis, because the serving weight of these items was either ambiguous or presented in milliliters which prevented standardizing them in grams. Items that cannot be ordered individually, such as condiments, dressings, and individual ingredients, were not analyzed. The food rating system was constructed prior to the collection of these data, which were selected as data to test and measure the characteristics of the outputted food ratings. The food rating system used only the category, name, and description of each food item to perform its food rating categorization. A total of 2026 food items were analyzed to characterize the STL rating categories of the food rating system. Nutritional data analyzed were calories, calories from fat, total fat, saturated fat, cholesterol, sodium, carbohydrates, dietary fiber, sugar, and protein. The gram weights of these items were standardized as the amount of each nutrient per 100 g of serving weight of each food.
Statistical Analysis
Descriptive statistics were compiled to summarize the nutritional data for the 3 color-coded food groups. Then the Wilcoxon test and median test were assessed for each nutrient to test significance of differences among the 3 food groups. P values were adjusted for multiple testing with Bonferroni correction. An adjusted P value < .05 was considered statistically significant, and the SAS® 9.4 software package was used for all the analyses.
Results
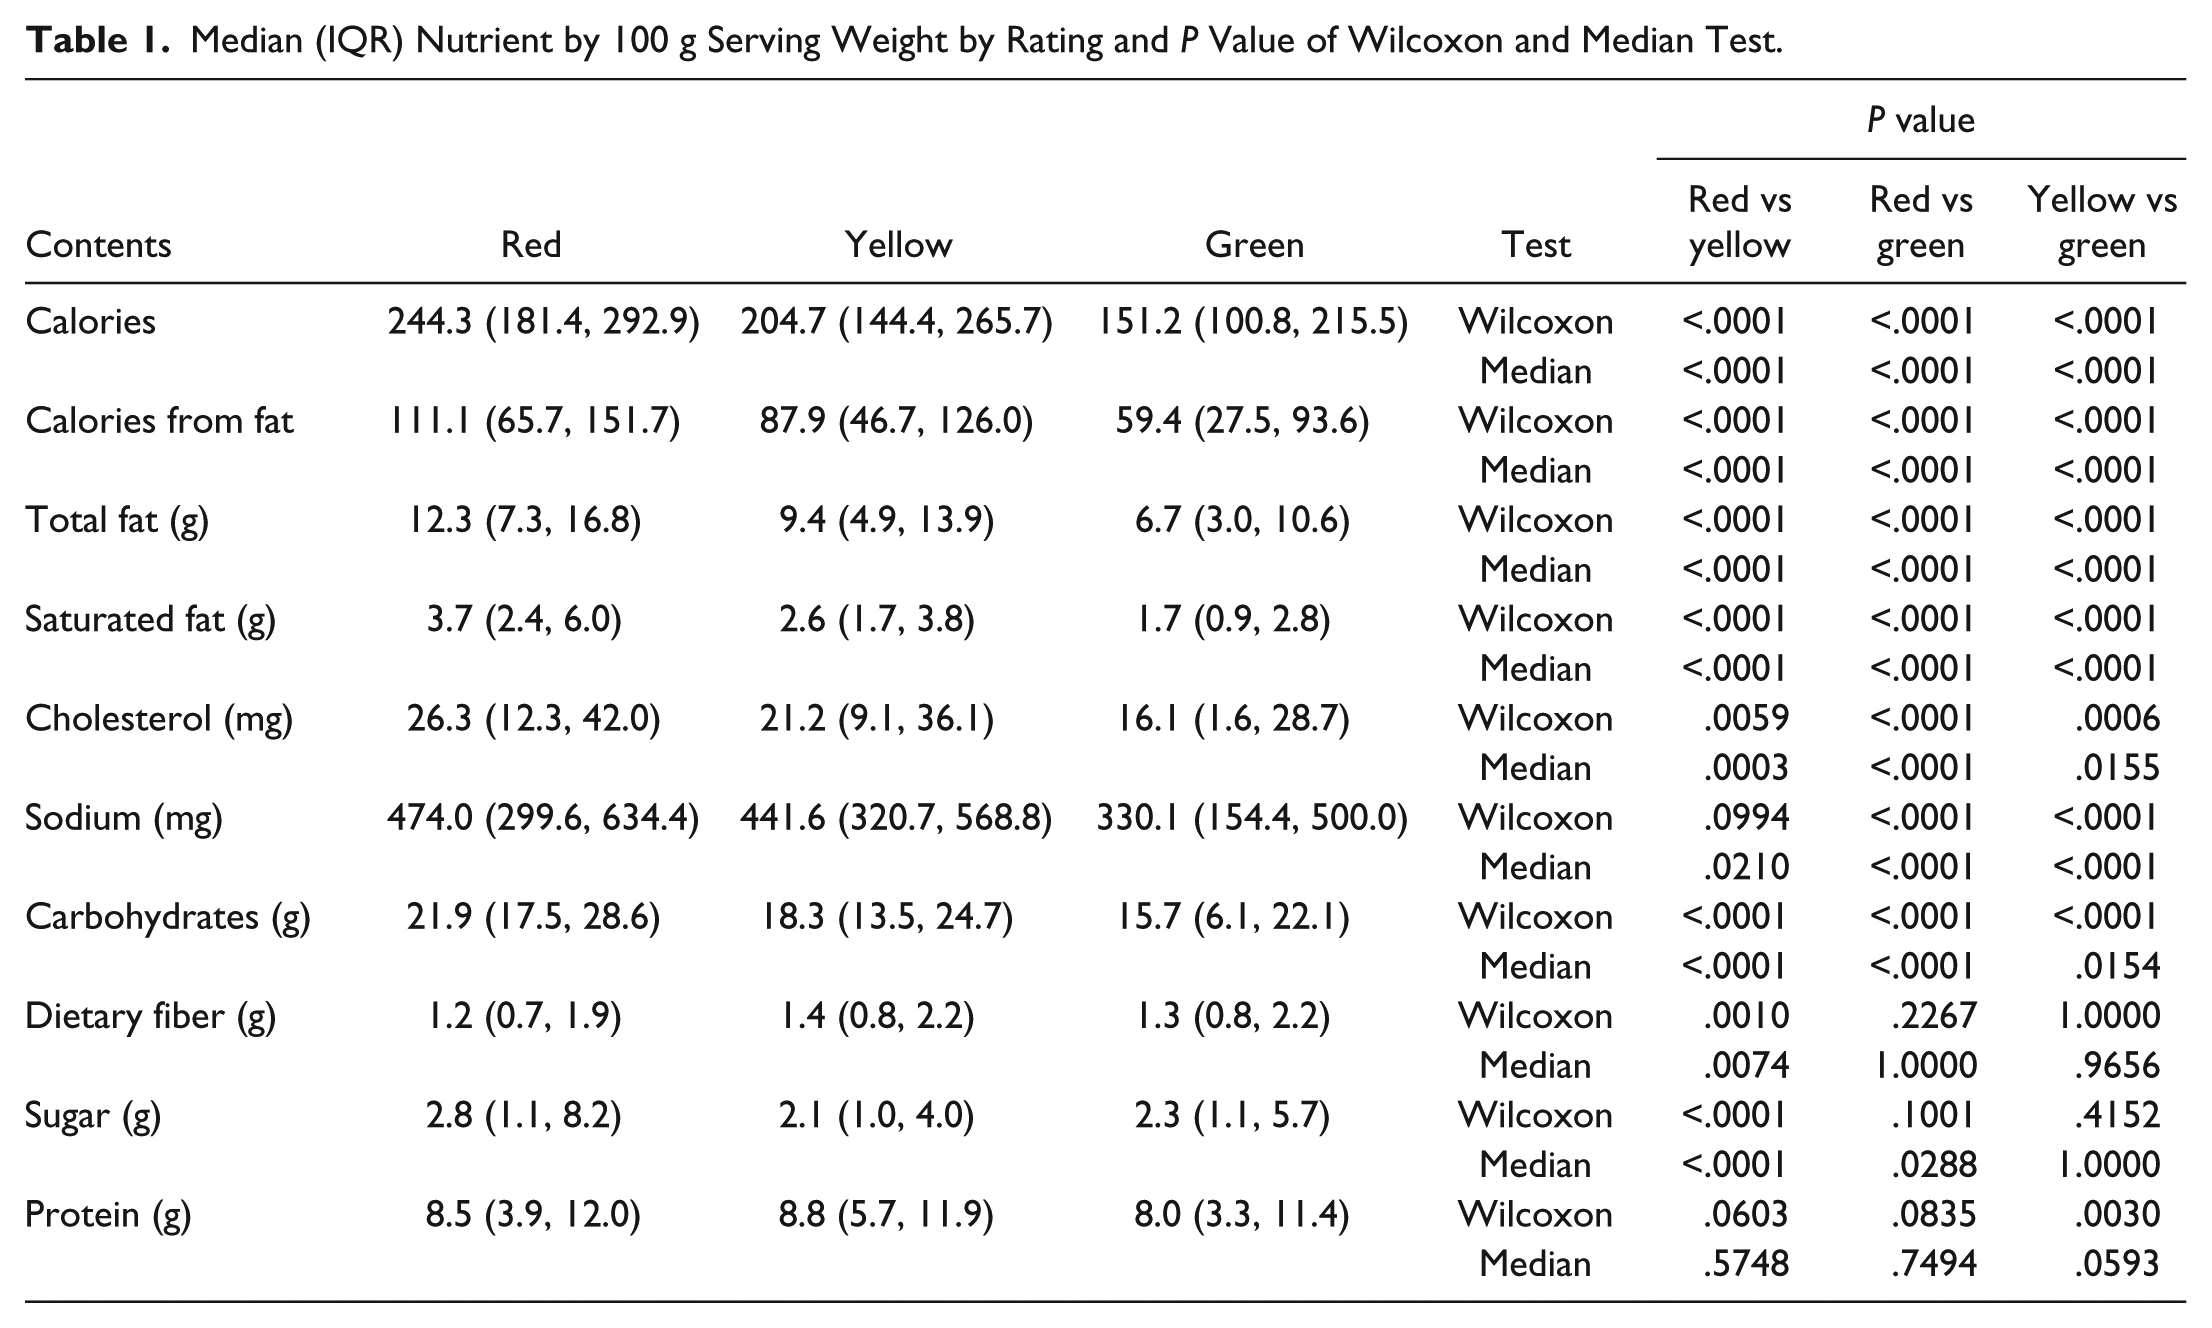
Of the 2026 food items, 1206 (59.5%) were classified red (least healthy), 590 (29.1%) yellow (medium healthy) and 230 (11.4%) green (most healthy). Although the details can be seen in Table 1, the following provides a brief summary. Each group had a progressive reduction in calories/100 g, 244.3 (red), 204.7 (yellow), and 151.2 (green), all significantly different from each other (P < .0001). Green foods were significantly lower than yellow foods which in turn were significantly lower than red foods for calories from fat, in addition to content of total fat, saturated fat, and carbohydrates per 100 g serving weight (all P < .002). The green foods had significantly lower standardized cholesterol than the yellow (P = .0006) and red (P < .0001) foods. Yellow foods had less sugar by 100 g serving weight than the red foods (P < .0001). Yellow foods were significantly higher in standardized dietary fiber than red foods (P = .001). Green foods had less sodium by 100 g serving weight than the yellow and red foods (both P < .0001).
Median (IQR) Nutrient by 100 g Serving Weight by Rating and P Value of Wilcoxon and Median Test.
Discussion/Conclusions
This analysis demonstrates that the color-coded classification system gives a statistically significant separation of the least, medium, and highest calorie food groups, the 1 real advantage achieved by the 2008 New York law. 8 Thus, the food rating system is able to retain the advantages of the present system of labeling information while, at the same time, incorporating important nutritional information in a simple format that people should find easy to use. Incorporating nutritional information in addition to caloric content into food selection could have significant public health implications.
The portion of American’s caloric intake away from home and medical costs of overweight and obesity have risen substantially.28,29 Comorbid diseases that accompany obesity include diabetes, hypertension, and cardiovascular disease. 30 Smartphone apps provide an opportunity to reach Americans, with the majority of the population now owning a smartphone. 31
The smartphone app, using the STL food rating system, helps consumers choose foods that are less dense calorically and will favor the maintenance of a healthy weight, as described by Rolls. 23 Even a minor reduction in calories over a sustained period of time could result in weight loss.19,32 This simple food rating system also directs the user to foods that are lower in fats and saturated fats which the American Heart Association has recommended people minimize in an effort to reduce their risk of coronary heart disease. 33 The food rating system also directs the user to foods that will minimize sodium consumption, another recommendation of the American Heart Association, because sodium intake is associated with hypertension, strokes, and heart disease. 34 The food rating system directs the user to foods lower in carbohydrate content which will optimize weight loss in those with insulin resistance. 35
A limitation of the food rating system is that it does not incorporate portion size into its ratings. Studies have shown that being served larger portions of food do result in the consumption of more calories.36,37 However, multiple studies have found that changing the caloric density of food does not result in changes in reported hunger or the volume of food consumed.38-42 Conversely, reductions in volume of food consumed can affect hunger, which may make it difficult for consumers to adopt portion size reduction as a long-term strategy for weight management. 41 Combined reductions in portion size and caloric density, while additive in reducing calories consumed, are also independent, with a reduction in caloric density providing a proportionally larger impact on calorie consumption in the short term. 42 A 1-year clinical trial was conducted, testing the effectiveness of incorporating servings of low caloric density foods versus incorporating servings of high caloric density foods; overall calories were the same, with portion size being manipulated to account for the difference in caloric density. Participants incorporating low caloric density foods into their diet reported feeling full to a greater degree and lost significantly more weight than participants who incorporated the smaller portions of high caloric density foods. 43 In view of the benefits obtained from low caloric density diets, and consumers’ possible long-term difficulties with restricting portion sizes, there are no plans to adapt the food rating system to incorporate portion size.
Clearly, the institution of food labeling in chain restaurants was a step forward toward the goal of improving public health. Unfortunately, although the calorie information seems to be used, the nutritional information is not. The majority of restaurants will continue to lack nutritional information availability. The smartphone app can make its ratings available in those establishments, since the food rating system does not require a food item’s nutritional information to rate the food. For menus not available in the app and for use outside of restaurants, such as in the home, manual entry is available in the app and a rating is calculated in seconds. Using the app, the consumer can easily pick out the foods most likely to help maintain a healthy weight and prevent diabetes, but in addition, the app will direct the consumer to foods that will reduce their risk of heart disease, high blood pressure, and stroke.
To use the manual entry feature of the app, users open a page in the app named Food Rater, where they are presented with 2 input fields, one for the food name and the other for the food description. Food ratings are independent of the order in which items are entered into the system. In addition, they are not customized to individual users and are therefore independent of who inputs the name and description. Inputting a description is optional, however the rating may change based on a description being included. Rating the same food multiple times results in the same output as long as the inputted name and description are exactly the same. Under those constraints, the system provides 100% precision.
A current limitation of the app is that it does not provide barcode scanning as an input method. In a grocery store, manual entry of food items will become time consuming, limiting the use of the app when making purchasing decisions in such settings. A mobile app developed in Australia, which allowed users to scan a packaged food barcode to see an MTL result, was downloaded over 400 000 times and was rated 4+ out of 5 stars on the Apple App Store. 44 The high rating for that app shows consumers desire such a feature. Barcode scanning is a planned feature for the app.
Other weight management smartphone apps have incorporated creative features to enhance their effectiveness. One such feature is the inclusion of a financial incentive. An app that incorporated this feature, by allowing users to create betting pools where the pool of money would be divided amongst all winners at the end of a 4-week period, found positive results. 45 However, the analysis does not provide a comparison group where financial incentives were not involved. In addition, longer term studies on the use of financial incentives were not able to detect a significant benefit from this method of encouragement.46,47 The betting app also found that weight loss clustered within betting pools, which raises the question of the impact of social interaction on successful weight management. Including social aspects may be an impactful feature and is being considered for inclusion in future versions of the smartphone app.
The performance of this app in customers has not been tested. Thus, its effectiveness in motivating better food choices awaits a controlled clinical trial. Nevertheless, this analysis demonstrates the potential of this app to direct the user to foods that will help maintain a healthy weight, prevent the onset of diabetes, and hypertension as well as prevent heart disease and strokes. Thus, this app has the potential to make a significant positive impact on public health.
Footnotes
Abbreviations
app, application software that can be downloaded to a mobile device; FDA, Food and Drug Administration; FOP, front of package; g, gram; green, most health foods; IQR, interquartile range; KFC, Kentucky Fried Chicken; LLC, limited liability corporation; mg, milligram; MRI, magnetic resonance imaging; MTL, multiple traffic light; NHANES, National Health and Nutrition Examination Survey; %DV, percentage of daily recommended values; red, least health foods; STL, single traffic light; TL, traffic light; UK, United Kingdom; yellow, medium healthy foods
Declaration of Conflicting Interests
The author(s) declared no potential conflicts of interest with respect to the research, authorship, and/or publication of this article.
Funding
The author(s) disclosed receipt of the following financial support for the research, authorship, and/or publication of this article: This research was funded by JoinTheChallenge LLC, Old Westbury, NY, and was supported in part by 1 U54 GM104940 from the National Institute of General Medical Sciences of the National Institutes of Health, which funds the Louisiana Clinical and Translational Science Center. The content is solely the responsibility of the authors and does not necessarily represent the official views of the National Institutes of Health.