
Abstract
Insulin resistance is the hallmark of classical type II diabetes. In addition, insulin resistance plays a central role in metabolic syndrome, which astonishingly affects 1 out of 3 adults in North America. The insulin resistance state can precede the manifestation of diabetes and hypertension by years. Insulin resistance is correlated with a low-grade inflammatory condition, thought to be induced by obesity as well as other conditions. Currently, the methods to measure and monitor insulin resistance, such as the homeostatic model assessment and the euglycemic insulin clamp, can be impractical, expensive, and invasive. Abundant evidence exists that relates increased pulse pressure, pulse wave velocity (PWV), and vascular dysfunction with insulin resistance. We introduce a potential method of assessing insulin resistance that relies on a novel signal-processing algorithm, the intrinsic frequency method (IFM). The method requires a single pulse pressure wave, thus the term “ wave biopsy.”
The constellation of type II diabetes, central obesity, hyperlipidemia, and hypertension makes up what is commonly termed metabolic syndrome.1,2 Gerald Reaven in his 1988 Banting lecture 3 posited the idea that insulin resistance was potentially the underlying mechanism or at least a unifying feature. A study sponsored by the CDC 4 reported that 34% of adults in North America have metabolic syndrome. Several studies 5 have demonstrated that insulin resistance occurs years before the manifestation of type II diabetes, hyperlipidemia, and hypertension. Measuring and monitoring insulin resistance is challenging for the clinician. The “gold standard” euglycemic insulin clamp6,7 is an invasive and expensive technique performed exclusively in clinical research centers. The enormous population at risk for the metabolic syndrome underscores the need for a simple noninvasive diagnostic as a screening test.
Pulse Wave Velocity
Numerous reports have established a high correlation between insulin resistance and pulse wave velocity (PWV). 8 Puzantian et al 9 recently showed increase PWV in healthy adults while undergoing euglycemic insulin clamp studies: thus directly demonstrating the relationship of hyperinsulinemia and increased PWV. Increased PWV can precede the development of type II diabetes by many years, 10 a finding consistent with the standard theory of insulin resistance as a diabetes precursor. Type II diabetes and insulin resistance 11 are thought to induce dysfunctional elastin fibers in arterial walls thereby reducing vessel compliance (increasing rigidity) and increasing PWV. 12 Diabetes has been associated with the promotion of an increase in advanced glycation end products, 13 leading to endothelial dysfunction. Inflammation induced by obesity as well as other etiologies affects endothelial nitric oxide (NO) function, 14 which is vital for healthy vessel compliance. PWV reflects changes in arterial compliance and remarkably tracks almost all aspects of insulin disposition with respect to aging, type II diabetes, hyperinsulinemia, as well as the dynamic vascular response to insulin infusion, thus making PWV a good candidate index for insulin resistance. Clinical monitoring of PWV, while noninvasive and well correlated with insulin resistance, is decidedly impractical.
In a recently published study, 15 we applied a novel signal-processing algorithm, intrinsic frequency method (IFM), to clinical data (pressure wave forms) obtained from subjects with established cardiovascular disease along with healthy controls. The algorithm successfully screened and analyzed an array of cardiovascular pathologies. Moreover the IFM distinguished pathologies of vascular origin from those of cardiac disease. Motivated by our initial results we directed our attention toward the idea of monitoring insulin resistance as manifested by vascular dysfunction.
Physiological Basis of the IFM
PWV 16 is regarded as the gold standard for noninvasive measurements of Aortic rigidity. Aortic rigidity (and thus PWV) increases with age and hypertension. However, the PWV or speed of the wave is but one aspect of the information that a pulse wave imparts as it probes the arterial system. During systole the pulse wave travels forward but eventually part of the forward wave is reflected back when it encounters increasing resistance in the arterial tree. The augmentation index (AI) 16 is a measure of the pressure contribution of the reflected wave. It would be reasonable to assume that in addition to the wave speed (PWV), an analysis of the shape of the signal may also reveal significant physiological information. A deeper analysis of the pulse pressure wave signal, can only add valuable information about the insulin physiology. Evidence of this was already provided as early as 1980. A study by Rowe et al 17 showed strong correlation between pulse pressure and insulin resistance.
Here we present the results of a preliminary study to test the plausibility that IFM can be used to screen or monitor insulin resistance and the metabolic syndrome. Our investigation made use of data sets that contained combinations PWV and pulse pressures across a range of age groups. Since our signal reflects dynamic information in the arterial system, we took advantage of PWV as a parameter in calibrating our method and validating our initial analysis. A remarkable advantage of the IFM is the potential to infer pathology from a single pulse wave or what can be termed a “single wave biopsy.”
Methods
Adaptive method of sparse time-frequency representation is a modified version of instantaneous frequency methods such as empirical mode decomposition and sparse time-frequency representation methods in which the frequency is piecewise constant in time during a specified time period (eg, cardiac cycle). In these methods the signal is decomposed to a finite sum of intrinsic mode functions. The notion of the intrinsic mode functions was first introduced by Huang et al. 18 Using a sparse time frequency representation method, a more mathematical definition of the intrinsic mode function has been given by Hou and Shi, 19 as follows.
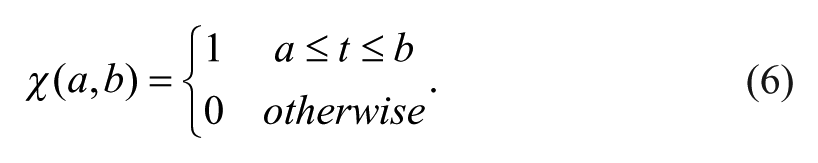
A signal f(t) is called an intrinsic mode function if there exists an envelope, a(t) > 0, and a phase function, θ(t), satisfying two properties:
a(t) is smoother than cos θ(t)
2- θ(t) is strictly increasing in time. In this case the IMF can be written as
Intrinsic Frequency Method
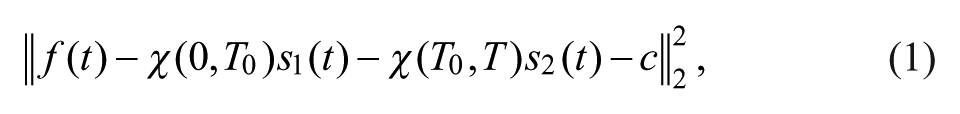
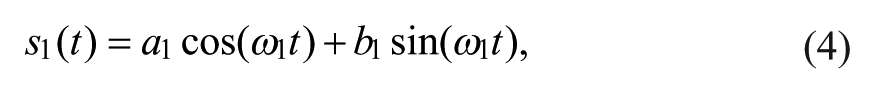
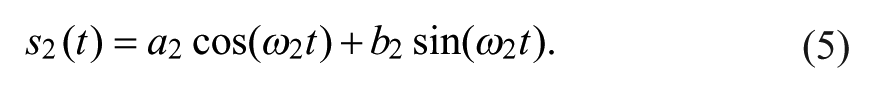
In this method, both the instantaneous frequency and envelope of the IFM are assumed to be piecewise constant in time. To extract the intrinsic frequency parameters and envelopes, a simple but effective norm-2 (L2) minimization method has been sued. In the case of systemic cardiovascular system, IF is applied on the pressure waveform. This waveform represents the coupled left ventricle-aorta system that decouples after the closure of the aortic valve (marked by the dicrotic notch). The L2 minimization problem, for the extraction of the trend and frequency content of the input aortic pressure wave, is as follows:
Minimize:
Subject to:

and
Here,
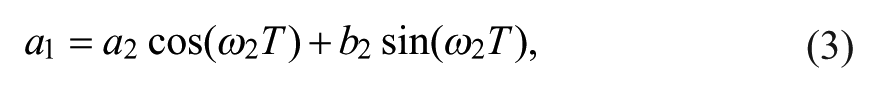
Equations 2 and 3 are linear constraints that ensure the continuity of the IMF at the time T0 (dicrotic notch) and the periodicity of the trend, respectively. In the case of aortic pressure waveform, T0 is the time of dicrotic notch when the aortic system gets decoupled from the left ventricle system. In IF method, the first IMF of the pressure wave is approximated by two piecewise constant frequencies (ω1 and ω2), which we refer to as intrinsic frequencies (IF) and piecewise constant envelopes (
Calculation of ω2, Δω (Δω = ω1-ω2) in the Figures
Clinical pressure waveforms were gathered from Salvi 20 to examine the potential clinical relevance of the IF method. These waveforms belong to a healthy population free of cardiovascular diseases and risk factor with known ages. The age values were used to calculate the corresponding PWV from the PWV-age regression curves for healthy population are again obtained from Salvi. 20
Figures 1 and 2 were generated from a computational model 15 we have previously published. Parameters were varied to demonstrate the changes in ω2, Δω (Δω = ω1-ω2) as described in the figures.
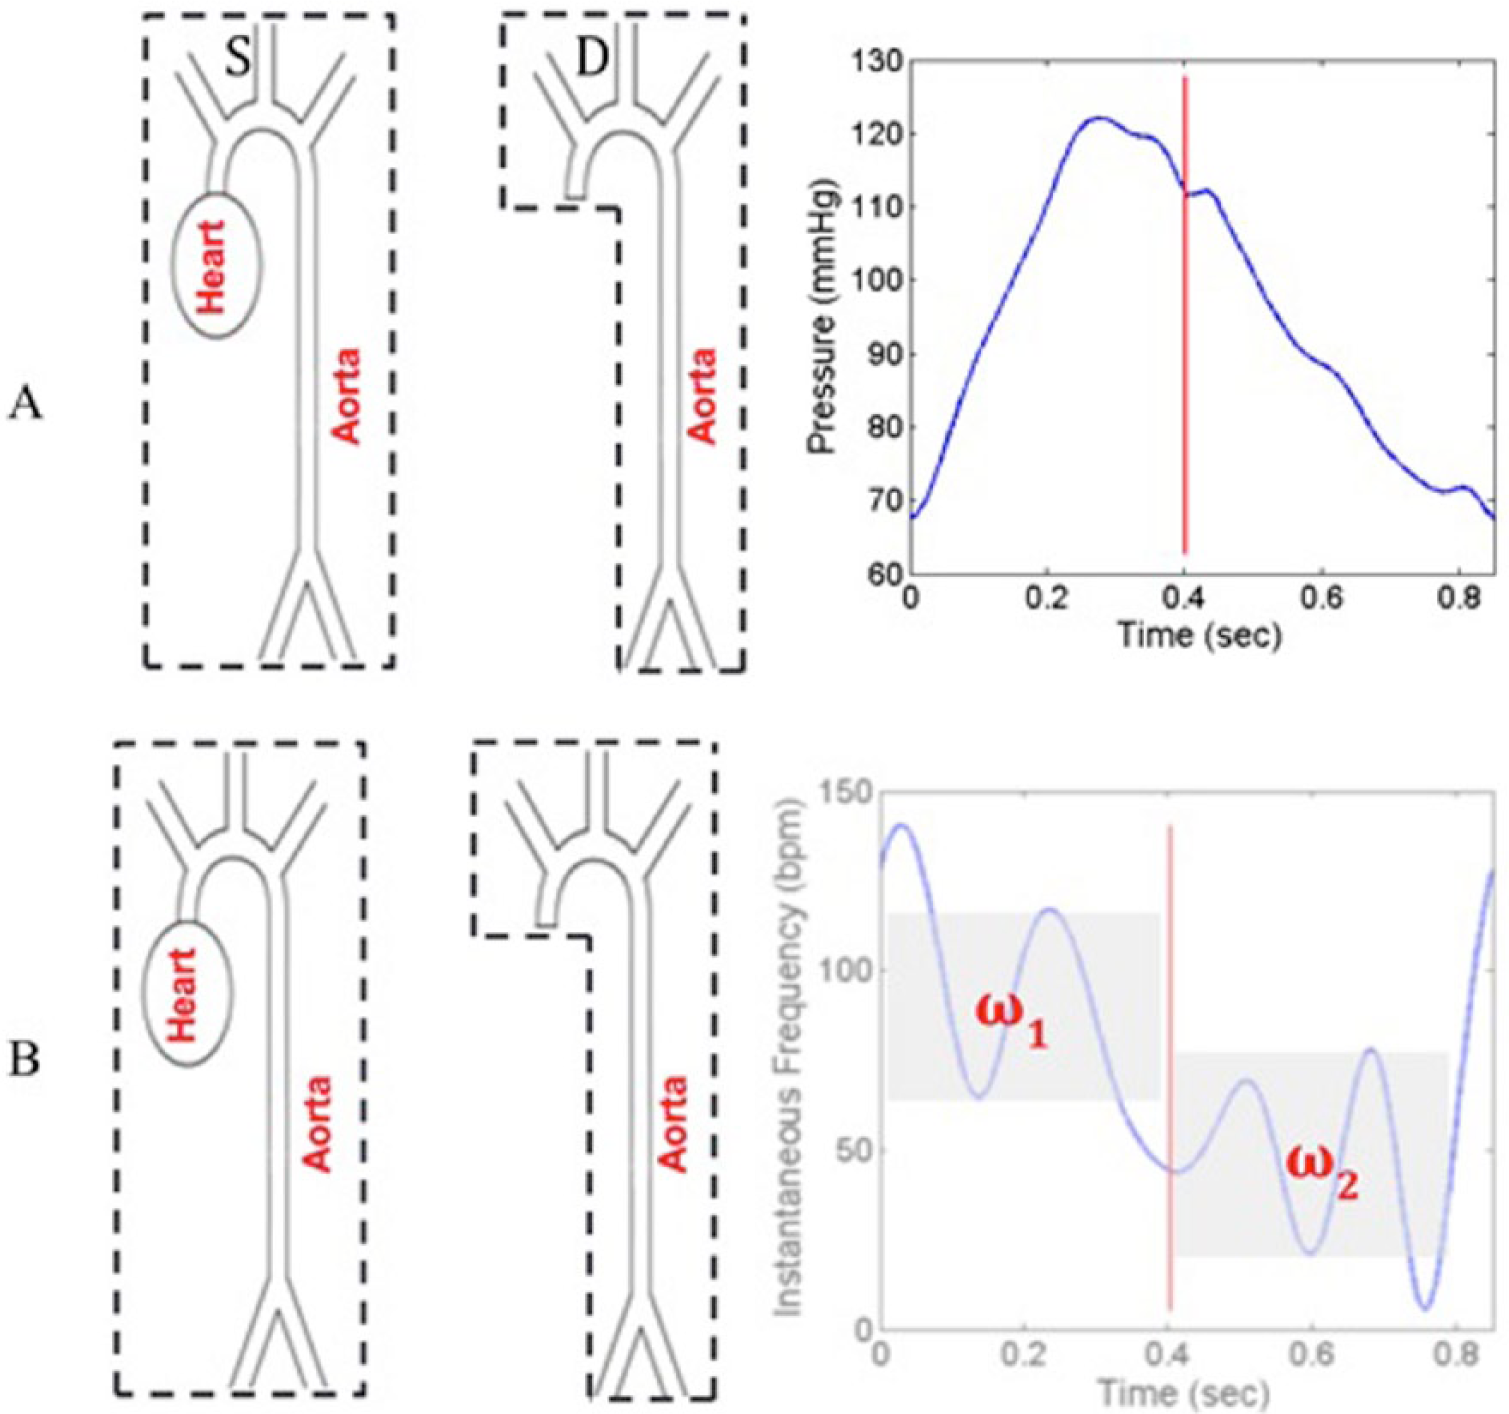
Intrinsic frequency method. In both A and B, the two physiological phases (systolic, diastolic) are shown on the left. The corresponding panels on the right represent the aortic pulse pressure curve and the intrinsic frequencies of the two phases below.
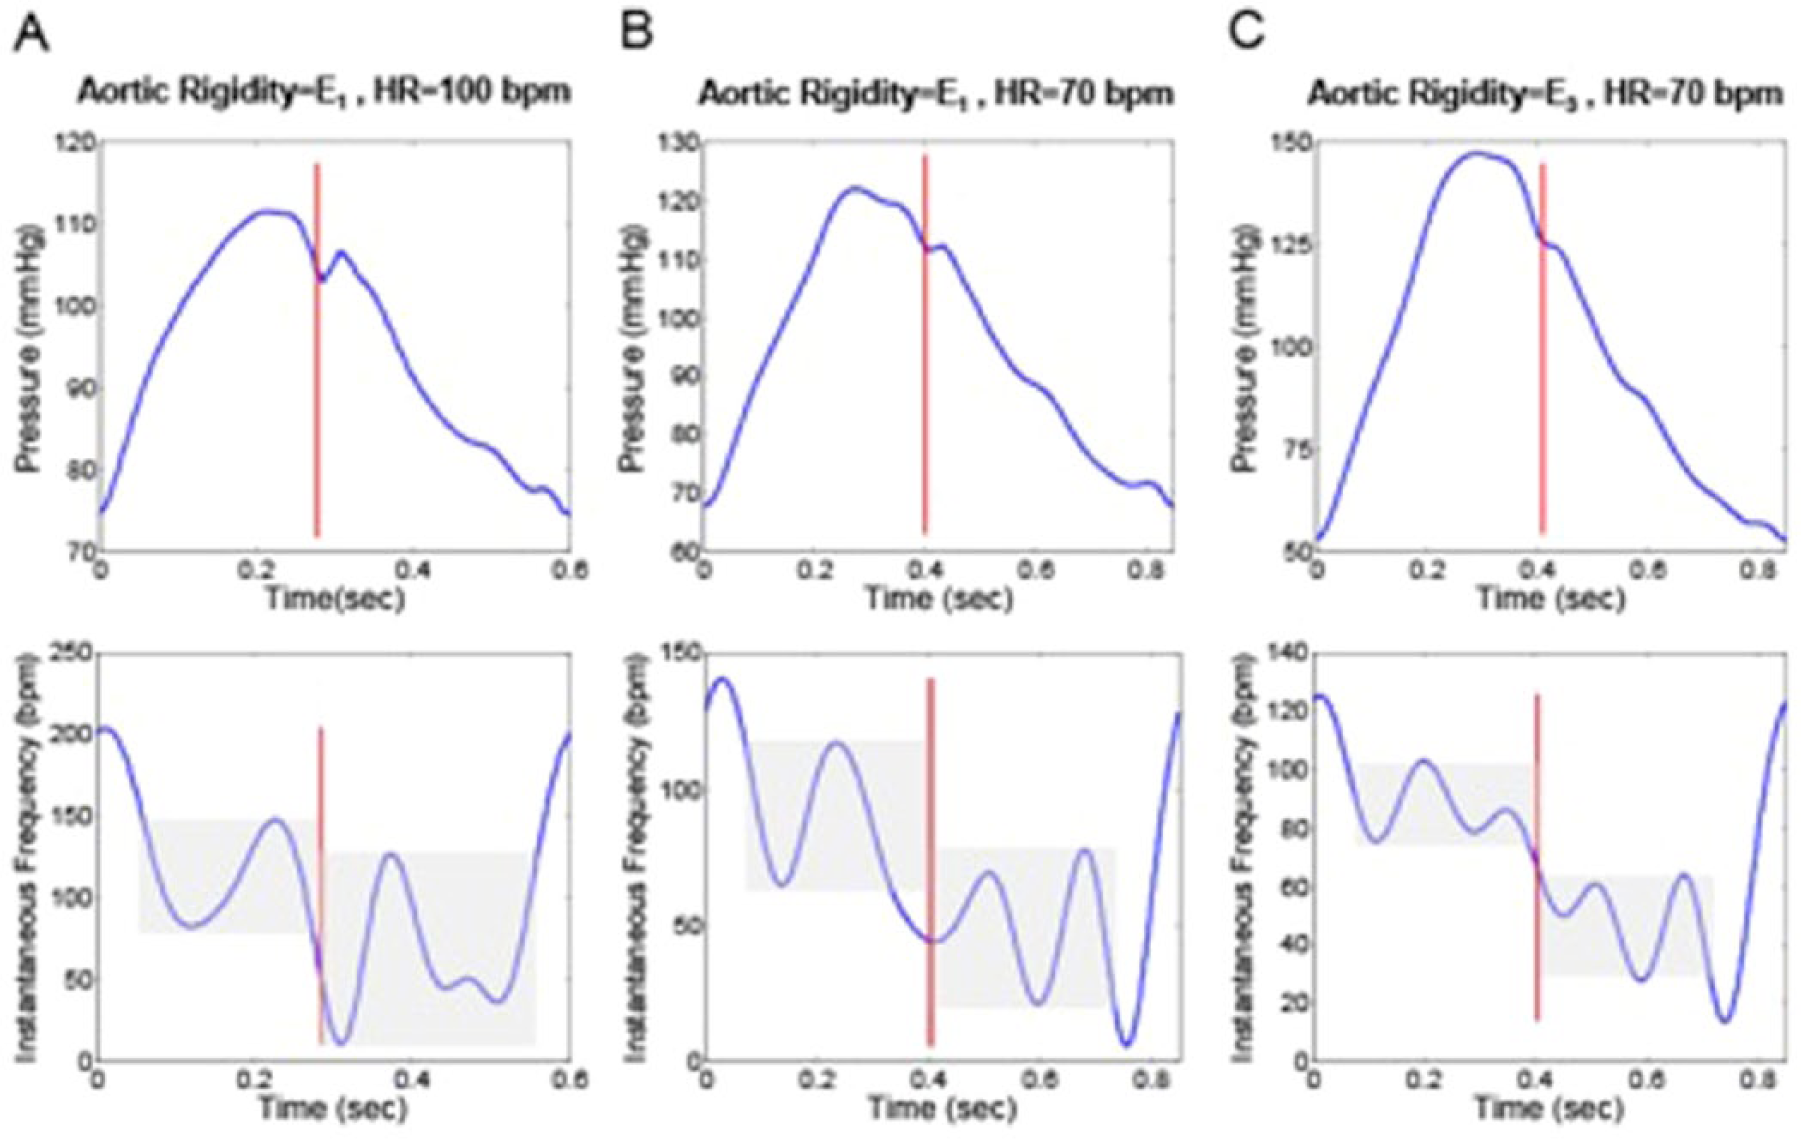
Instantaneous frequency of the first IFM. The range of instantaneous frequency oscillation (gray band) is altered to the right of the dicrotic notch (marked by the red line). (A) The instantaneous frequency (bottom) of the aortic input pressure (top) for an aorta with rigidity E1 at HR = 100 bpm. (B) Instantaneous frequency (bottom) of the aortic input pressure (top) for an aorta with rigidity E1 at HR = 70 bpm. (C) Instantaneous frequency (bottom) of the aortic input pressure (top) for an aorta with rigidity E3 at HR = 70 bpm (E3 = 1.5E1). E1 is the aortic rigidity of a 30-year-old healthy individual. 20
Patient Data
Figures 3, 4, and 5 make use of healthy patient data described and seen in the tables. Table S1 gives the references for the ages as well as the individual figure, where all the waveforms can be found in Nichols et al, 21 Kelly et al, 22 Denardo et al, 23 and Murgo et al 24 and in McDonald’s Blood Flow in Arteries: Theoretical, Experimental and Clinical Principles. The methodology used for waveforms acquisition is provided in the references.
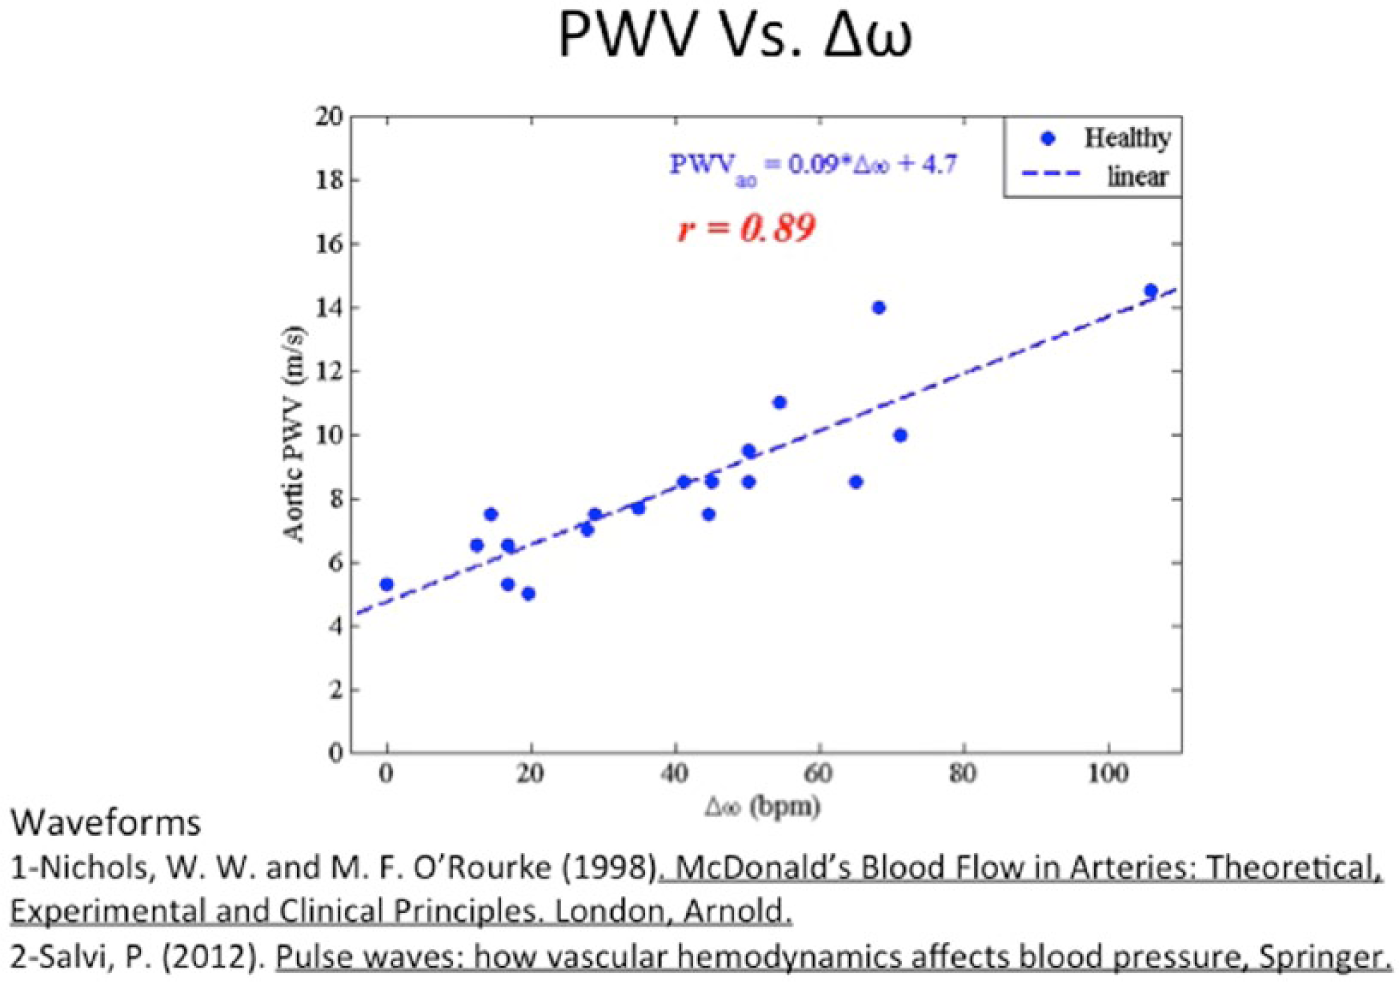
This graph shows the correlation between aortic PWV and Δω (Δω = ω1-ω2). The intrinsic frequencies were computed directly from raw waveforms and matched to the corresponding PWV.
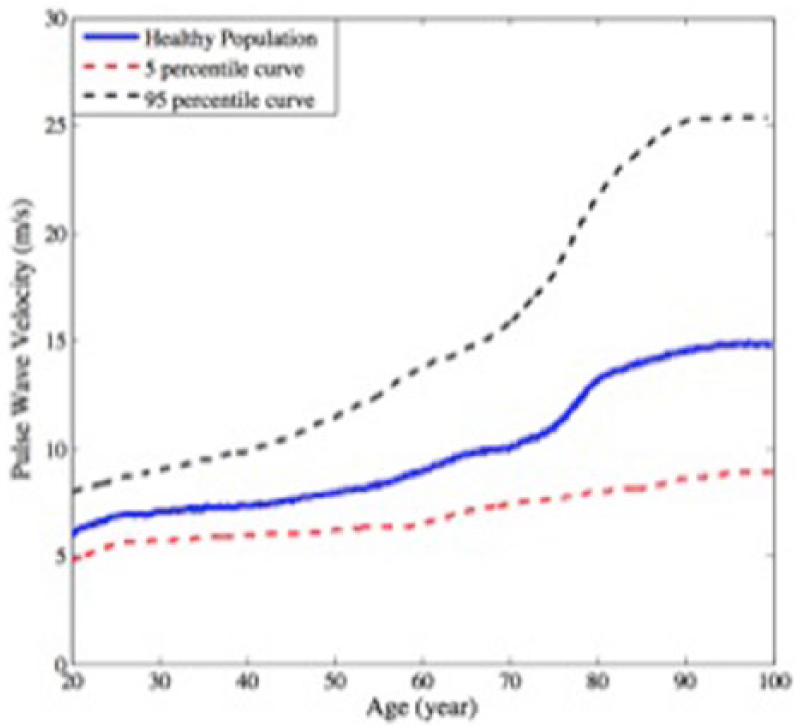
This graph shows the progressive increase in PWV and aging. The red and black curves depict the 5th and 95th percentiles of the sampled subjects.
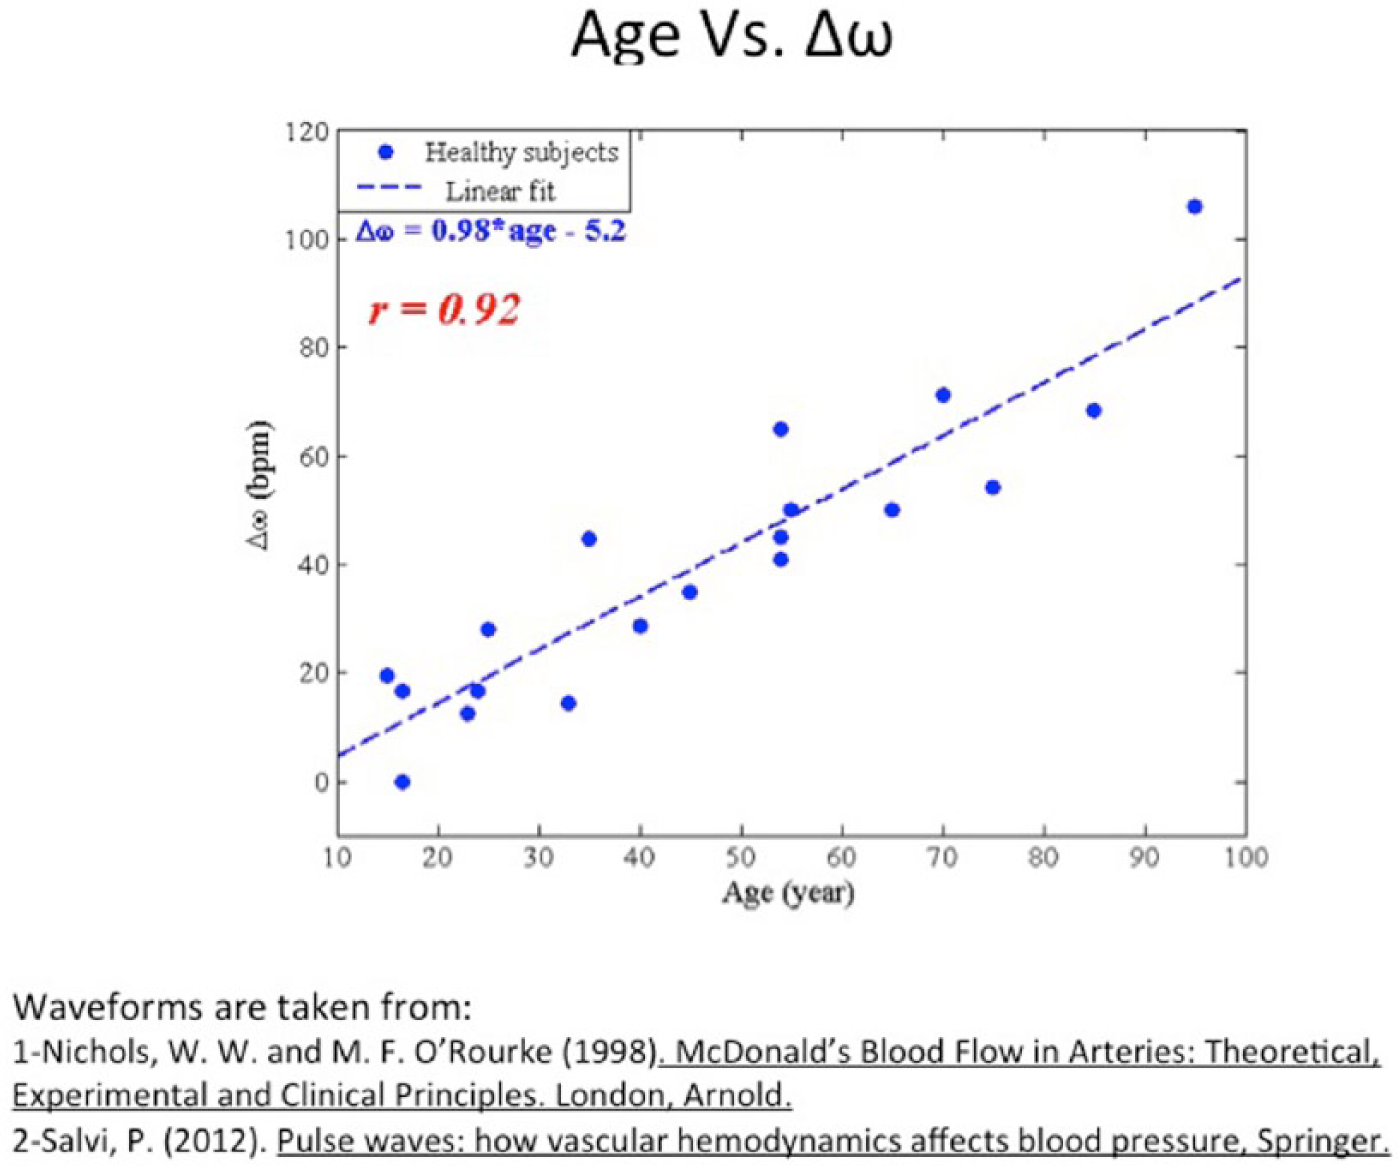
Δω versus age. Δω was computed directly from waveforms, and the associated ages were plotted against it. The correlation obtained is significant, r = .9.
The upper and lower error bars in Figure 4 data represent the PWV calculated based on 95th percentile and 5th percentile PWV-age curves, respectively. The PWVs have been calculated based on the average curve (blue curve in Figure 4).
It should be understood that the IFM requires only the shape of the given pressure waveform. Therefore, the method is agnostic to the type of measurement technique that acquires the signal: tonometry and imaging techniques (eg, using the camera of a smartphone) all can be used to collect the waveforms.
Results
An arterial pulse wave is graphically depicted as a pulse pressure curve. The typical aortic waveform is shown in Figure 1A, can be understood as two distinct systems combined in one cycle. The first (systolic or S) phase represents the heart connected to the arterial system via an open aortic valve. In the second (diastolic or D) phase the heart and arterial system disconnect or decouple since the valve is shut. The dicrotic notch coincides with the closure of the aortic valve and marks the phase change. The pulse pressure curve naturally lends itself to be analyzed as two systems signals S and D each with distinctive physiology and pathophysiology.
In the world of signal processing, the most common tool is the Fourier transform: which yields information about frequency but provides no information about how the frequency varies over time. Time-frequency analysis 25 is a procedure that decomposes a one-dimensional signal into two domains. Perhaps the most commonly recognized time-frequency graph is the musical score, in which the notes represent frequency (Y axis) and time is represented along the X-axis. Sparse time frequency analysis 26 represents a class of methods that is rich with applications across many scientific disciplines including seismology and quantum mechanics. The key result is that a single signal decomposes into a sum of intrinsic oscillatory components.
In our algorithm (see methods) the dominant component of each signal is denoted as the intrinsic frequency. We apply this algorithm two both the S phase and D phase of the pulse pressure wave with the idea that they represent distinct physiological information. Figure 1B shows the decomposition of S and D into two intrinsic frequencies ω1 and ω2 respectively: Δω denotes the difference between the two. Previously, 15 we applied the algorithm to clinical data (pressure wave forms) obtained from subjects with established cardiovascular disease as well as from healthy controls. We showed that ω1 corresponded to cardiac pathology while ω2 and Δω (Δω = ω1-ω2) corresponded specifically to vascular disease.
The cardio-arterial system in Figure 1 is depicted as having two separate phases: the S phase in which the aortic valve is open and connects the heart to the arterial system and D in which the aortic valve is closed and the heart and the arterial system are disconnected. On the right panel of Figure 1A, we show the associated pulse pressure curve and the red bar identifies the dicrotic notch representing the valve closure or phase change. In Figure 1B, we show the associated Intrinsic frequency modes ω1 and ω2 in gray.
In Figure 2, we demonstrate the changes in ω1 and ω2 with varying parameters of Aortic rigidity and heart rate. It is worth noting that in panel A, the height of the gray areas depicting ω1 and ω2 are almost the same. The Δω (Δω = ω1-ω2) in this case is closer to zero, which we have reported previously as being optimal with respect to minimizing the workload of the heart. This is the typical pattern we see in the healthy young. Increasing the rigidity (elastance) results in a separation of the heights of the gray bars. Panel C is associated with the highest rigidity and the greatest Δω (note aortic rigidity E3 > E1)
IFM and Aortic Rigidity
In Figure 3 we show the correlation between PWV and Δω. The Δω values were computed directly from waveforms obtained from healthy subjects and plotted against the corresponding PWV.20,21 The degree of correlation r = .89 is significant.
IFM, PWV, and Aging
PWV is known to increase with age. This increase is believed to be a result of increased rigidity in the central arteries. Figure 4 is an example taken from a study that demonstrates the increase in PWV and aging in both men and women. Figure 5 shows the relationship of Δω and age. The Δω was computed directly from published data and plotted against the corresponding age of the subjects. The value r = .92 demonstrates the high degree of correlation.
The pressure waveforms in Figure 5 were obtained from the carotid artery and thus representing the central artery physiology.
Discussion
Insulin resistance likely plays a central role in all manifestations of the metabolic syndrome; Hypertension, central obesity, hyperlipidemia and type II diabetes. Insulin resistance has been shown to occur even years before the manifestation of diabetes or hypertension. 27 Mounting evidence suggests that insulin resistance as manifested by vascular dysfunction may ultimately be a measure of inflammation. 28 Clearly, early diagnosis and subsequent monitoring of insulin resistance could have a substantial impact on the evolution and therapy of the metabolic syndrome. PWV increases with aging, 29 and correlates with the rise in insulin resistance as well as the diminishing glucose tolerance in the elderly. Empirically there seems to be an intimate and dynamic, if not direct, relationship between insulin resistance and the arterial system. Vessel compliance influences PWV, and the vascular response to insulin can occur on time scales of minutes. Leveraging this physiological relationship, we proceeded to study arterial pulse pressure data using a sparse time-frequency analysis method, IFM.
Our preliminary investigation showed that Δω is highly correlated with PWV (r = .89, Figure 3). In addition, the increase in Δω with aging (r = .92, Figure 5, is in strong correspondence to changes seen with both PWV and insulin resistance with respect to age. The Δω was computed directly from the clinical data waveforms.
The decision to use Δω in favor of ω2 as the key vascular parameter in this study was motivated by the following considerations. The pulse pressure curve contains signals that include the forward signal, the reflected signal as well as the local physiology. ω2 represents the vascular or diastolic (D) phase of the cycle and may not capture the entire physiological picture. Δω includes both the systolic (S) and D phases. Therefore we posited that Δω is perhaps a more complete measure of information with respect to the vascular system.
The present study gives encouraging evidence that the IFM is demonstrating physiology in parallel to PWV. A limiting feature of PWV is that it is strictly a one-dimensional measure of the speed of the forward signal that emanates from the heart and travels down an arterial path. The choice of a particular path or paths may yield insight into the local physiology as compared to other paths, that is, carotid-femoral. A criticism and challenge of using PWV is that measurement is highly dependent on the assumed vessel length. 30 The length under most circumstances is estimation.
IFM, on the other hand, does not rely on vessel length for its measurement. Its entire analysis depends strictly on the pulse pressure signal regardless of the path length. The information contained in the signal maybe different depending on which signal acquisition site is being measured. This creates an opportunity to learn more about the cardiovascular system and the regional physiology. The validation of IFM as an insulin resistance diagnostic will require prospective clinical studies that include HOMA data, euglycemic clamp procedures, and potentially serological markers of inflammation.
The convergence among medicine, technology, and telecommunication is creating a new class of diagnostics and therapeutics. Pulse pressure signals can easily be acquired optically by standard cameras on smartphones. As such, the algorithm is trivially implemented as a smartphone app and could eventually be used by nonexperts in nonclinical settings, thus creating a convenient telemedicine application. With refinement the IFM could join an emerging class of diagnostics that provide clinicians with noninvasive tools for screening and monitoring vascular and metabolic function.
Footnotes
Abbreviations
AI, augmentation index; HOMA, homeostatic model assessment; IFM, intrinsic frequency method; NO, nitric oxide; PWV, pulse wave velocity.
Declaration of Conflicting Interests
The author(s) declared no potential conflicts of interest with respect to the research, authorship, and/or publication of this article.
Funding
The author(s) disclosed receipt of the following financial support for the research, authorship, and/or publication of this article: NMP was supported by an American Heart Association grant.
References
Supplementary Material
Please find the following supplemental material available below.
For Open Access articles published under a Creative Commons License, all supplemental material carries the same license as the article it is associated with.
For non-Open Access articles published, all supplemental material carries a non-exclusive license, and permission requests for re-use of supplemental material or any part of supplemental material shall be sent directly to the copyright owner as specified in the copyright notice associated with the article.