
Abstract
Background:
The use of continuous glucose monitoring (CGM) in clinical decision making in diabetes could be limited by the inaccuracy of CGM data when compared to plasma glucose measurements. The aim of the present study is to investigate the impact of CGM numerical accuracy on the precision of diabetes treatment adjustments.
Method:
CGM profiles with maximum 5-day duration from 12 patients with type 1 diabetes treated with a basal-bolus insulin regimen were processed by 2 CGM algorithms, with the accuracy of algorithm 2 being higher than the accuracy of algorithm 1, using the median absolute relative difference (MARD) as the measure of accuracy. During 2 separate and similar occasions over a 1-month interval, 3 clinicians reviewed the processed CGM profiles, and adjusted the dose level of basal and prandial insulin. The precision of the dosage adjustments were defined in terms of the interclinician agreement and the intraclinician reproducibility of the decisions. The Cohen’s kappa coefficient was used to assess the precision of the decisions. The study was based on retrospective and blind CGM data.
Results:
For the interclinician agreement, in the first occasion, the kappa of algorithm 1 was .32, and that of algorithm 2 was .36. For the interclinician agreement, in the second occasion, the kappas of algorithms 1 and 2 were .17 and .22, respectively. For the intraclinician reproducibility of the decisions, the kappas of algorithm 1 were .35, .22, and .80 and the kappas of algorithm 2 were .44, .52, and .32, for the 3 clinicians, respectively. For the interclinician agreement, the relative kappa change from algorithm 1 to algorithm 2 was 86.06%, and for the intraclinician reproducibility, the relative kappa change from algorithm 1 to algorithm 2 was 53.99%.
Conclusions:
Results indicated that the accuracy of CGM algorithms might potentially affect the precision of the CGM-based insulin adjustments for type 1 diabetes patients. However, a larger study with several clinical centers, with higher number of clinicians and patients is required to validate the impact of CGM accuracy on decisions precision.
Keywords
Tight regulation of blood glucose (BG) by intensive insulin therapy delays the onset of late diabetes complications caused by high BG level,1-5 but also increases the risk of hypoglycemia by 2- to 3-fold.6,7 In recent years, the use of continuous glucose monitoring (CGM) has provided patients and health care professionals with new data on daily-life glycemic fluctuations. Hence, CGM has the potential to reduce glycosylated hemoglobin (HbA1c) while reducing the risk of hypoglycemia.8-10
CGM can improve the quality of glycemic control by serving as an adjunctive tool for clinicians in diabetes decision making. The decisions usually comprises a set of adjustments in diabetes treatment to avoid the incidence of glycemic excursion, for example, adjusting the insulin type and dosage, changing the frequency and timing of insulin administrations, altering the insulin-to-carbohydrate ratio, avoiding simple sugars, and using glucose tablets instead of food to treat hypoglycemia.9-17
It is also suggested that having access to CGM data of sufficient accuracy is a necessity to achieve a good diabetes management through CGM.18-20 There are continuous efforts to improve accuracy of CGM,21,22 and their outcomes are generally evaluated using a verity of numeric performance metrics such as absolute relative difference of CGM values from BG levels,23-26 Clarke error grid analysis,26-29 and hypo- and hyperglycemia sensitivity and specificity.30,31
The effect of CGM accuracy on the success of diabetes management may be considered in 2 different aspects. First, the treatment recommendations which are based on more accurate CGM are expected to be more valid and accurate, and this can be evaluated by screening the level of success to achieve glycemic goals over time.9,13,15-17 Second, a more accurate CGM might help health care providers making more precise recommendations for treatment adjustment. The precision of decisions can be defined in terms of reproducibility of the recommendations from one clinician to the next, as well as by one clinician on separate occasions. Reproducibility is considered as a necessary quality of subjective review of visual data by clinicians such as interpretation of radiographs, computed tomography (CT) images, and achromatic automated static perimetry images of eye.32-34 It can be expected that the same quality is required also for reviewing CGM graphs by clinicians. The absence of reproducibility makes it difficult to comprehend and compare the results of the treatment adjustments on glycemic control, and the glycemic outcomes—resulting from imprecise treatment adjustments—may not converge to the predetermined and targeted glycemic goal. Lack of agreement and reproducibility may result in incorrect recommendations for diabetes treatment adjustment. A correct clinical decision for diabetes treatment is a decision which is appropriate for an identified glycemic abnormality, and could be made by an expert panel of diabetes specialist. 35 It should be noted that even with perfectly accurate CGM data, clinicians may still disagree on the decision if, for example, they decide to adjust either basal or meal insulin which could both be reasonable and correct decisions.
Metzger et al 36 demonstrated that the inaccuracy of CGM (CGMS, Medtronic, Northridge, CA) caused 35% absence of reproducibility in the subjective clinical interpretation of CGM graphs, and that could consequently result in 17% of incorrect clinical recommendations. Hence, the more precise recommendations are considered more reliable to apply. The literature about the effect of improving CGM accuracy on the precision of clinical recommendations for diabetes treatment adjustment is scarce, demonstrating that this issue requires further investigation.
The purpose of this study is to assess whether the increased numerical accuracy of CGM can be translated into higher interclinician agreement and intraclinician reproducibility of CGM-based clinical decisions in diabetes management.
Subjects and Methods
CGM Profiles
CGM data were recorded by using SCGM1 (Roche Diagnostics, Mannheim, Germany), which is a microdialysis-based CGM system. 37 The data were from more than 200 outpatients with type 1 and type 2 diabetes mellitus. Capillary BG values were measured by nurses up to 20 times per day. The maximum data recording duration was 5 days per patient. The collection of the CGM data was approved by the ethics committees of the centers participating in the CGM data recording. Signed consents were taken from all subjects.
Insulin and Meal Information
All patients received neutral protamine hagedorn (NPH) as basal insulin, and either insulin lispro (LIS) or regular human insulin (RHI) as prandial insulin. The insulin information was recorded by the patients. The LIS or RHI insulin with the highest dosage within ±2 hours of the times 8
The meal timing was detected with reference to the insulin timing. The highest carbohydrate amount within ±1 hour after each prandial insulin administration was considered as a main meal. Any carbohydrate intake closer than 15 minutes to a main meal was added to the main meal. 38
Subjects
The inclusion and exclusion criteria for the subjects included in this analysis are given in Table 1. All the subjects were outpatients.
Subjects’ Inclusion and Exclusion Criteria.
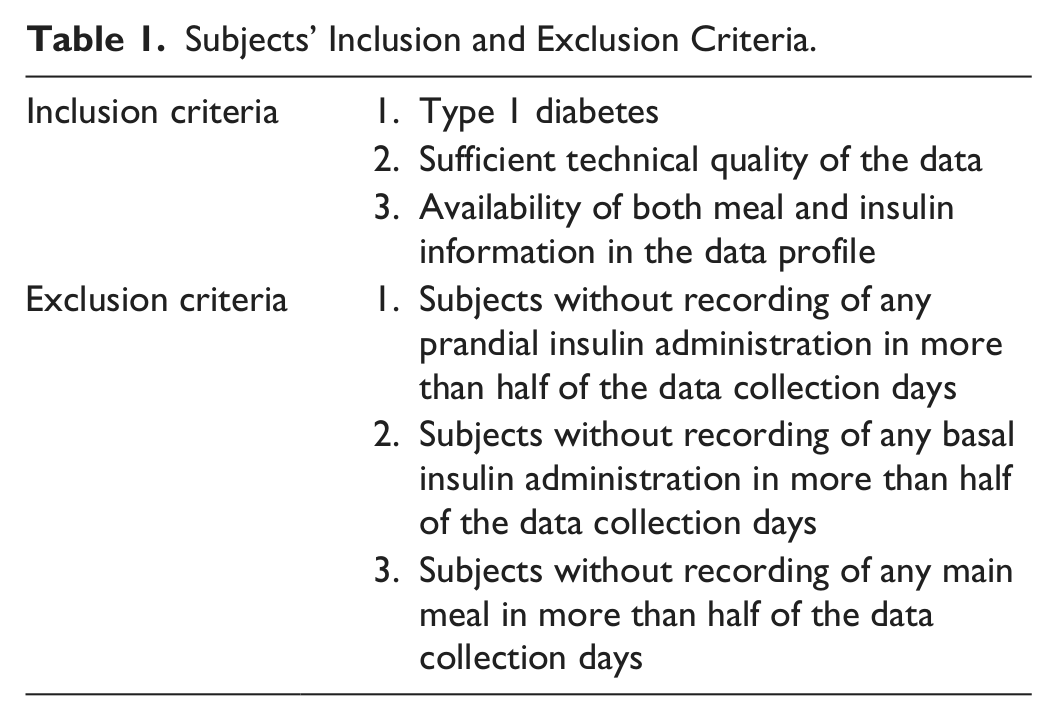
Applying the inclusion criteria 1 and 2 left 135 type 1 diabetes patients. Because many of the patients did not comply with the instruction regarding the recording of the insulin and meal information, only 27 patients out of 135 remained, after applying inclusion criterion 3. By applying the exclusion criteria, we finally retained data sets from 12 type 1 diabetes patients including 10 patients with NPH and LIS insulin regimen and 2 patients with NPH and RHI insulin regimen.
Study Design
Figure 1 demonstrates the exploited study design.
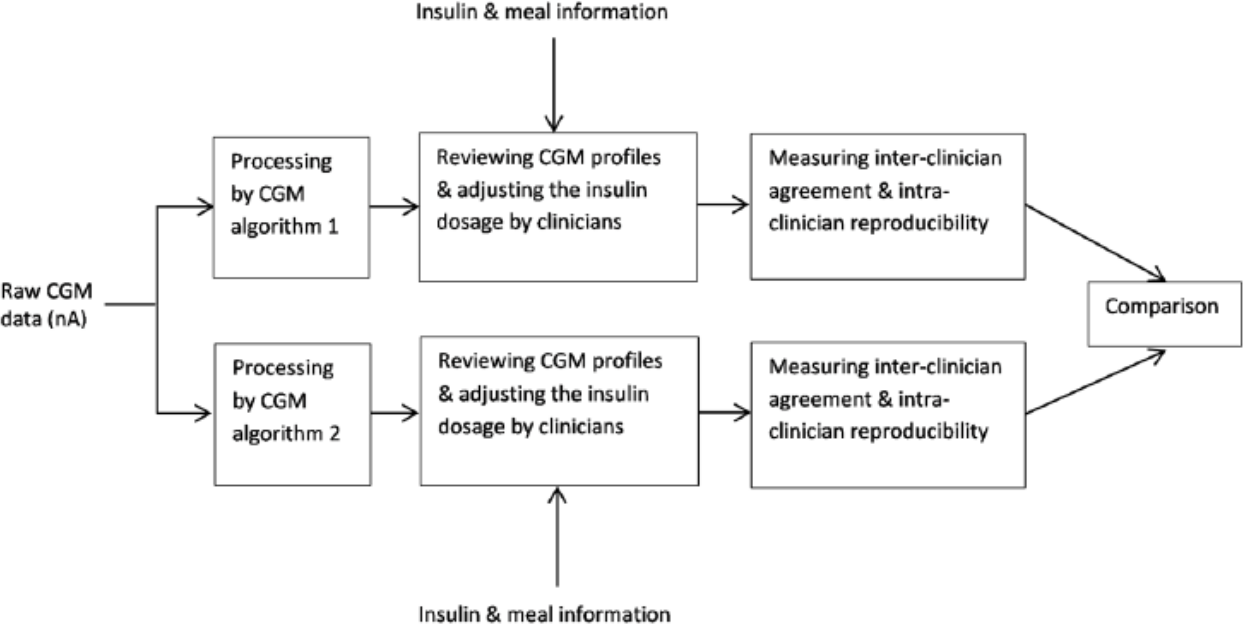
Study design.
CGM Processing
The raw CGM data from SCGM1 were processed by 2 CGM algorithms presented in Table 2. The first algorithm is the original manufacturer CGM algorithm implemented in SCGM1 (Roche Diagnostics, Mannheim, Germany), which has a 1-point calibration,39,40 and the second algorithm has the method described by Mahmoudi et al. 41
The CGM Algorithms Applied to the Raw CGM Data.
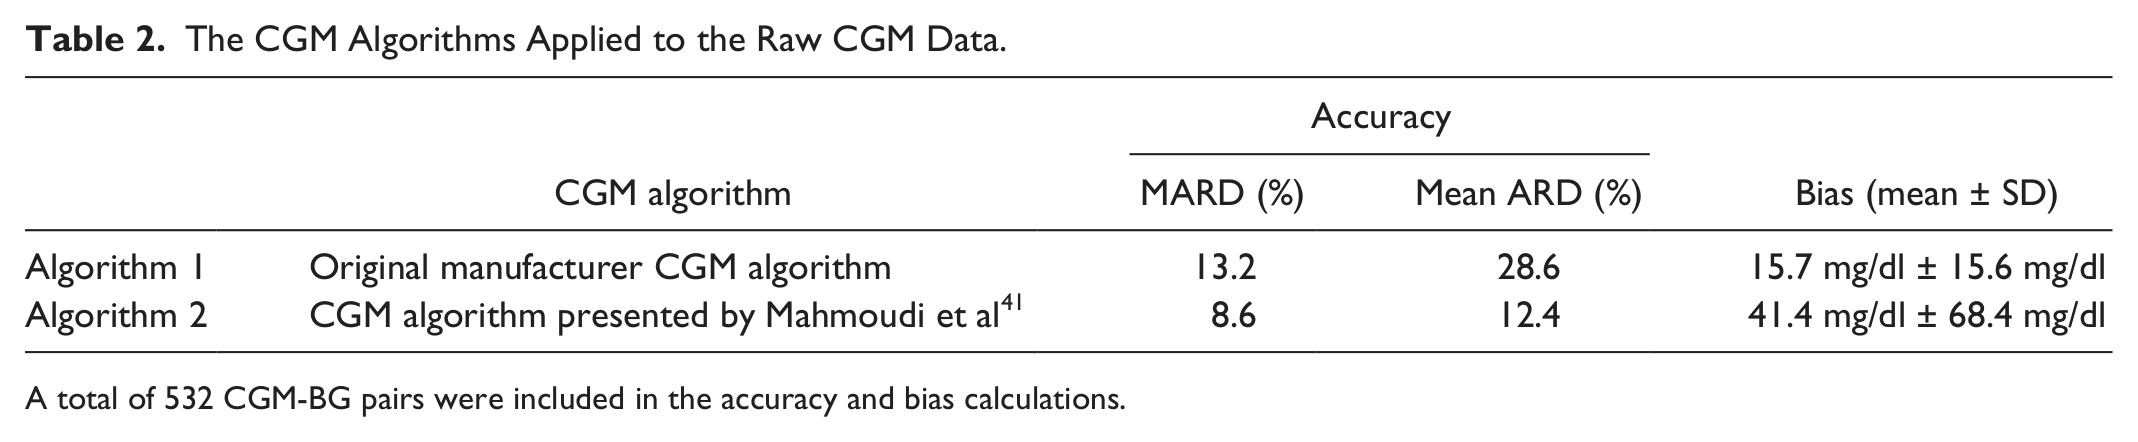
A total of 532 CGM-BG pairs were included in the accuracy and bias calculations.
The accuracy of the data was measured by calculation of the median absolute relative difference (MARD), and the mean absolute relative difference (mean ARD) of the calibrated CGM readings from concurrent reference BG levels. Bias was defined as the absolute difference of the CGM readings from concurrent BG values. The accuracy and bias calculations were based on 532 CGM-BG pairs. Regarding the fact that each patient had up to 20 CGM-BG pairs which were all included in these calculations, we speculate that the number of pairs is sufficient to have acceptable estimates of accuracy and bias. However, because the CGM accuracy depends on several factors including the glucose range, distribution and rate-of-change, 42 a more thorough accuracy evaluation of algorithm 2 is necessary, which is already provided in the studies by Mahmoudi et al.43,44 The CGM data processed by algorithm 2 had higher averaged accuracy, and lower averaged bias. In addition, for each patient, the accuracy of the CGM processed by algorithm 2 was higher than the accuracy of the CGM processed by algorithm 1. Because reviewing the data by the clinicians was offline, for having the maximum agreement between CGM readings and concurrent reference BG values, for both algorithms the CGM data after calibration were shifted 10 minutes ahead to compensate for the physiological delay between the reference BG values and the CGM readings. 41
CGM Reviewing Procedure
Three clinicians including 1 nurse and 2 doctors reviewed patients' CGM profiles in 2 occasions and made decisions on adjusting the insulin dosage—based on screening of the CGM profiles—with the aim of avoiding the incidence of glycemic excursions. There was a 1-month interval between the 2 occasions of reviewing. All 3 clinicians were experienced in detecting glycemic daily patterns from CGM data, and were experts in interpretation of those patterns and adjusting diabetes treatments based on them.
A few days before each reviewing occasion, the clinicians were provided with a written list of guidelines to be reminded on the procedures for reviewing and interpreting CGM data for therapeutic decision making. In the guidelines, they were asked to investigate the data for finding daily hypoglycemic and hyperglycemic patterns, and preprandial and postprandial glycemic variations, and to decide to adjust any of the breakfast insulin, lunch insulin, or dinner insulin to treat and avoid the undesired pattern. Using the same guidelines for the clinicians increased the confidence that they would use the same rules for CGM interpretation and decision making. The clinicians were also instructed to consider if the data were adequate and the patterns were sufficient for dosage recommendations and to indicate if so. The clinicians had access to the guidelines during the CGM reviewing and were allowed to refer to the guidelines as many times as they needed.
CGM Profiles
A CGM profile for each patient consists of 3 CGM graphs and 5 tables, which together contain the CGM traces, BG information, meal and insulin information, patients’ demographic data including age, gender, body mass index, HbA1c, and the time since diagnosed with diabetes. The CGM profiles were given to the clinicians in print version, and the clinicians had access to all information in the CGM profiles, including the type of insulin regimen (NPH and RHI vs NPH and LIS).
The CGM graphs were prepared in MATLAB® (7.12.0 (R2011a), The MathWorks, Natick, MA, USA).
Figures 2, 3, and 4 illustrate an example of the CGM graphs in the profile from 1 of the patients who uses RHI as prandial insulin. Figure 2 gives the daily summary of the CGM profile. In the figure, prandial insulin and NPH insulin administrations, at the time points that they are taken, are identified by vertical black bars and vertical pink bars, respectively. Meals are indicated by black diamond markers at the time they are taken. BG measurements are indicated by red cross markers in the figure. The target glycemic range in all figures is identified as the range between hypoglycemia (3.9 mmol/l) and hyperglycemia (10 mmol/l).
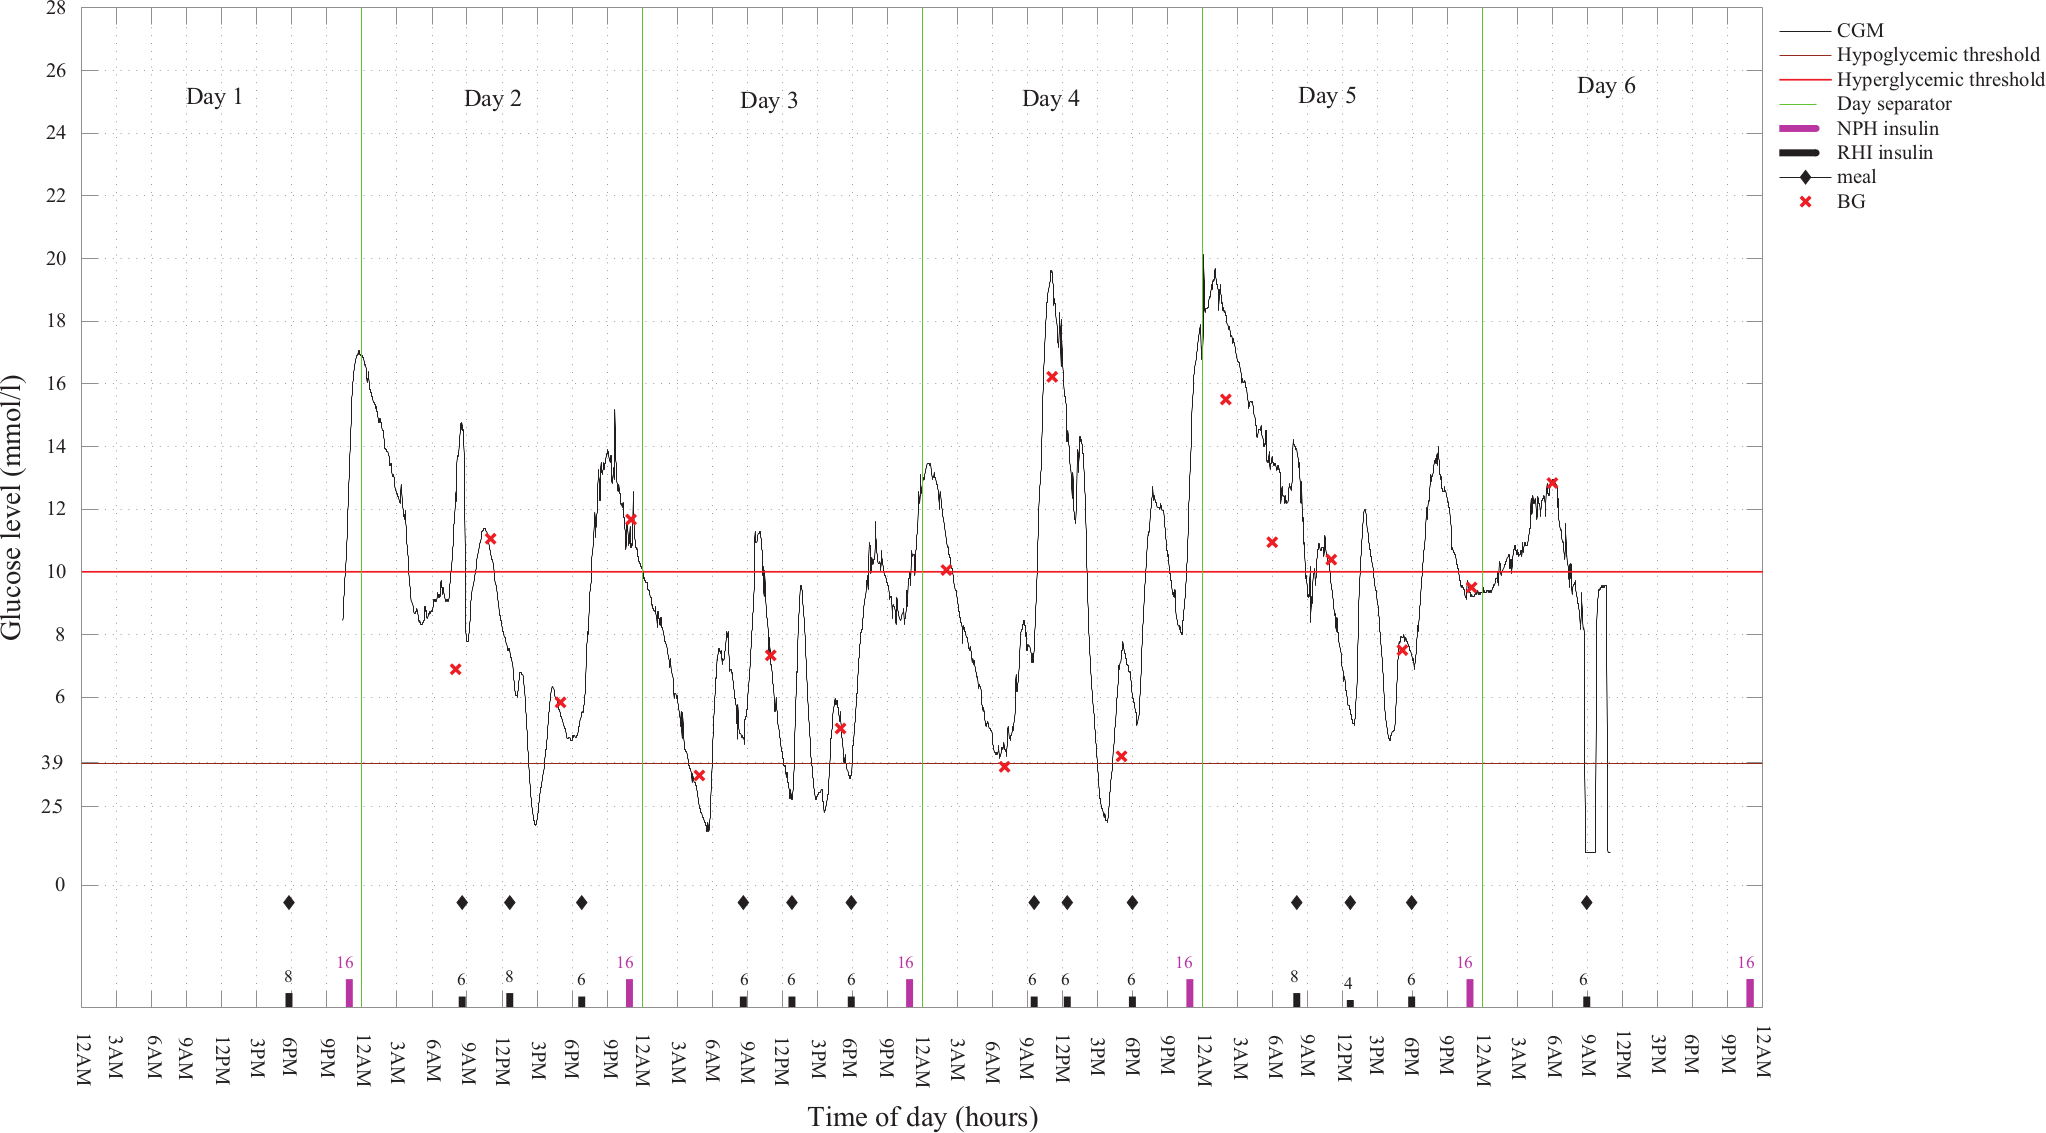
The daily summary of a CGM profile, along with BG measurements, and prandial and basal insulin timing and dosage information from a patient with NPH as basal and RHI as prandial insulin. The CGM data are processed with the algorithm 1.
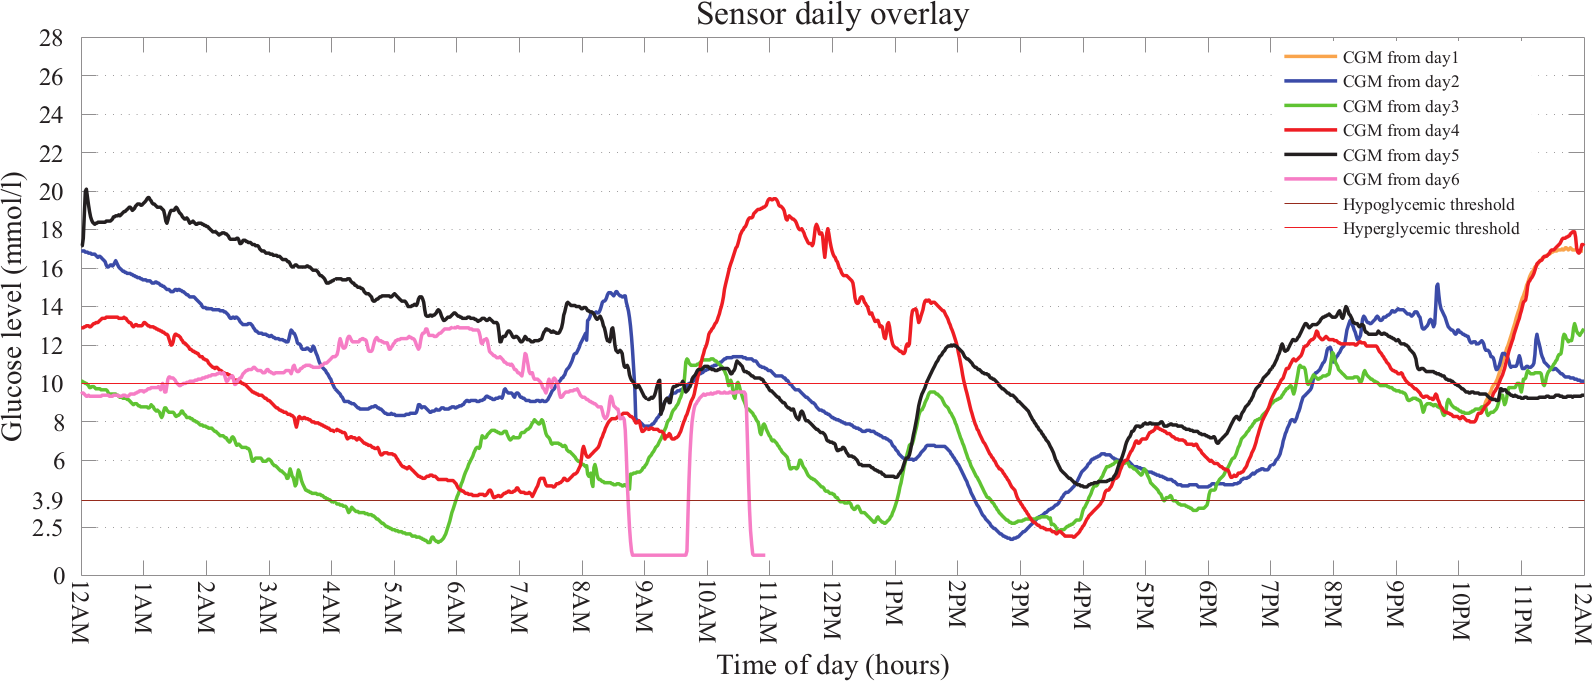
Daily overlay graph of CGM readings for the same patient as in Figure 2. The CGM data for each day are plotted from 12:00
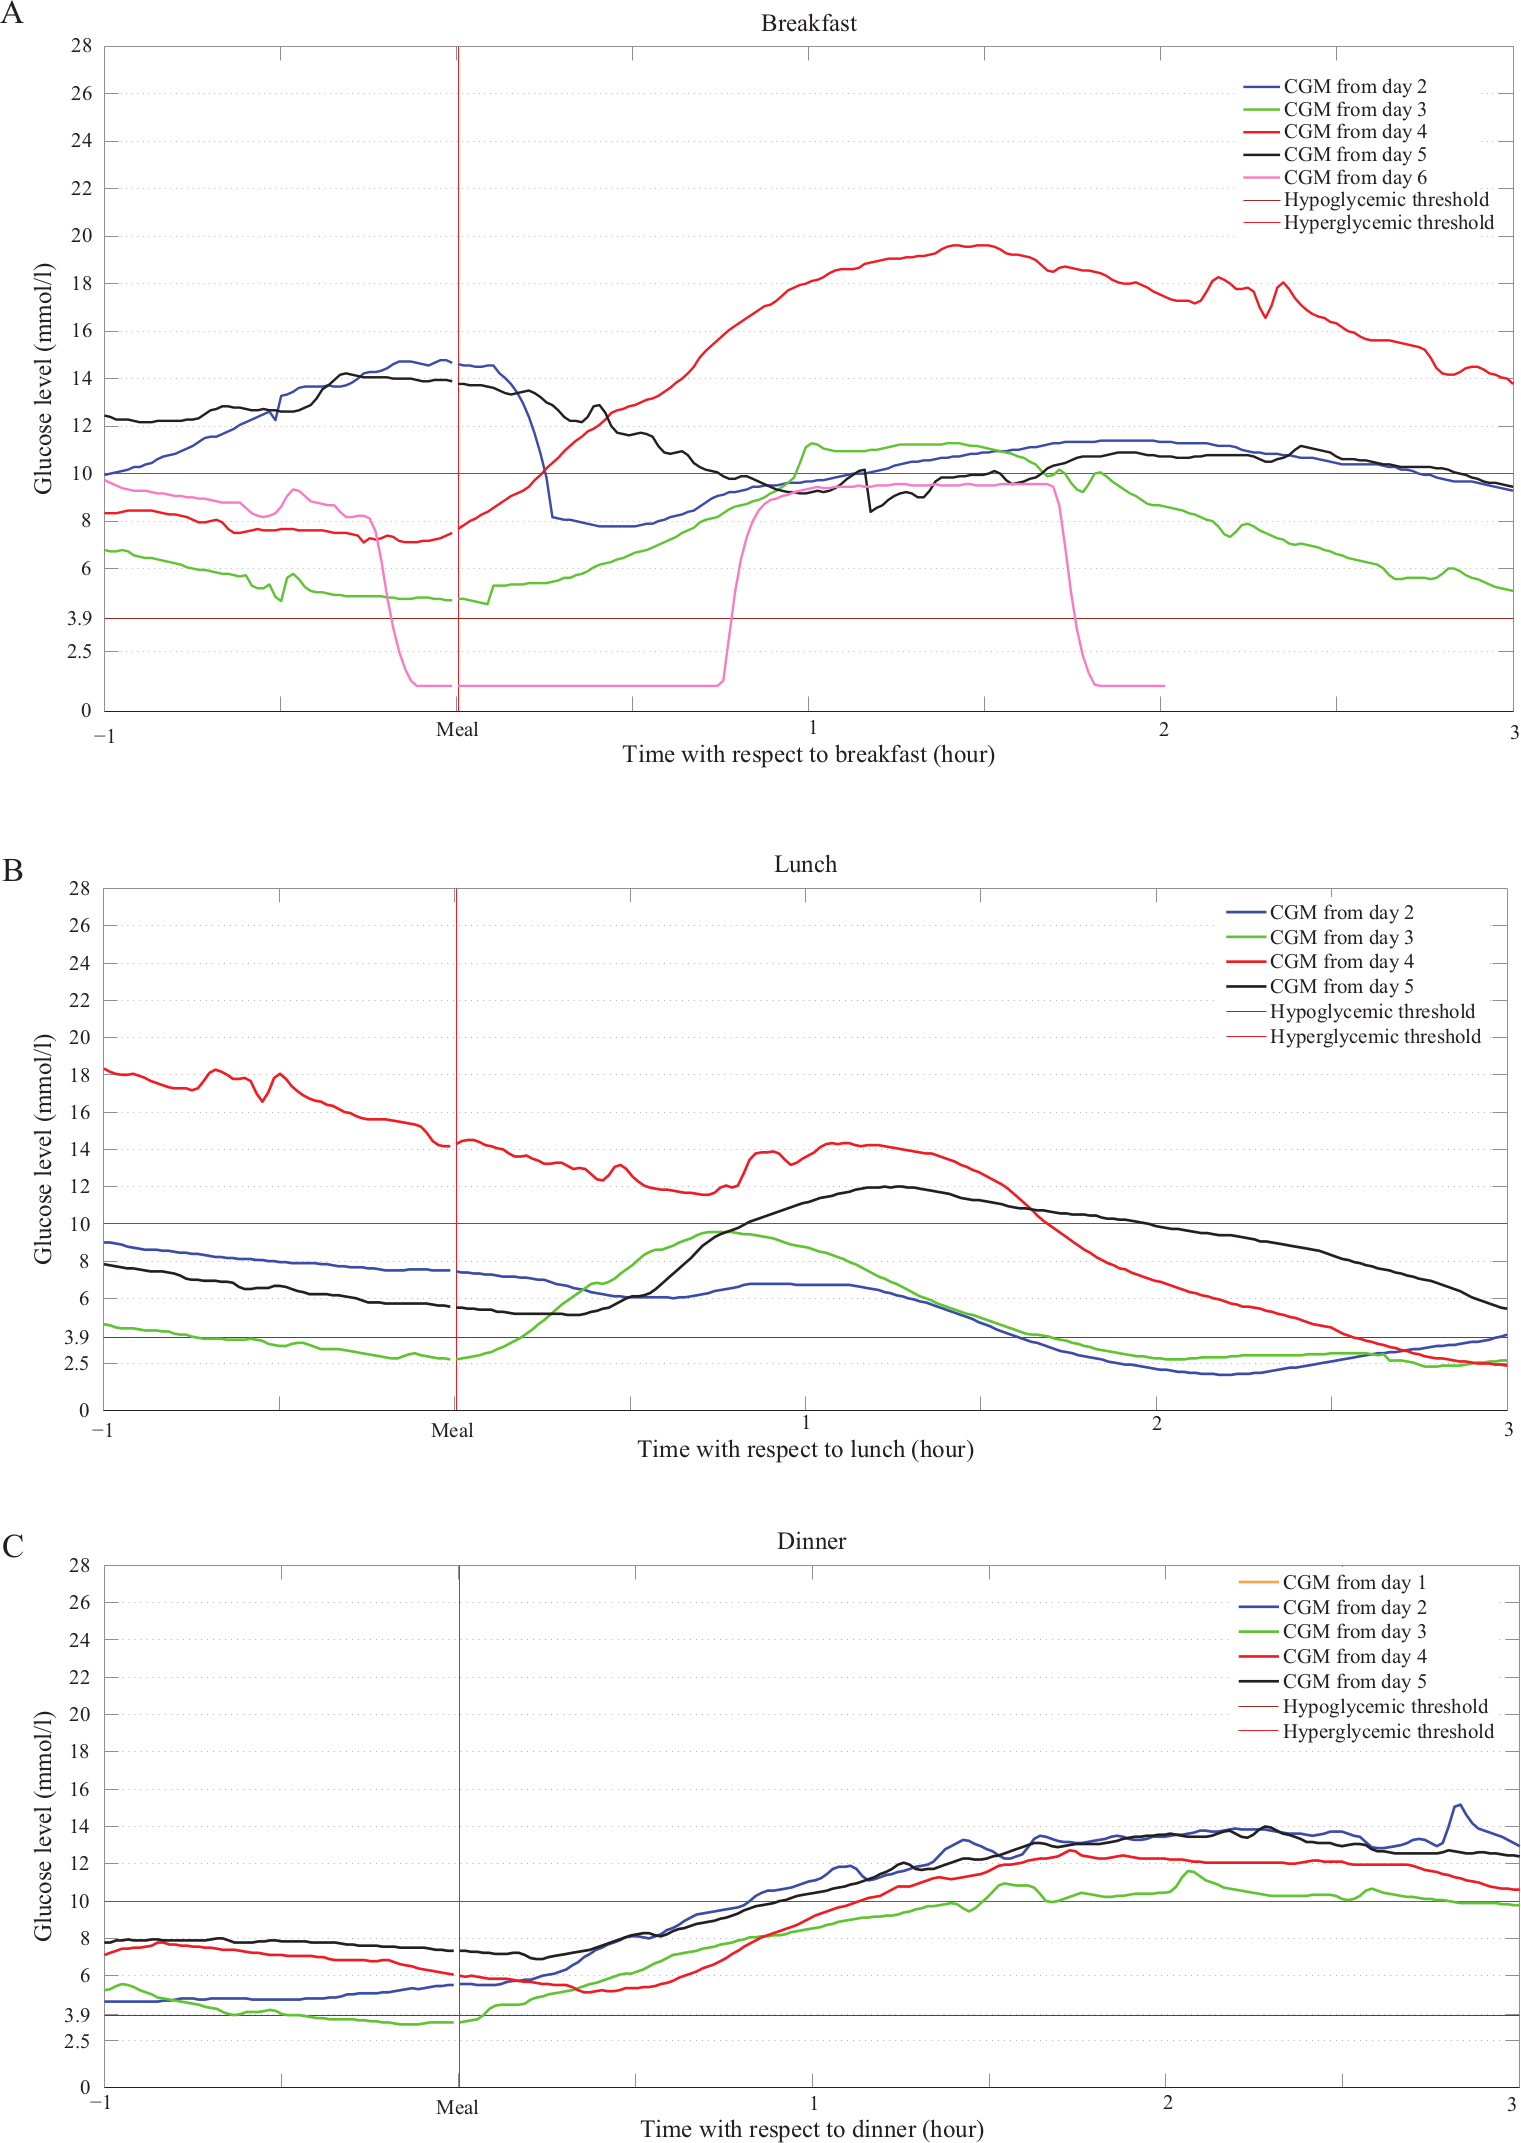
Meal overlay graph of CGM readings for the same patient as in Figure 2 for the 3 main meals: (A) breakfast, (B) lunch, (C) dinner.
Figure 3 indicates the daily overlay of CGM profiles in the 24 hours of the data recording days, from midnight to midnight. From this figure, the daily events and the patterns of glucose variations are detectable.
Figure 4 depicts the premeal and postmeal glycemic variations from 1 hour before each meal until 3 hours after each meal, for breakfast, lunch, and dinner. The timing of meals is identified by “Meal” in the horizontal axis. From this figure, the patterns of premeal and postmeal glycemic excursions are detectable.
In addition to the CGM graphs for each patient, the clinicians were provided with the patient’s demographic data, BG measurements information (timing and values), insulin regimen information (timing and dosage of insulin administrations), and meal information (timing and amount of carbohydrate), in tabulated format. An example of the mentioned information is given in the appendix.
Clinicians’ Role
In each occasion of CGM reviewing, the clinicians reviewed the CGM data processed by both CGM algorithms, without the knowledge of the type of algorithm applied to the data. Therefore, each clinician reviewed 24 graphs of CGM in each occasion. All 3 clinicians received the same CGM profiles, and the CGM profiles were exactly the same in the 2 CGM reviewing occasions. Clinicians reviewed the CGM graphs independently. At each occasion, the graphs were arranged in a randomized order both across the patients and across the algorithms. For the second occasion, the clinicians were expected not to have the knowledge of the previous assessment in the first occasion, or the other clinician’s assessment. The clinicians were not aware of the actual purpose of the study to minimize the bias on their decisions. The clinicians reviewed the CGM profiles retrospectively using blind CGM data, and their recommendations for adjusting of the insulin dosage were not applied on actual patients.
The corresponding investigator accompanied the clinicians in each occasion of the reviewing to help them if any questions arise regarding the reviewing process, before the reviewing starts.
Insulin Dosage Adjustment
For each CGM profile, a questionnaire was filled, which contained a set of questions about adjusting prandial and basal insulin dosage along with the suggested answers to choose from, as presented in Table 3. We limited the questions to a few key queries in the diabetes treatment modifications. This issue was addressed by considering the role of insulin as the main hypoglycemia-inducing agent with the potential of producing significant glycemic variations. Adjustment of the insulin dosage appears to be of great importance in clinical recommendations for the purpose of glycemic control. This fact is also reflected in literature where the most commonly reported treatment modifications are on insulin dosage, particularly adjusting the nighttime basal insulin.10,12,13,15
The Questions for Adjusting the Insulin Dose Level, Answered by the Clinicians.
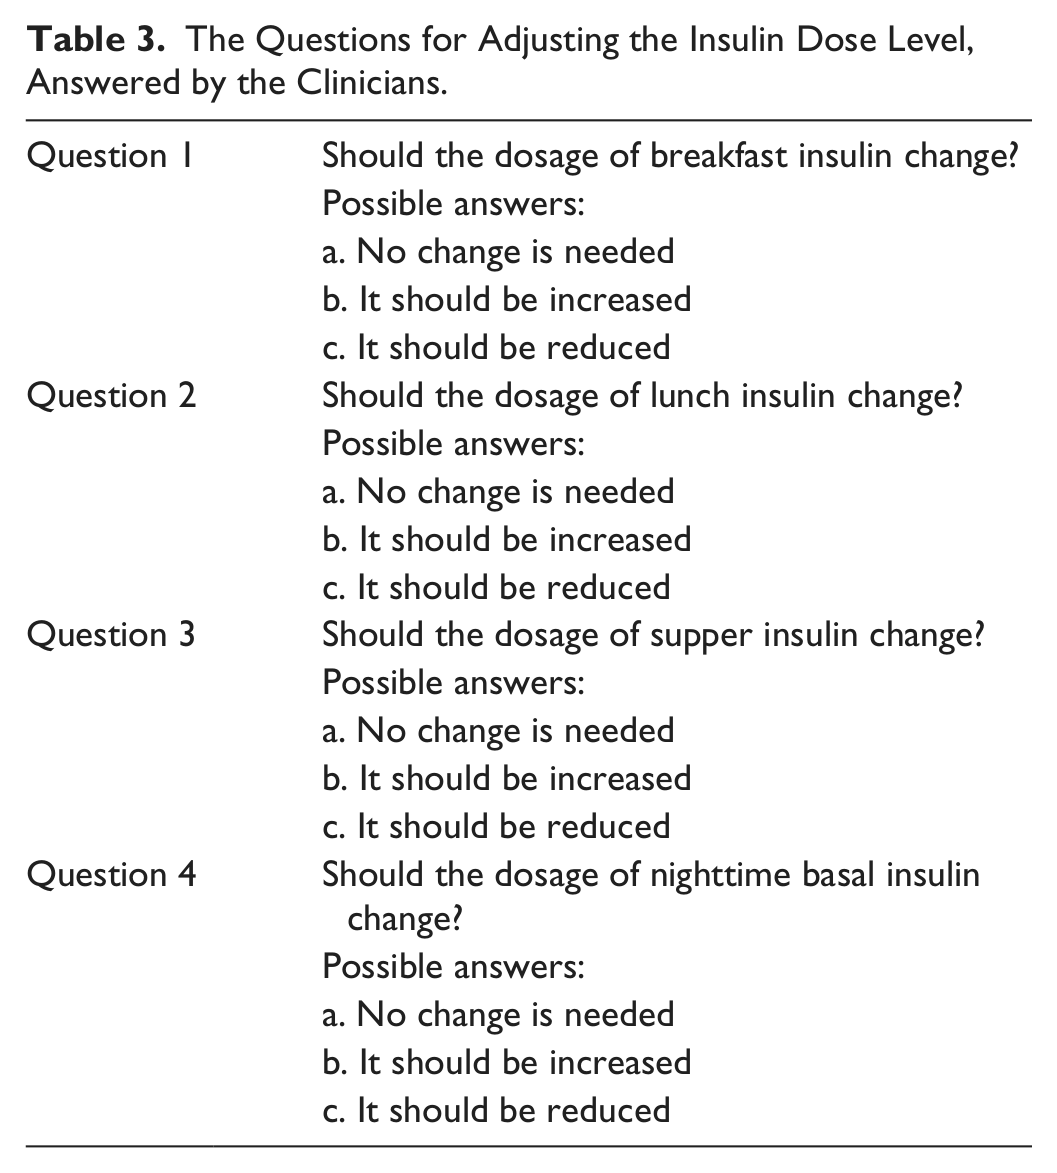
The clinicians made decision and gave recommendation to regulate the insulin dosage, by answering to the questions for each patient.
Statistical Analysis
Interclinician Agreement and Intraclinician Reproducibility of the Decisions
Precision of the decisions was divided into 2 terms: interclinician agreement that refers to the level of agreement among clinicians recommending treatment adjustment using the same data and intraclinician reproducibility of the decisions that refers to the level of agreement of a single clinician recommending treatment adjustment using the same data on several separate occasions. Cohen’s kappa coefficient45,46 was used to quantify the interclinician agreement and intraclinician reproducibility of the decisions: the larger the kappa, the higher is the agreement or reproducibility. For the interclinician agreement, the kappa coefficient was measured between the clinicians in each occasion, and for each question. For the intraclinician reproducibility, for each clinician, the kappa coefficient was calculated between the 2 occasions, and for each question. The kappa calculations were performed in MATLAB.
Comparison Between the 2 CGM Algorithms
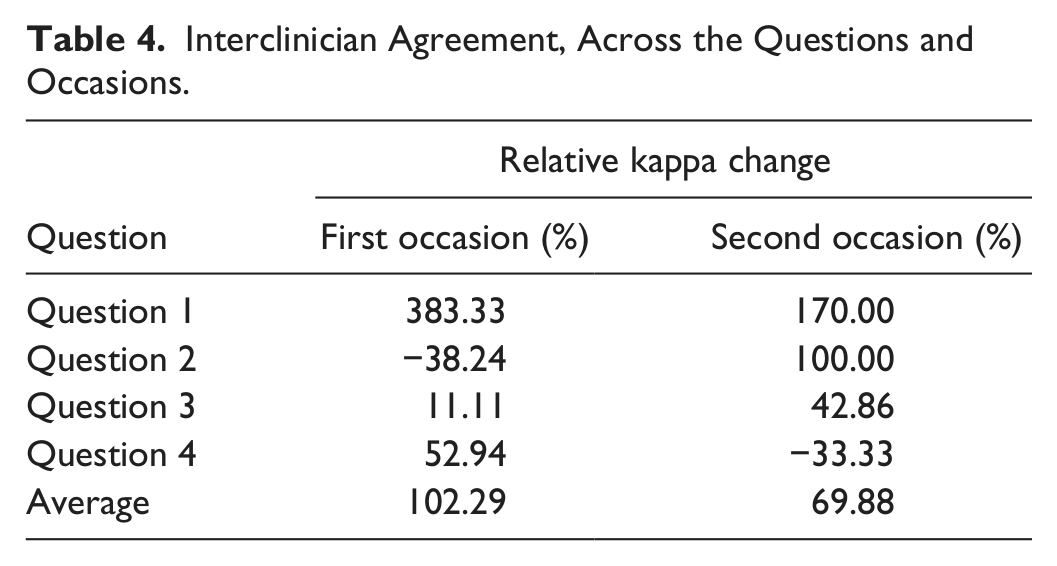
To compare the interclinician agreement and intraclinician reproducibility of the decisions for the 2 algorithms, we defined the variable “relative kappa change” as follows:
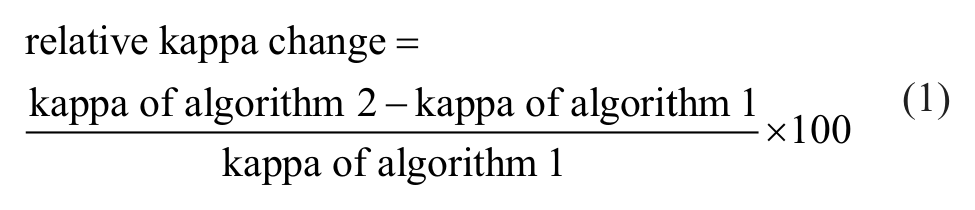
Two null hypotheses were defined and tested on the relative kappa change. The first null hypothesis is: the mean of the relative kappa change for the interclinician agreement on the decisions is not greater than zero, and the second null hypothesis is: the mean of the relative kappa change for the intraclinician reproducibility of the decisions is not greater than zero.
Results
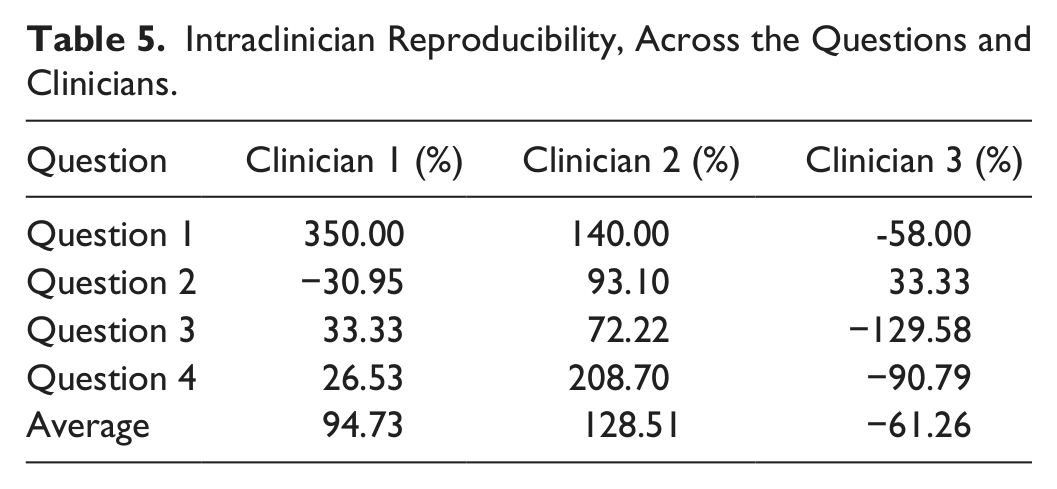
The relative kappa change for the interclinician agreement and the intraclinician reproducibility are given in Tables 4 and 5, respectively. IBM SPSS statistics package was used for this analysis. We used bootstrapping technique to estimate the mean of relative kappa change, because in the absence of large sample size, which is the case in our study, bootstrapping gives a more precise approximation of the mean kappa change and a more accurate estimation of 95% CI.
Interclinician Agreement, Across the Questions and Occasions.
Intraclinician Reproducibility, Across the Questions and Clinicians.
For the interclinician agreement, the mean of kappa, across the 2 occasions and across the 4 questions, for algorithm 1 is 0.24 with 95% CI [0.13, 0.40] and for algorithm 2 is 0.29 with 95% CI [0.20, 0.38]. For the interclinician agreement, the mean of the relative kappa change across the 2 occasions and the 4 questions is 86.08% (95% CI [9.88%, 192.44%]; sample size = 8 [4 questions × 2 occasions]; results are based on 1000 bootstrap samples).
For the intraclinician reproducibility, the mean of kappa, across the 3 clinicians and across the 4 questions, for algorithm 1 is 0.46 with 95% CI [0.30, 0.65] and for algorithm 2 is 0.42 with 95% CI [0.24, 0.59]. For the intraclinician reproducibility, the mean of the relative kappa change across all clinicians and the 4 questions is 53.99% (95% CI [16.53%, 117.45%]; sample size = 12 [4 questions × 3 clinicians]; results are based on 1000 bootstrap samples).
Discussion
We presented a method to indicate the potential transition of CGM numerical accuracy into precision of clinical decision making for type 1 diabetes treatment adjustment. Precision of the decisions was defined in terms of the interclinician agreement and intraclinician reproducibility of CGM-based decision making in modification of insulin dosage. Because the lower limit of the 95% CI is greater than zero, it can be concluded that algorithm 2 has increased the interclinician agreement and the intraclinician reproducibility. However, the wide 95% CI indicates that another study with inclusion of larger number of clinicians and more questions is required to increase the sample size and to have a more precise estimation of the mean kappa change. Nevertheless, due to the large dispersion between the clinicians’ kappa values of the reproducibility, any conclusion about the effect of algorithm 2 on increasing the intraclinician reproducibility of the decisions cannot be inferred.
The difference in the inter- and intraclinician agreement between the 2 algorithms may not be an exclusive indicative of the higher accuracy of algorithm 2 over algorithm 1. However in this study we tested whether the accuracy improvement of a CGM algorithm could have any downstream effect on clinical decision making.
The grand mean of kappa for the interclinician agreement across the occasions, questions, and algorithms is 0.27, which indicates a fair agreement. 45 However, this interpretation seems too lenient, because in fact, the kappa score as low as 0.27 may not be clinically acceptable. The grand mean of kappa for the intraclinician reproducibility across the clinicians, questions, and algorithms is 0.44 which denotes a moderate reproducibility of the decisions. 45 The reproducibility, although higher than the agreement, is not yet big enough to be clinically significant.
Although the limited number of subjects and clinicians in the present study is not sufficient to render generalization, the low interclinician agreement and low intraclinician reproducibility implies that clinicians may not have precision in making CGM-based decisions on adjusting of the insulin dosage. One of the reasons could be rooted in the fact that clinicians usually follow a subjective methodology—being established during years of experience—to interpret the information provided by CGM.47,48 Subjective CGM interpretation can further result in inconsistent and unrepeatable treatment advice between and within clinicians. The present results may suggest the necessity of founding new consensus guidelines for using CGM in diabetes treatment adjustment.
Little has been published on the impact of blinded retrospective CGM (professional CGM) and the present studies have not indicated significant correlation between the use of professional CGM and HbA1c reduction.49,50 Furthermore, Wong et al 51 demonstrated that only 15% of CGM users download CGM data at least weekly, for retrospective analysis. However, new studies seem promising and demonstrate the positive effect of professional CGM on diabetes management. 52 Chen et al 52 indicated that professional CGM was useful in identifying type 1 diabetes among subjects with insulin therapy. It is also worth noticing that improving the precision of retrospective clinical decision making resulted from enhanced CGM accuracy might be a predictor of more precise real-time decision making. Therefore, the presented methodology might be applicable to the real-time CGM, suggesting a topic for further investigations.
We studied the effect of accuracy on retrospective use of CGM. However, accuracy plays a more important role in real-time CGM. Polonsky and Hessler 53 demonstrated that CGM accuracy affects patients’ experience with real-time CGM. Accuracy modifies the degree of patients’ satisfaction and confidence in CGM, which is reflected in the better adherence to real-time CGM, more aggressive insulin therapy, reduced dependency on SMBG, less alarm fatigue, and improved quality of life.
One limitation of the study could be providing the clinicians with the HbA1c and BG information in addition to the CGM data. Although it is not clear to which extend the HbA1c and BG information weighted and affected the clinicians’ decisions, we speculate that the HbA1c and BG information might have confounded the effect of CGM accuracy on agreement and reproducibility, because the clinicians could use HbA1c and BG information to adjust the insulin dosage, in case the information in the CGM traces was not sufficient. However, this effect was minimized by 2 approaches. First, the clinicians were asked to focus on CGM data as much as possible and avoid making decisions based on only HbA1c and BG values. Second, the study is self-controlled and each patient is considered his own control; therefore, the effect of HbA1c and BG may have been removed by the subtraction used in the calculation of the relative kappa change.
The CGM profiles in this study were designed to include the minimum sufficient information and the basic scenario required to adjust the insulin dosage. However, in actual occasions of CGM-based decision making for diabetes treatment, clinicians usually have access to additional sources of information such as direct communication with patients, knowledge of the patients’ lifestyle, exercise background, and diet, which can affect adjustment of the insulin dosage.9-13,15,17
Although the questions used to adjust the insulin dosage (Table 3) were selected so that to include the important necessities of diabetes treatment adjustment, the question set can be optimized by addition of extra options including the opportunity of changing the insulin type, using CGM-augmented insulin pump instead of multiple daily insulin injection therapy, changing the activity level, adjusting the insulin-to-carbohydrate ratio, modifying the patients’ diet including changing the food portion and the glycemic index of the food that may influence gastric emptying and thus glycemic response.9-13,15,17
According to the exclusion criteria (Table 1), patients whose insulin and meal entries were missing for more than half of the recording days were excluded. This implies that there exist a few patients’ profiles that have insulin/ meal information in only half of the recording days. That level of data incompleteness may also be observed and dealt with in real occasions of CGM-based diabetes treatment adjustment.54,55
The standardized approach of ambulatory glucose profile (AGP) recommends using approximately 14 days of CGM data to make optimal clinical decision. 47 Although Bergenstal et al 47 also suggest that fewer days of CGM readings may provide enough basis for reasonable clinical decision making, one should bear in mind that the noisy parts of CGM signal can limit the number of interpretable days in the data. All in all, the quality improvement in diabetes management and the success in achieving glycemic goals are lifelong processes, and require dynamic decisions with adoptability to the varying scenarios of glycemic excursions. Therefore, the decisions, which are based on only 5 days of retrospective CGM data in the current study, are likely inadequate to fulfill glycemic control in the long term.
With respect to the present results, the relatively small improvement of the interclinician agreement and intraclinician reproducibility resulted from using a higher accuracy CGM algorithm may not be clinically significant. Although kappa is an appropriate measure of agreement, due to the limited number of clinicians and inconsistent results among clinicians, and also because all 3 clinicians were from the same hospital, the results are not generalizable. Performing a much larger study by inclusion of larger number of clinicians and patients from diverse clinical centers, with more days of data recordings per patient not only may provide stronger evidence to evaluate the clinical significance of the improvement in the decisions precision due to the CGM accuracy enhancement, but also makes it possible to evaluate the precision of the CGM-based diabetes treatment adjustments in broader categories including “less-experienced,” “experienced,” and “well-experienced” clinicians.
Conclusion
Results may be an indicative of the impact of CGM numerical accuracy on the precision of the decisions made to regulate the insulin dosage in type 1 diabetes patients. However, due to the insufficient number of clinicians and patients, no conclusion can be made on the superiority of the CGM algorithm 1 over the CGM algorithm 2 in improving the CGM-based insulin adjustments in type 1 diabetes.
Footnotes
Appendix
Acknowledgements
The authors wish to express their appreciation to Rasmus Waagepetersen, Department of Mathematical Sciences, Aalborg University, Denmark, for giving valuable statistical advice during data analysis.
Abbreviations
ARD, absolute relative difference; BG, blood glucose; CGM, continuous glucose monitoring; CT, computed tomography; HbA1c, glycosylated hemoglobin; LIS, insulin lispro; MARD, median absolute relative difference; NPH, neutral protamine hagedorn; RHI, regular human insulin.
Declaration of Conflicting Interests
The author(s) declared no potential conflicts of interest with respect to the research, authorship, and/or publication of this article.
Funding
The author(s) disclosed receipt of the following financial support for the research, authorship, and/or publication of this article: The CGM data collection was supported by Roche Diagnostics.