
Abstract
Background:
The standard ISO (International Organization for Standardization) 15197 is widely accepted for the accuracy evaluation of systems for self-monitoring of blood glucose (SMBG). Accuracy evaluation was performed for 4 SMBG systems (Accu-Chek® Aviva, Contour®XT, GlucoCheck XL, GlucoMen® LX PLUS) with 3 test strip lots each. To investigate a possible impact of the comparison method on system accuracy data, 2 different established methods were used.
Methods:
The evaluation was performed in a standardized manner following test procedures described in ISO 15197:2003 (section 7.3). System accuracy was assessed by applying ISO 15197:2003 and in addition ISO 15197:2013 criteria (section 6.3.3). For each system, comparison measurements were performed with a glucose oxidase (YSI 2300 STAT Plus™ glucose analyzer) and a hexokinase (cobas® c111) method.
Results:
All 4 systems fulfilled the accuracy requirements of ISO 15197:2003 with the tested lots. More stringent accuracy criteria of ISO 15197:2013 were fulfilled by 3 systems (Accu-Chek Aviva, ContourXT, GlucoMen LX PLUS) when compared to the manufacturer’s comparison method and by 2 systems (Accu-Chek Aviva, ContourXT) when compared to the alternative comparison method. All systems showed lot-to-lot variability to a certain degree; 2 systems (Accu-Chek Aviva, ContourXT), however, showed only minimal differences in relative bias between the 3 evaluated lots.
Conclusions:
In this study, all 4 systems complied with the evaluated test strip lots with accuracy criteria of ISO 15197:2003. Applying ISO 15197:2013 accuracy limits, differences in the accuracy of the tested systems were observed, also demonstrating that the applied comparison method/system and the lot-to-lot variability can have a decisive influence on accuracy data obtained for a SMBG system.
Keywords
The accuracy of blood glucose (BG) measurement results obtained with systems for self-monitoring of blood glucose (SMBG) by people with diabetes is crucial for adequate therapeutic decisions. Requirements for SMBG systems, for example, acceptable system accuracy, are established in the International Organization for Standardization (ISO) standard 15197. Manufacturers often provide evidence of conformity with this standard to obtain the Conformité Européenne (CE) mark for their system; in the European Union this mark, is a minimum requirement for being marketed. According to ISO 15197:2003 1 accuracy criteria, at least 95% of results measured with an SMBG system shall fall within ±15 mg/dl of comparison measurement values at BG concentrations <75 mg/dl and within ±20% at BG concentrations ≥75 mg/dl. Compliance with accuracy criteria need only be shown for 1 test strip lot. For comparison measurements, the manufacturer’s selected measurement procedure, usually a glucose oxidase (GOD) or hexokinase (HK) method will be used. 1
In the past decade, SMBG system technology has improved and experts from science and medicine have urged the establishment of more stringent accuracy requirements. Last year, the revision ISO 15197:2013 2 was published in which several requirements were modified including more stringent accuracy criteria with at least 95% of results within ±15 mg/dl of the comparison measurement result at BG concentrations <100 mg/dl and within ±15% at BG concentrations ≥100 mg/dl and at least 99% of results within zones A and B of the consensus error grid (CEG). The test procedure also has some important changes, for example, the number of test strip lots and the comparison method. Regarding the number of required test strip lots, compliance with system accuracy criteria must be shown for 3 different lots. For comparison measurements, any method that conforms to established traceability requirements 3 may be used, not only the manufacturer’s selected measurement procedure. 2 Metrological traceability means that a measurement result can be related to a higher order standard through a documented unbroken chain of calibrations. However, insufficient information is available regarding the comparability of accuracy data obtained with different comparison methods/systems.
In this study, accuracy of 4 SMBG systems was assessed with 3 test strip lots each following test procedures and acceptance criteria of ISO 15197:2003 (section 7.3). In addition, accuracy criteria of ISO 15197:2013 (section 6.3.3) were applied for which compliance is required only after a 36-month transition period. To investigate a possible influence of the comparison method on system accuracy data, 2 established comparison methods were used.
Methods
The study (trial registry number [ClinicalTrials.gov] NCT01789021) was performed from March to April 2013 at the Institut für Diabetes-Technologie Forschungs- und Entwicklungsgesellschaft mbH an der Universität Ulm (IDT), Germany, in compliance with the German Medical Devices Act. The study protocol was approved by the Ethics Committee and the Federal Institute for Drugs and Medical Devices. All participants signed informed consent prior to the study commencing.
Study Population
A number of 114 subjects (≥18 years) with diabetes mellitus type 1, type 2, or without diabetes were included in the study to obtain 100 evaluable data sets for each system (see also the section on data exclusion). The study physician reviewed the subjects’ medical history, inclusion and exclusion criteria for study participation (eg, pregnancy or lactation period, severe acute disease, and/or chronic disease) and medication, and checked for interfering substances given in the manufacturers’ labeling.
SMBG Systems
Four SMBG systems with a CE mark were evaluated with 3 different test strip lots each: Accu-Chek® Aviva (system 1), Roche Diagnostics GmbH, Mannheim, Germany; Contour®XT (system 2), Bayer Consumer Care AG, Basel, Switzerland; GlucoCheck XL (system 3), aktivmed GmbH, Augsburg, Germany; and GlucoMen® LX PLUS (system 4), A. Menarini Diagnostics S.r.l., Firenze, Italy (Table 1). Meters and test strips were purchased by the IDT from a local pharmacy. All meters displayed plasma equivalent glucose concentrations in mg/dl. The systems were stored, used, and maintained following the manufacturers’ labeling. Control measurements according to the manufacturers’ instructions were performed daily prior to the test procedure to ensure the proper function of each system. One meter of System 4 had to be replaced after 78 valid measurements because of an equipment failure.
Evaluated SMBG systems.
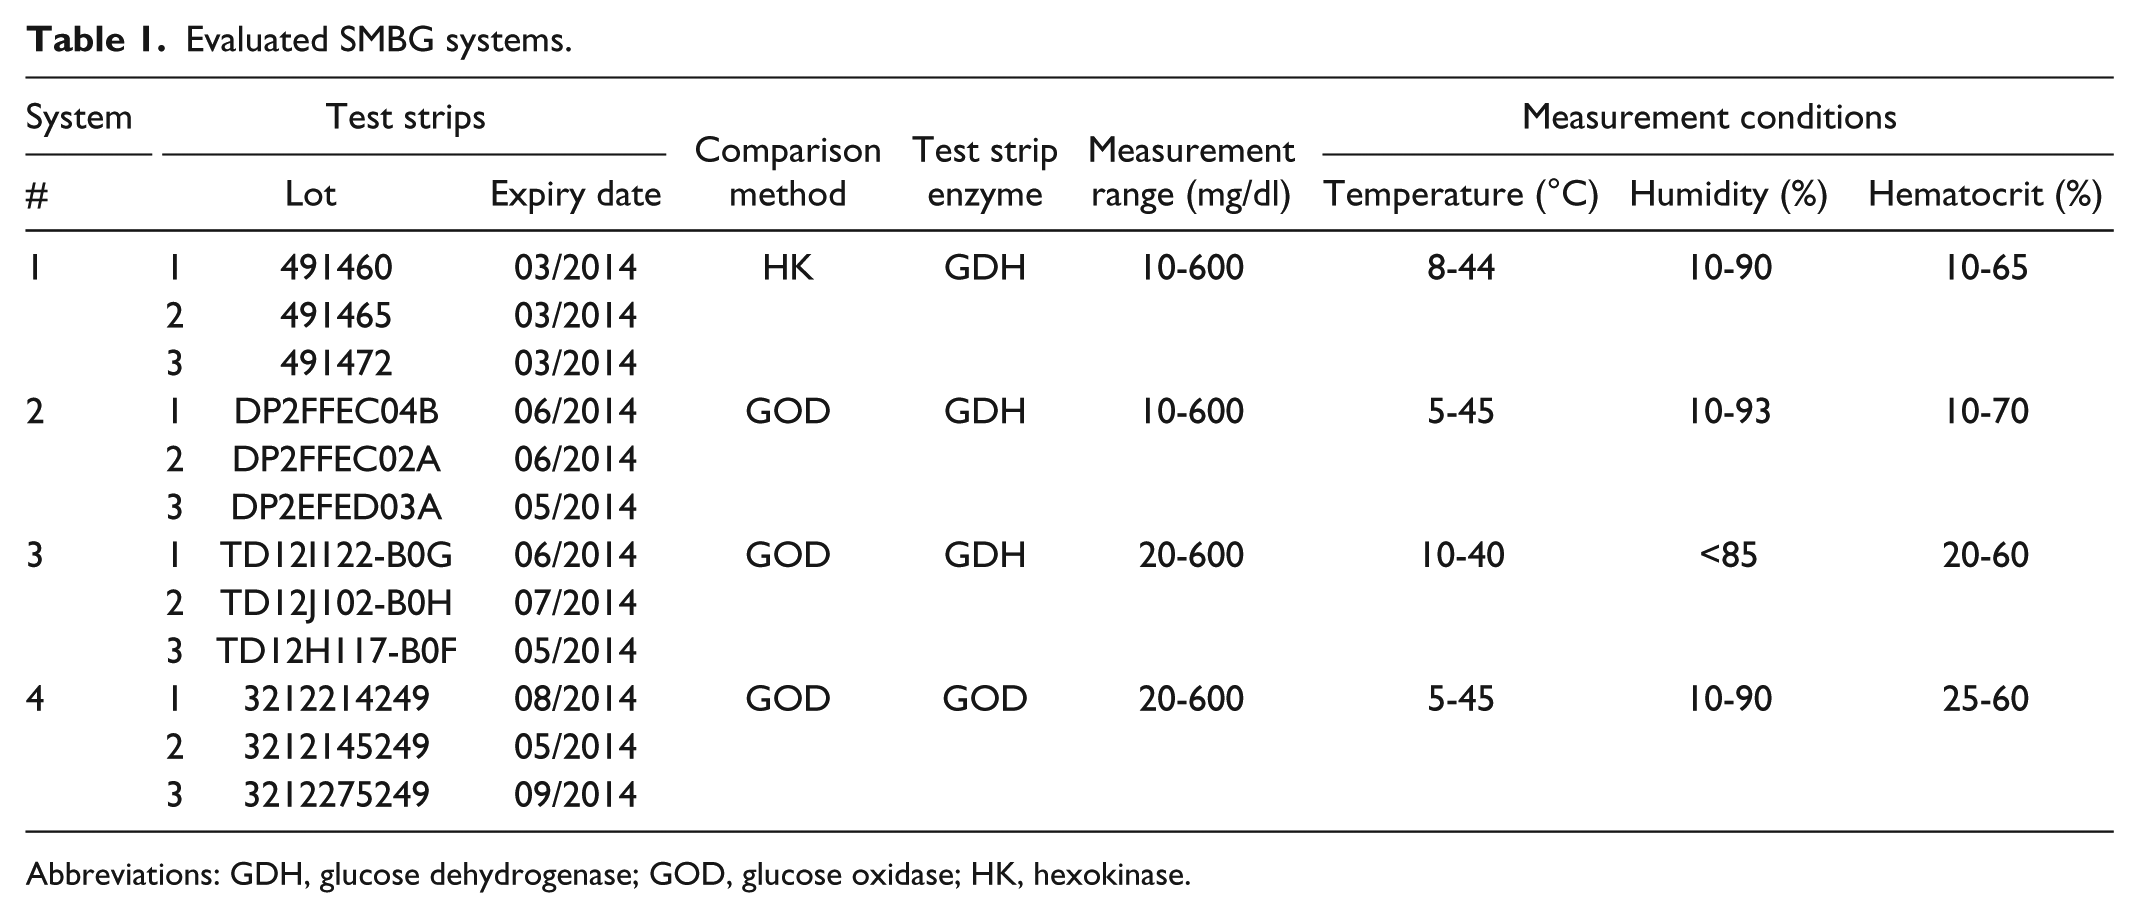
Abbreviations: GDH, glucose dehydrogenase; GOD, glucose oxidase; HK, hexokinase.
Comparison Measurements
Comparison measurements were performed with 2 different methods/systems, a GOD method/YSI 2300 STAT Plus™ glucose analyzer (YSI Inc, Yellow Springs, OH, USA) and a HK method/cobas® c111 analyzer (Roche Instrument Center, Rotkreuz, Switzerland). Both methods provided BG values in mg/dl. According to information provided by the manufacturers, the YSI 2300 STAT Plus™ glucose and the cobas c111 analyzers conform to traceability requirements of ISO 17511. 3 To verify trueness and precision of the 2 analyzers, regular internal and external quality control measures were performed as required by the German national standard (RiliBÄK). 4 In addition, daily quality control measurements were performed following IDT internal standard operating procedures. For the GOD method, mean biases of <±0.8% with coefficients of variation (CVs) <1.3% were found using aqueous control solutions that are traceable to NIST SRM 917c (YSI Bioanalytical Standards; YSI Life Sciences, Yellow Springs, OH). The HK method showed mean biases <2.2% with CVs <0.9% using serum-based controls traceable to the isotope dilution mass spectrometry method (Precinorm U/Precipath U; Roche Diagnostics GmbH, Mannheim, Germany). In addition, serum control samples were measured as part of a German external quality assessment. The GOD method showed a mean bias of -5.5%, whereas the HK method showed a mean bias of −0.7%. The manufacturer’s selected comparison measurement method and/or the method used by the manufacturer for accuracy evaluation as indicated in their system’s labeling is shown in Table 1.
Samples
For each system, at least 100 capillary samples from different subjects and with a defined distribution into different glucose concentration categories (slightly modified limits of these categories were used, because the limits are not clearly defined and differ between the English and the German version of ISO 15197:2003) were analyzed. Samples were assigned to the respective concentration category according to the mean glucose concentration measured with the comparison method. For glucose values ≥50 mg/dl to <400 mg/dl, only unaltered blood samples were used. For glucose concentrations <80 mg/dl and >300 mg/dl, BG values could be provoked by fasting or intake of a high-carbohydrate meal and/or by adjusting the injection–meal interval. The study physician monitored the provocation closely. To obtain higher (≥400 mg/dl) or lower (<50 mg/dl) glucose concentrations, samples could be adjusted. For this purpose, samples were collected in lithium heparin tubes and adjustment of the samples was performed by either incubation, to allow for glycolysis, or by supplementation of glucose (40% glucose in 0.9% NaCl). To ensure an oxygen partial pressure (pO2) in adjusted samples comparable to the pO2 in capillary blood, 5 the pO2 was determined (OPTI CCA-TS, OPTI Medical Systems, Inc, Roswell, GA, USA) immediately after the measurement procedure. The hematocrit value of each sample was checked to be within the range indicated in the manufacturer’s labeling (Table 1) by collecting capillary whole blood in heparinized capillaries, centrifuging, and determining the hematocrit values using an alignment chart.
Test Procedure
The measurements took place over a period of 21 days in a laboratory setting with controlled temperature (20 to 24°C) and humidity (31% to 47%) following procedures described in detail in ISO 15197:2003 (section 7.3), which differs in some points from the ISO 15197:2013 protocol. Measurements were performed by study personnel, trained to the limitations of the SMGB systems, the manufacturers’ labeling, safety practices, and the test protocol.
Before the measurement procedure, subjects were asked to wash and dry their hands. Then, samples were collected from fingertips by skin puncture. Each sample was measured in duplicate with each test strip lot of a system. Duplicate measurements were performed with 2 meters using test strips from the same vial. Vials were changed after approximately 10 subjects to ensure that test strips were taken from at least 10 different vials.
For unaltered samples, the measurement procedure was as follows: (1) Aliquots were collected for measurements with the comparison methods (first aliquot); (2) measurements were performed with the 4 systems (test strip lot 1); (3) aliquots were collected for measurements with the comparison methods (second aliquot). This procedure was repeated for test strip lots 2 and 3. Measurements with the SMBG systems were performed directly from the fingertip. A fresh drop of blood was generated before measurements with each system and before each aliquot collection for comparison measurements. Aliquots for measurements with the comparison methods were collected in lithium heparin tubes and centrifuged; the measurements were performed on separated plasma. The difference between the first (aliquot collected before the measurements with the SMBG systems) and second comparison measurement result (aliquot collected after the measurements with the SMBG systems) was checked to be ≤4 mg/dl at BG concentrations ≤100 mg/dl and ≤4% at BG concentrations >100 mg/dl to verify sample stability.
Adjusted samples were applied to the test strips from a sample drop placed on Parafilm® (American National Can Company, Chicago, IL, USA). The measurement procedure was as follows: (1) aliquots were removed for measurements with the comparison methods (first aliquot); (2) measurements were performed with the 4 systems (3 lots per system); (3) aliquots were removed for measurements with the comparison methods (second aliquot). The aliquots were processed as described above.
Data Exclusion
Samples were excluded from analysis for the following reasons: hemolysis or lipemia in plasma samples for comparison measurements; equipment failures; the pO2 of adjusted samples was not determined; the change between first and second comparison measurement result exceeded the acceptance criteria for sample stability (as defined above); the quality control measurement result with the comparison method was outside the acceptable limits; the concentration category was different between lots and/or comparison methods; the data set for a subject was incomplete; the required number of samples in a BG concentration category was already reached.
Data Analysis
For each system 600 data (for each lot 200 data obtained from 100 capillary samples) were analyzed.
System Accuracy
System accuracy was evaluated for each individual lot of a system by comparison with both comparison methods, GOD and HK. For this purpose, the glucose concentration measured with the SMBG system was compared with the respective mean value of the comparison measurement (obtained from aliquots collected before and after the measurement with the system).
According to ISO 15197:2003, the manufacturer’s comparison method shall be used for determination of system accuracy acceptability. To assess system accuracy following ISO 15197:2003, the relative number of results within ±15 mg/dl of the mean comparison measurement result for BG concentrations <75 mg/dl, and within ±20% for BG concentrations ≥75 mg/dl was calculated. Acceptability was assessed for each individual test strip lot by adding the number of results within ±15 mg/dl (BG concentrations <75 mg/dl) to the number of results within ±20% (BG concentrations ≥75 mg/dl).
According to ISO 15197:2013, any comparison measurement procedure for which the manufacturer confirms traceability following requirements of ISO 175113 can be used for determination of system accuracy.
For accuracy evaluation applying ISO 15197:2013 criteria (section 6.3.3), the relative number of results within ±15 mg/dl for BG concentrations <100 mg/dl and within ±15% for BG concentrations ≥100 mg/dl was calculated. The acceptability was determined for each individual test strip lot by adding the number of results within ±15 mg/dl (BG concentrations <100 mg/dl) to the number of results within ±15% (BG concentrations ≥100 mg/dl). For consensus error grid analysis as required by ISO 15197:2013, the number and percentage of results within zones A and B was calculated and the acceptability of a system was determined by combining the results of the 3 lots.
The system accuracy results of each system are presented following ISO 15197:2003/ISO 15197:2013 in a table and as difference plots in which the differences between each individual system measurement result and the respective mean comparison result are shown.
Bias Analysis According to Bland and Altman
The relative bias (%) of the measurement results according to Bland and Altman 6 was calculated for each lot of a system by using the formula
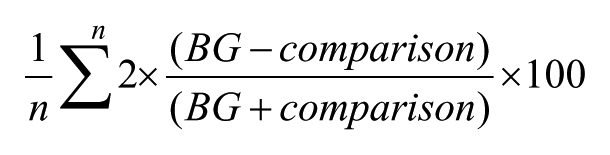
in which n is the number of all BG measurement results, BG is an individual SMBG system measurement result, and comparison is the mean result of the comparison measurements (obtained from aliquots collected before and after the measurements with the SMBG system). The relative bias is shown with 95% limits of agreement (≈ ±1.96 × standard deviation).
Regression Analysis According to Passing and Bablok
For each individual lot of a system, regression analyses according to Passing and Bablok 7 were performed. The regression equation (y = ax + b) reveals proportional (regression line’s slope a) and constant (regression line’s intercept b) measurement differences between an SMBG system and the comparison method.
Results
The 4 systems fulfilled accuracy requirements of ISO 15197:2003 (section 7.3) with all 3 tested lots when compared to the respective manufacturer’s comparison method (GOD method: systems 2, 3 and 4; HK method: system 1). The systems showed 95.5% to 100% of results within the acceptable limits (±15 mg/dl or ±20%) (Table 2, Figure 1).
System Accuracy Results Applying Performance Criteria of ISO 15197:2003.
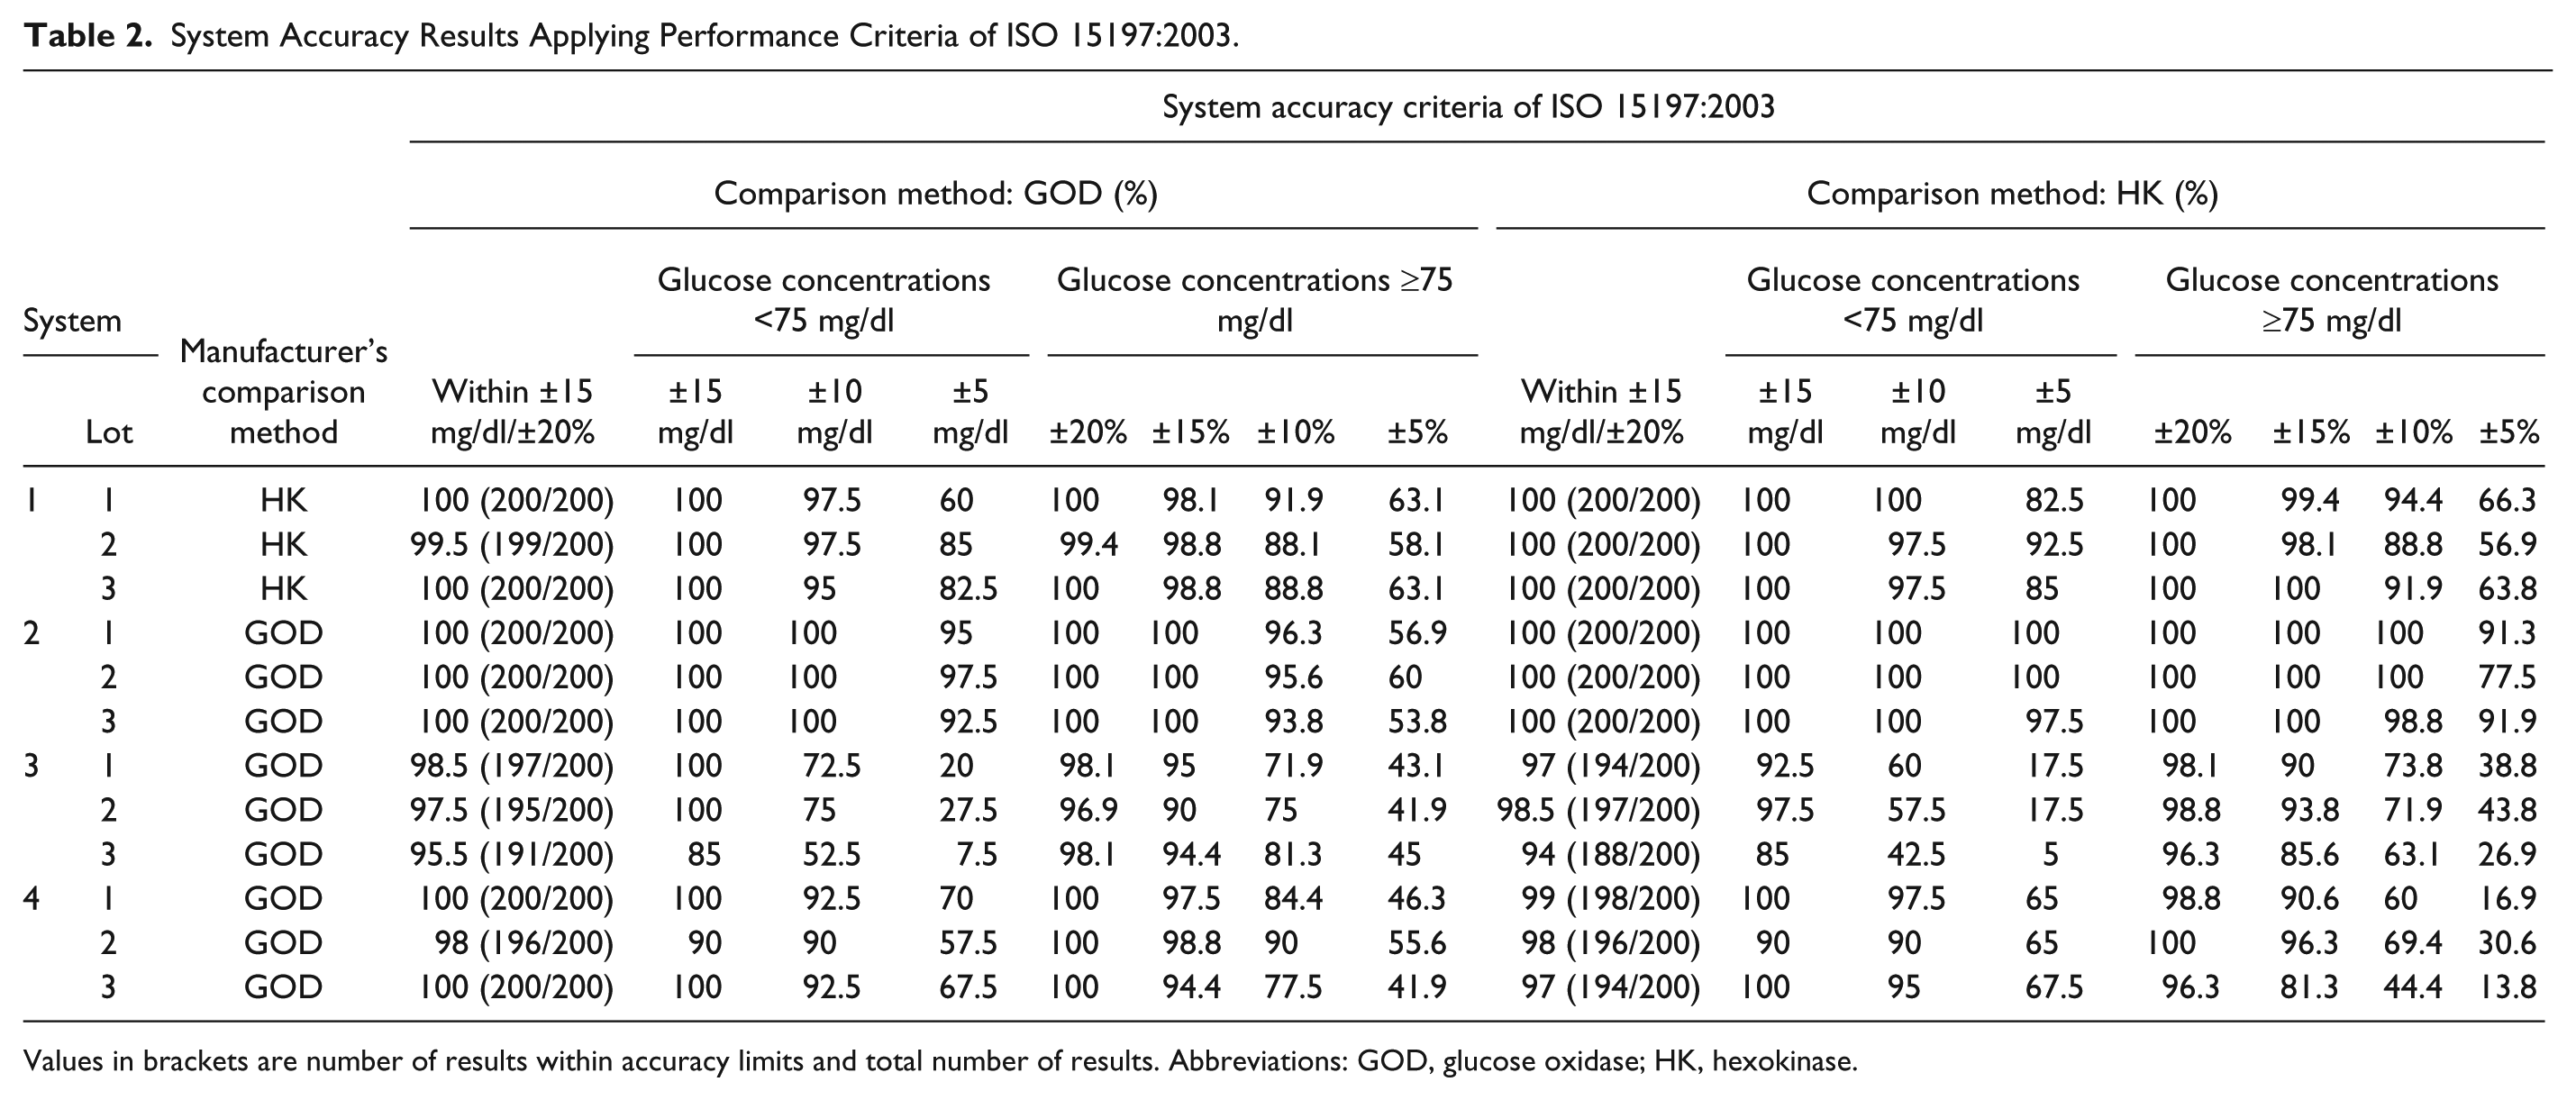
Values in brackets are number of results within accuracy limits and total number of results. Abbreviations: GOD, glucose oxidase; HK, hexokinase.
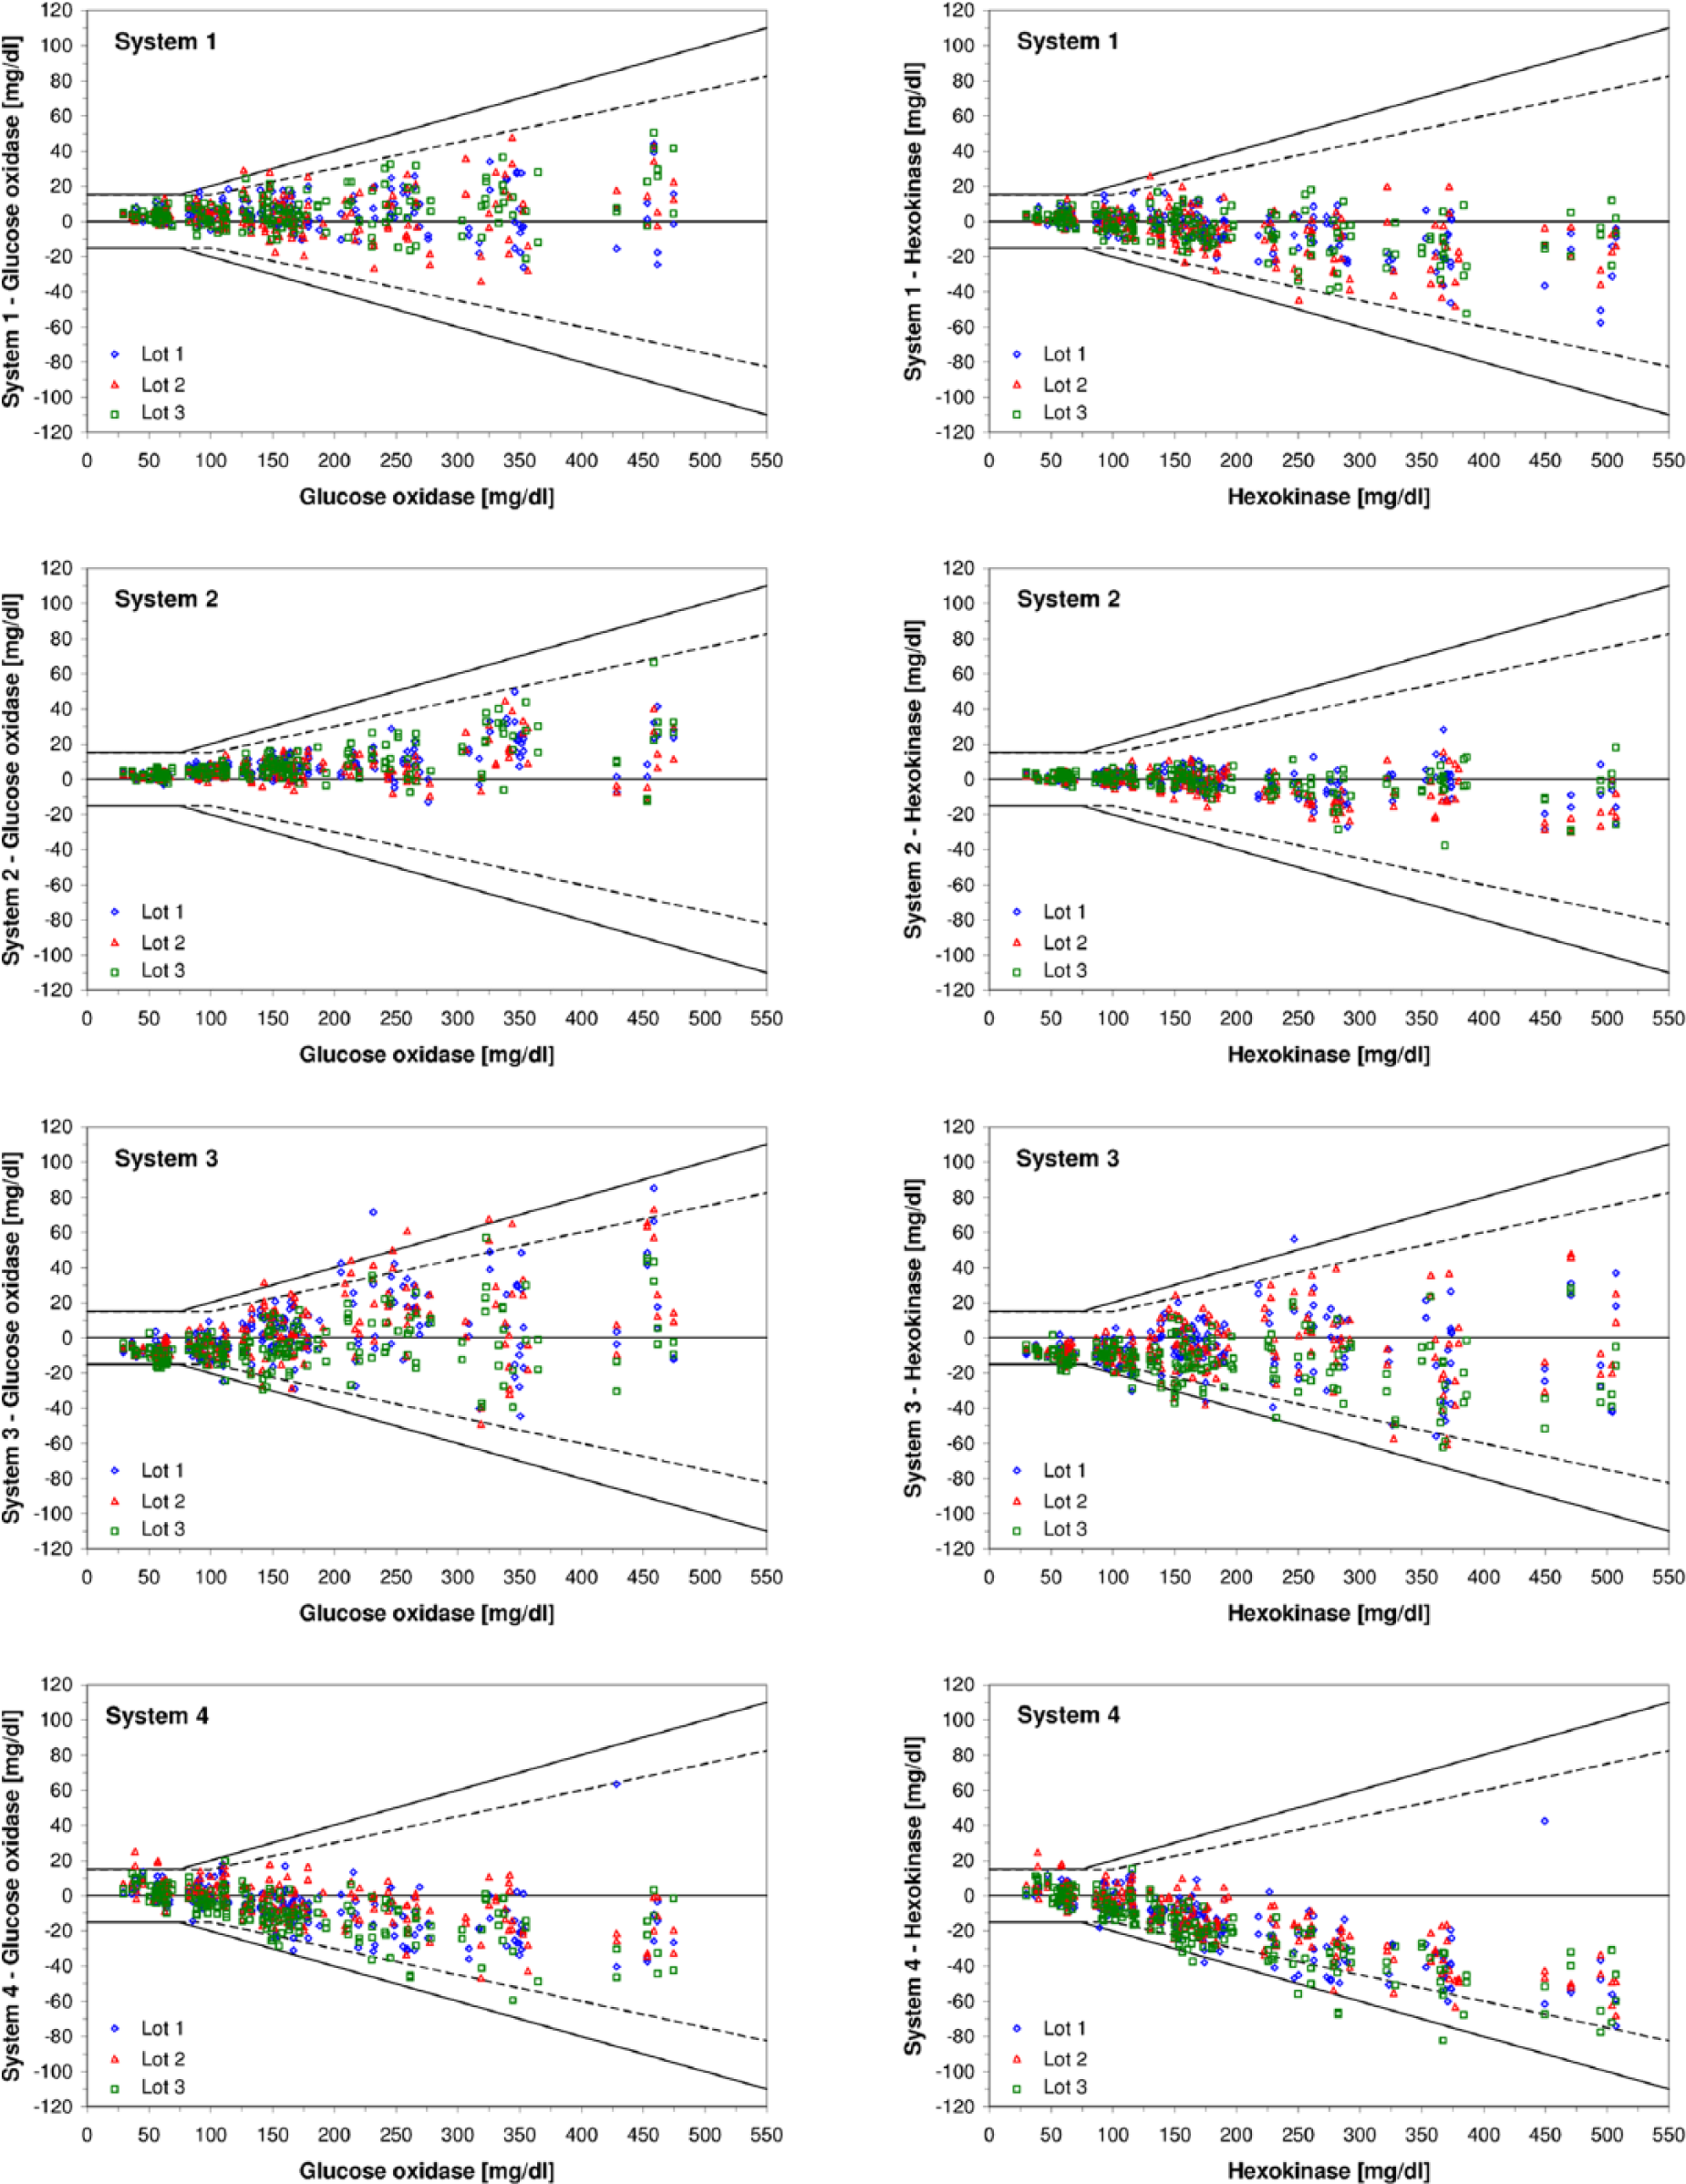
Difference plots of 4 SMBG systems with 3 test strip lots each. Left-hand side: the glucose oxidase method was used for comparison measurements. Right-hand side: the hexokinase method was used for comparison measurements. Black lines: Criteria for system accuracy following ISO 15197:2003. Dashed lines: Criteria for system accuracy following ISO 15197:2013. For lot 3 of System C, 1 data point is not shown because the difference exceeds the y-axis scale (comparison measurement result: 155.5 mg/dl (glucose oxidase) and 164.6 mg/dl (hexokinase), system measurement result: 314 mg/dl).
Accuracy criteria of ISO 15197:2013 (section 6.3.3) were fulfilled by 3 systems (1, 2, and 4) when compared to the manufacturer’s comparison method and by 2 systems (1 and 2) when compared to the alternative comparison method. Regarding all 4 systems, 92% to 100% of results were within the limits (±15 mg/dl or ±15%) when the respective manufacturer’s comparison method was applied and 85.5% to 100% of results when the alternative comparison method was applied (Table 3, Figure 1). All 4 systems showed at least 99.8% of results in consensus error grid zones A and B (Table 3). Accuracy of the systems was also analyzed by calculating mean absolute relative deviations, which is presented in a current publication. 8
System Accuracy Results Applying Performance Criteria of ISO 15197:2013.
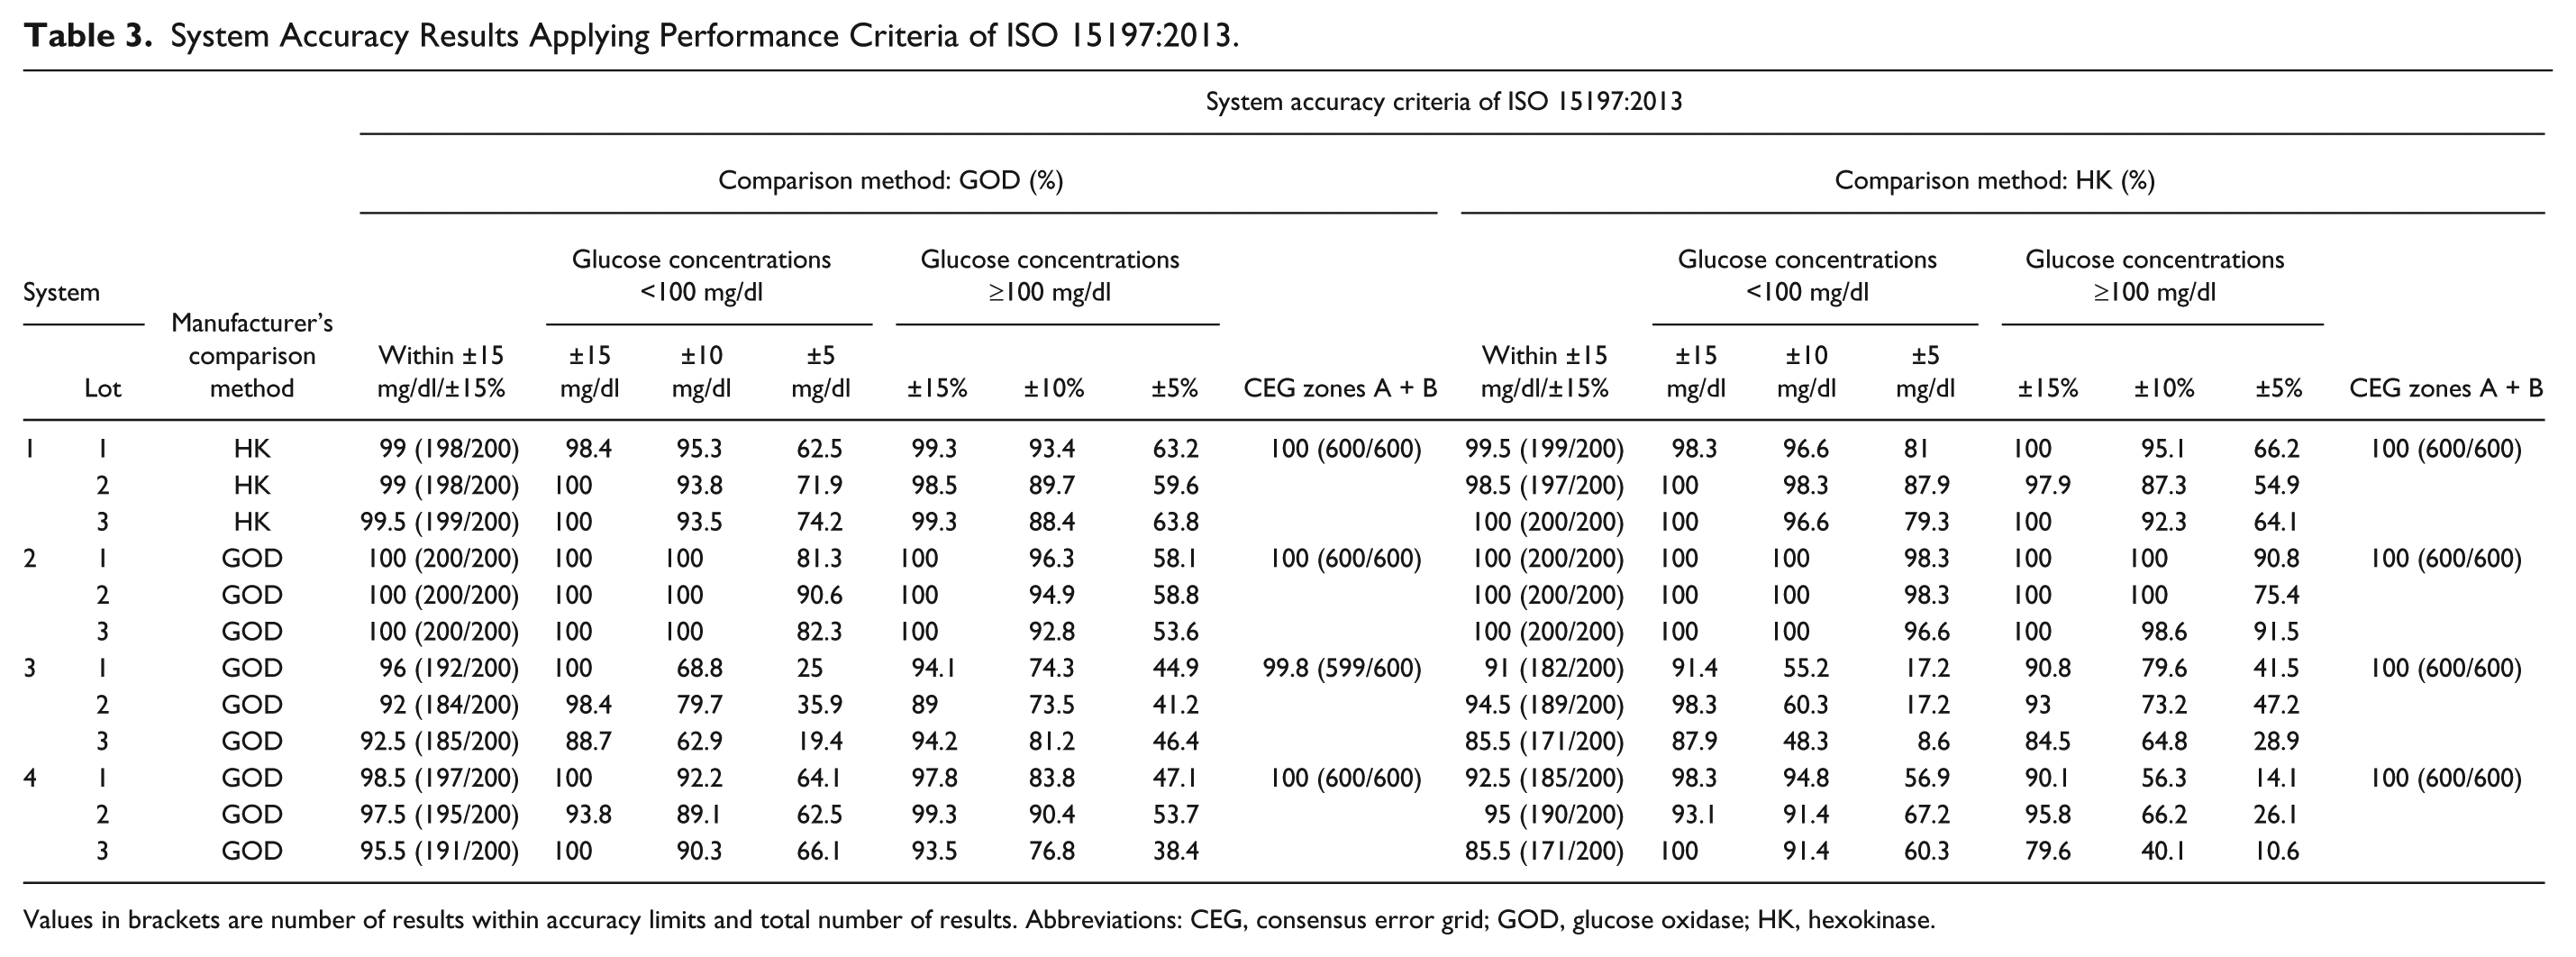
Values in brackets are number of results within accuracy limits and total number of results. Abbreviations: CEG, consensus error grid; GOD, glucose oxidase; HK, hexokinase.
The results of the bias analysis and regression analysis are shown in Table 4. Regarding the results obtained by using the manufacturers’ comparison method, the relative bias of individual lots ranged from −6.2% (system 3) to +4.7% (system 2). The maximum difference in relative bias between any of the 3 lots of a system was 0.8% (system 2), 1% (system 1), 4% (system 4), and 4.1% (system 3) (Table 4, Figure 2). Regression analyses according to Passing and Bablok showed that the average constant measurement differences (ie, intercepts) between the systems and the manufacturer’s comparison method ranged from −14.45 mg/dl to +6.32 mg/dl and the average proportional measurement differences ranged from −9% to +11% (ie, slopes of 0.91 to 1.11) (Table 4).
Relative Bias According to Bland and Altman With a 95% Limit of Agreement Between the SMBG Systems’ Measurement Results and the Comparison Measurement Results and Linear Regression According to Passing and Bablok.
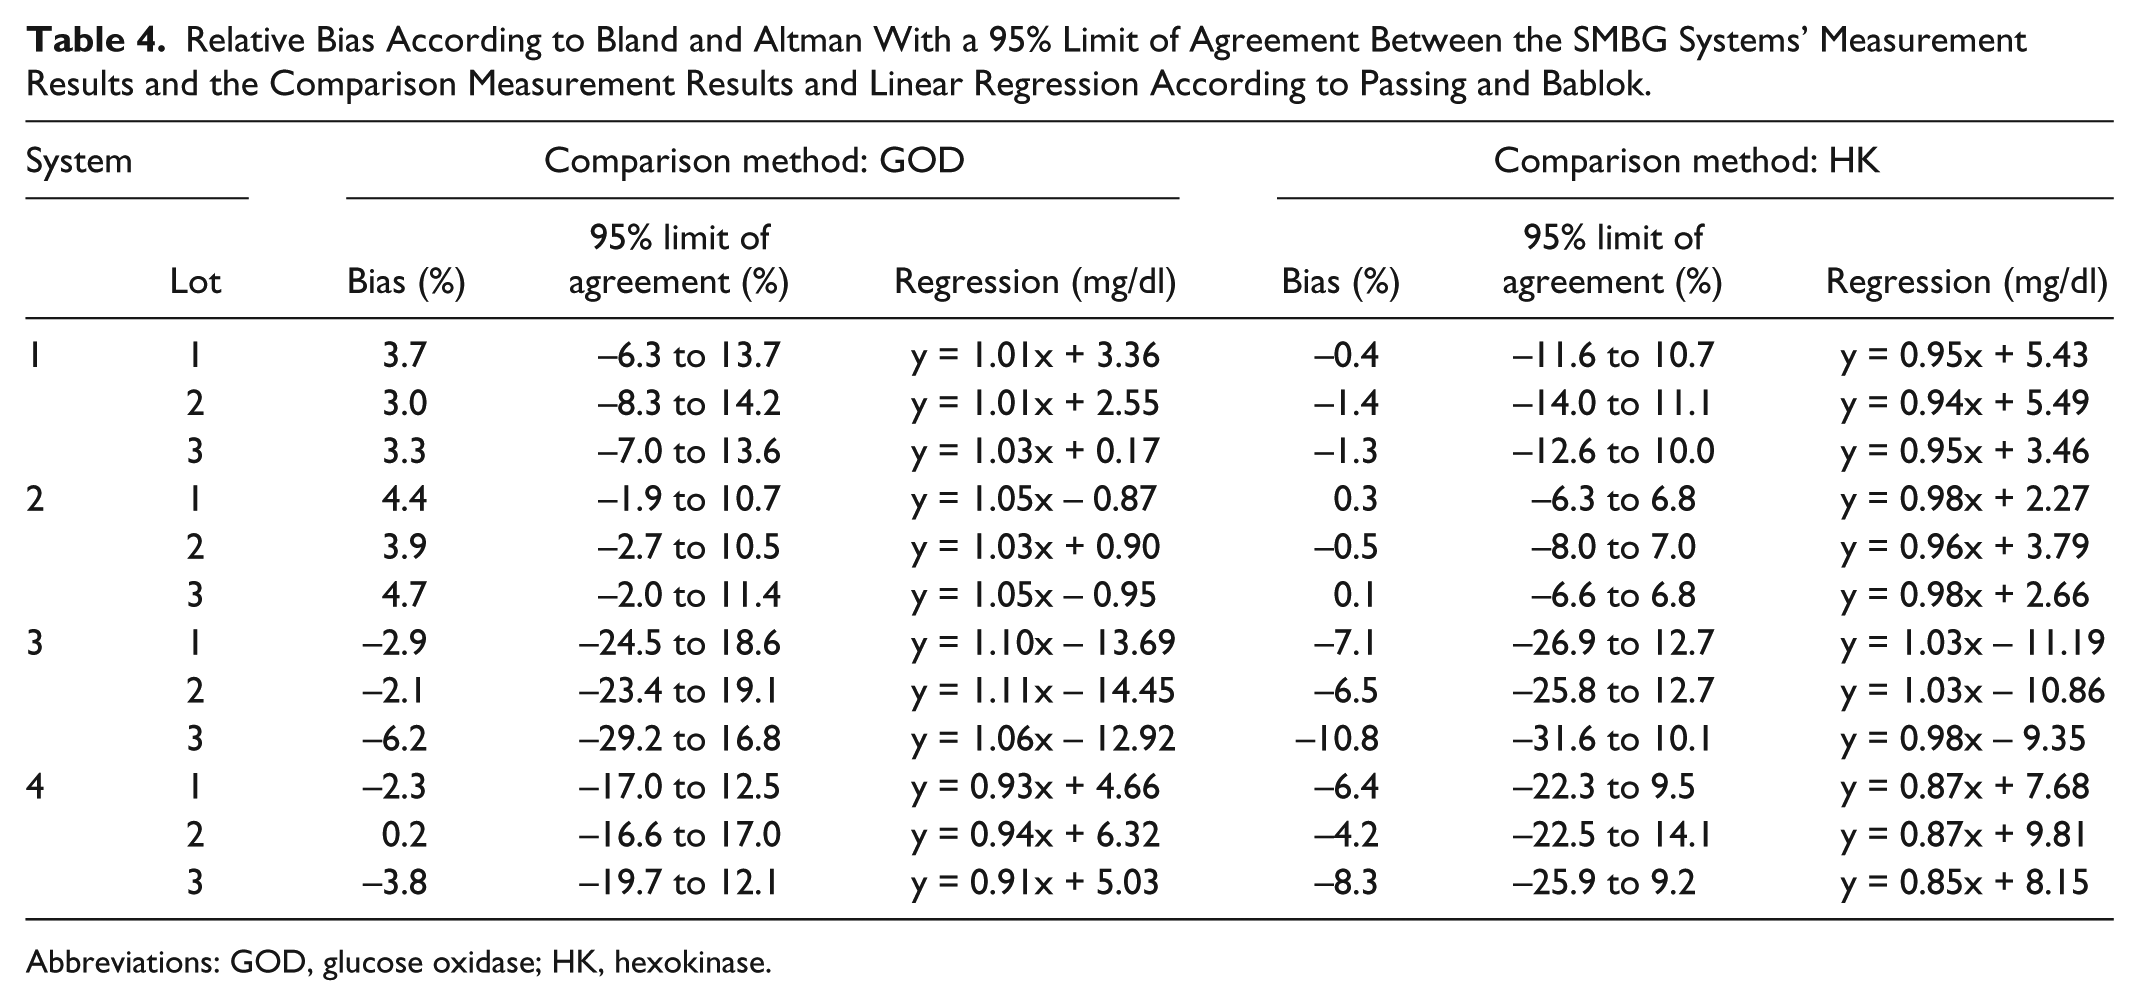
Abbreviations: GOD, glucose oxidase; HK, hexokinase.
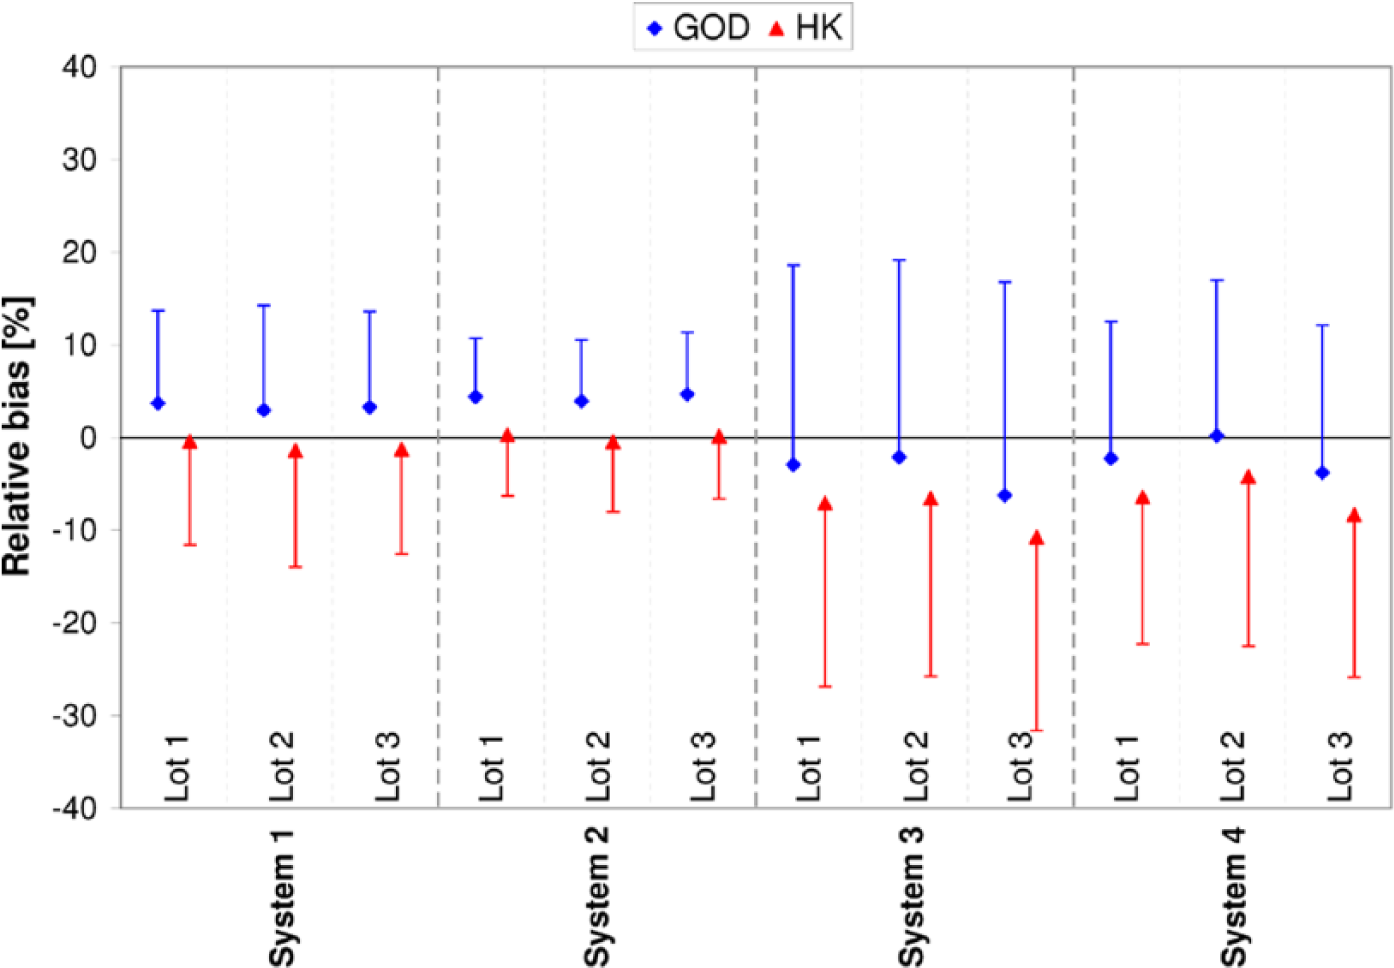
Relative bias according to Bland and Altman for each test strip lot. The relative bias evaluated by using the glucose oxidase (GOD) method is shown in blue diamonds with the upper 95% limit of agreement, the bias evaluated by using the hexokinase (HK) method is shown in red triangles with the lower 95% limits of agreement.
Discussion
In this study, the system accuracy of 4 SMBG systems was evaluated with 3 test strip lots each in a standardized manner under controlled laboratory conditions, under which influencing factors with potential impact on BG measurements were reduced to a minimum. System accuracy and other performance data of the systems investigated have also been reported in other studies.9-19 However, in our study, each system was evaluated by using 2 established comparison methods/systems, a GOD-based method/YSI 2300 STAT Plus glucose analyzer and a HK-based method/cobas c111 analyzer; the use of 2 methods allows for an investigation of possible impacts of the used comparison method/system on system accuracy.
ISO 15197:2003 stipulates the use of the manufacturer’s selected comparison method for system accuracy assessments. All 4 SMBG systems investigated in our study fulfilled ISO 15197:2003 accuracy criteria (at least 95% of results within ±15 mg/dl at BG concentrations <75 mg/dl and within ±20% at BG concentrations ≥75 mg/dl) with all 3 tested lots when evaluated against the respective manufacturer’s comparison method (GOD: 3 systems, HK: 1 system).
With the revision ISO 15197:2013, comparison method requirements have changed and any method that conforms to ISO 17511 traceability requirements 3 can be used. For both systems used in our study for comparison measurements, the YSI 2300 STAT Plus glucose analyzer and the cobas c111 analyzer, compliance with traceability requirements was confirmed by the manufacturers. Regarding accuracy results, the more stringent accuracy limits of ISO 15197:2013 (at least 95% of results within ±15 mg/dl at BG concentrations <100 mg/dl and within ±15% at BG concentrations ≥100 mg/dl) were fulfilled by 3 systems (systems 1, 2, and 4; Table 3) when the respective manufacturer’s comparison method was applied. Only 2 systems (systems 1 and 2; Table 3) met the accuracy criteria when the alternative comparison method was used. Regarding these results, it should be taken into account that only the accuracy limits but not all of the testing procedures of ISO 15197:2013 were applied, because at the time of the study, the final version was not yet published. Differences assignable to comparison methods/systems also became evident when considering the results of the bias analysis. Thus, the results of our study indicate that the comparison method/system can be an influencing factor as to whether accuracy data obtained for a given system comply with established standards or not.
The comparison method/system is used for the calibration of SMBG systems by the manufacturer and for the evaluation of SMBG systems. Following ISO 15197:2013, the evaluation of SMBG systems is not limited to the comparison method/system used for the calibration. Therefore, when interpreting system accuracy data one should be aware that the use of different comparison methods/systems can have an influence on the results obtained. Until now, only a few studies investigated possible systematic differences between different comparison methods/systems. In these studies, a bias of up to 8% between different comparison methods/systems was found.20,21 In a recent study performed at our institute following requirements of ISO 15197:2013, accuracy results also differed depending on the applied comparison method/system. 22 Therefore, a harmonized calibration of comparison methods/systems used for the calibration/evaluation of SMBG systems to a higher order standard is important.
Another important but often neglected factor that can affect system accuracy considerably is the variation between different test strip lots in the same system. Following ISO 15197:2003, system accuracy evaluation need only be performed with 1 test strip lot. However, in several studies, remarkable variations between different test strips were found for some SMBG systems.11,23,24 ISO 15197:2013 considers lot-to-lot variability more closely and stipulates that at least 3 different test strip lots of a system shall be included in the evaluation. For acceptable system accuracy, each individual lot must show 95% of results within the required limits (15 mg/dl/15%). In our study, minimal differences in relative bias between the 3 lots were found in 2 systems.
The results obtained in this study are comparable with recently published data.10,11,15,22,25,26
To ensure constant adherence of available SMBG systems to established standards, postmarket surveillance evaluations are recommended as being discussed in the current revision of the European directive for in vitro diagnostic medical devices. 27
Conclusions
ISO 15197:2003 accuracy criteria were fulfilled by all 4 SMBG systems with the evaluated test strip lots. More stringent accuracy criteria of ISO 15197:2013, for which compliance is recommended in 2016, were met by 3 systems (Accu-Chek Aviva, ContourXT, GlucoMen LX PLUS) when the manufacturer’s comparison method was applied. Only 2 systems (Accu-Chek Aviva, ContourXT) fulfilled ISO 15197:2013 accuracy criteria when the alternative comparison method was used. The results of our study indicate that the comparison method/system and the lot-to-lot variability can have an influence on SMBG system accuracy data. According to ISO 15197:2013 any method that conforms to established traceability requirements can be used for system accuracy assessment. To provide comparable information about SMBG system accuracy, a harmonized calibration of comparison methods/systems used for the calibration/evaluation of SMBG systems to a higher order standard is important.
Footnotes
Acknowledgements
We would like to thank the study personnel and other employees of the IDT who conducted the study and helped preparing the manuscript. We would also like to thank Thorsten Petruschke for reviewing the manuscript and Anne Deveson for proofreading the manuscript. Parts of these data were presented at the Diabetes Technology Meeting 2013 in San Francisco, CA, USA, October 31-November 2, 2013, at the 7th International Conference on Advanced Technologies & Treatments for Diabetes in Vienna, Austria, February 6-8, 2014, and at the IFCC WorldLab Istanbul 2014 in Istanbul, Turkey, June 22-28, 2014.
Abbreviations
BG, blood glucose; CE, Conformité Européenne; CEG, consen-sus error grid; GDH, glucose dehydrogenase; GOD, glucose oxidase; HK, hexokinase; ISO, International Organization for Standardization; pO2, partial pressure of oxygen; SMBG, self-monitoring of blood glucose.
Declaration of Conflicting Interests
The author(s) declared the following potential conflicts of interest with respect to the research, authorship, and/or publication of this article: All authors are employees of the IDT, which carries out studies on the evaluation of BG meters and medical devices for diabetes therapy on behalf of various companies. GF is general manager of the IDT. GF/IDT have received speakers’ honoraria or consulting fees from Abbott, Bayer, Berlin-Chemie, Becton-Dickinson, Dexcom, Menarini Diagnostics, Novo Nordisk, Roche Diagnostics, Sanofi, and Ypsomed.
Funding
The author(s) disclosed receipt of the following financial support for the research, authorship, and/or publication of this article: This study was funded by Bayer Vital GmbH, Leverkusen, Germany.