
Abstract
Pharmacokinetic (PK) models describing the transport of insulin from the injection site to blood assist clinical decision making and are part of in silico platforms for developing and testing of insulin delivery strategies for treatment of patients with diabetes. The ability of these models to accurately describe all facets of the in vivo insulin transport is therefore critical for their application. Here, we propose a new model of fast-acting insulin analogs transport from the subcutaneous and intradermal spaces to blood that can accommodate clinically observed biphasic appearance and delayed clearance of injected insulin, 2 phenomena that are not captured by existing PK models. To develop the model we compare 9 insulin transport PK models which describe hypothetical insulin delivery pathways potentially capable of approximating biphasic appearance of exogenous insulin. The models are tested with respect to their ability to describe clinical data from 10 healthy volunteers which received 1 subcutaneous and 2 intradermal insulin injections on 3 different occasions. The optimal model, selected based on information and posterior identifiability criteria, assumes that insulin is delivered at the administrative site and is then transported to the bloodstream via 2 independent routes (1) diffusion-like process to the blood and (2) combination of diffusion-like processes followed by an additional compartment before entering the blood. This optimal model accounts for biphasic appearance and delayed clearance of exogenous insulin. It agrees better with the clinical data as compared to commonly used models and is expected to improve the in silico development and testing of insulin treatment strategies, including artificial pancreas systems.
Type 1 diabetes mellitus (T1DM) is a disease of autoimmune destruction of the beta cells in the pancreas, which leads to a progressive and, ultimately, to an almost complete lack of endogenous insulin. In patients with T1DM, exogenous insulin is required to maintain blood glucose homeostasis. Accurate delivery of insulin is critical since overdosing may lead to severe and potentially fatal hypoglycemia, 1 while under-dosing could result in hyperglycemia which can be harmful both acutely and chronically. 2 However, accurate dosing depends on a reliable prediction of insulin appearance in, and clearance from, the blood. Such prediction is needed for the design of accurate insulin delivery profiles and is critical for the development of in silico simulation platforms for development and testing of insulin infusion algorithms.
Several routes for insulin delivery have been used clinically, including the intravenous (IV), subcutaneous (SC), intradermal (ID), interperitoneal, and, more recently, the intrapulmonary and intranasal routes.3,4 The kinetic modeling of SC delivery has been the focus of extensive research.5 -9 A 3-compartment model was first proposed for multiple SC insulin injections, 9 which was later adopted for intersubject evaluation 10 (see Nucci and Cobelli 8 for a comprehensive review of the existing continuous and discrete kinetic models of SC delivery). In Wilinska et al 5 the authors selected an optimal model over 11 candidates, in which the slower transport accounts for transition and equilibration processes between the different insulin aggregation states (monomer, dimer, hexamer).6,7,11 Some of these kinetic models are critical components in comprehensive metabolism modeling to aid the development of insulin delivery algorithms.12 -14 In such applications, the model parameters represent individual characteristics and, as discussed in Heinemann, 15 may have significant interpatient variability due to differences in injection sites,16,17 lipodystrophy variations, 18 and/or demographic diversities. 19 Accurate representation of the parameter variation has allowed for the creation of an in silico population for preclinical trials, which has been accepted by the Food and Drug Administration (FDA) as a substitute of preclinical trials.20,21
To our knowledge, the kinetics of the ID delivery route has never been described mathematically and the goal of this study is to develop a unifying model that can accurately depict the specifics of both the ID and SC insulin delivery routes. This effort is also justified by human trials outcomes in which the ID route showed faster absorption and action of exogenous insulin as compared to the SC route.22 -26 In addition, even though existing SC models approximate fairly well most of the in vivo insulin kinetics, certain phenomena that seem to be present in the clinical data are not represented such as the delayed spiking,22,27 the biphasic appearance and delayed clearance.5,28
Methods
Experimental Protocol and Clinical Data
The data were collected during a previous clinical safety and feasibility trial. 22 Ten healthy male volunteers (age 31.0 ± 6.3 years, BMI 23.7 ± 1.7 kg/m2, weight 75.2 ± 5.3 kg) were given a 10-unit injection of insulin analog lispro (Humalog®, Eli Lilly, Indianapolis, IN) under euglycemic glucose clamp conditions and after an overnight fast. Each volunteer received 1 SC and 2 ID treatments on 3 separate test days with a washout period of 3-20 days. The data were collected via a very specific radioimmunoassay to the injected insulin analog with a 2% relative error of the measurement.
There are 30 data sets in total (10 SC and 20 ID profiles) and each data set consists of 17 data points. As shown in Figure 1, the insulin appearance and clearance in plasma seem to be more rapid in the ID route than in the SC route for the first 100 minutes. The 2 delivery routes also appear to have similar long-tail clearance rate. Another interesting phenomenon observed in the data is the possible biphasic appearance (2 peaks) in the bloodstream of exogenous insulin (Figure 2). The standard model may not capture accurately the observed variability in the data.
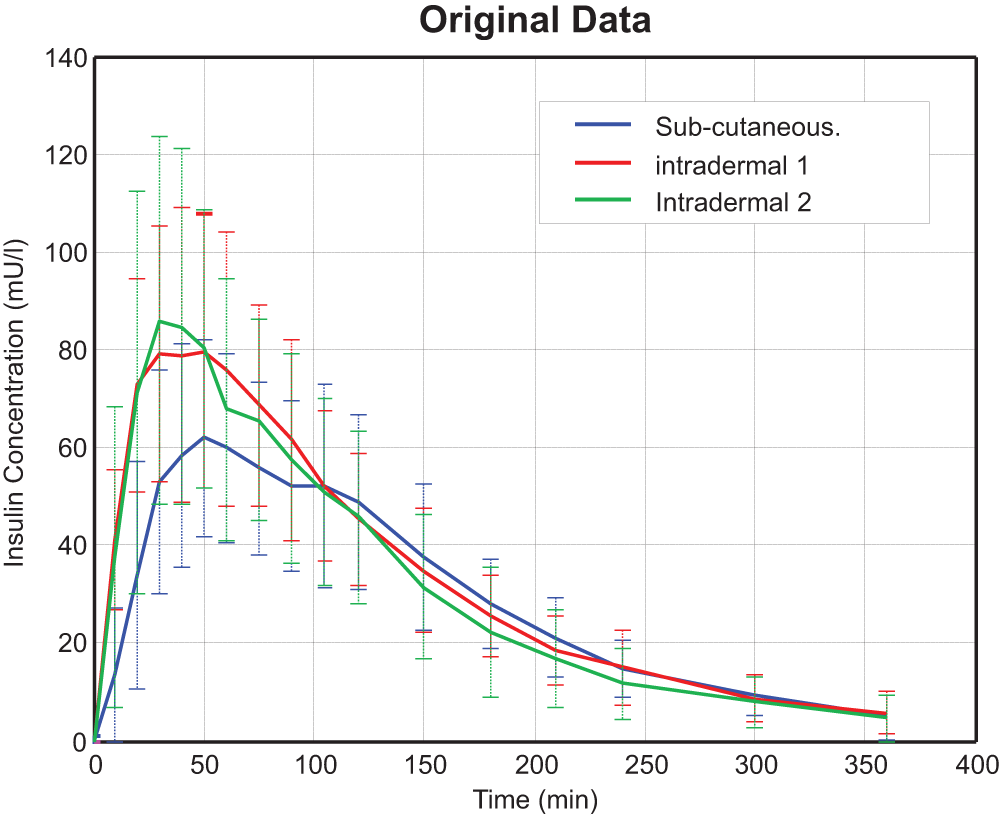
Plasma insulin concentrations for SC, ID 1, and ID 2 routes on 10 subjects (mean ± SD).
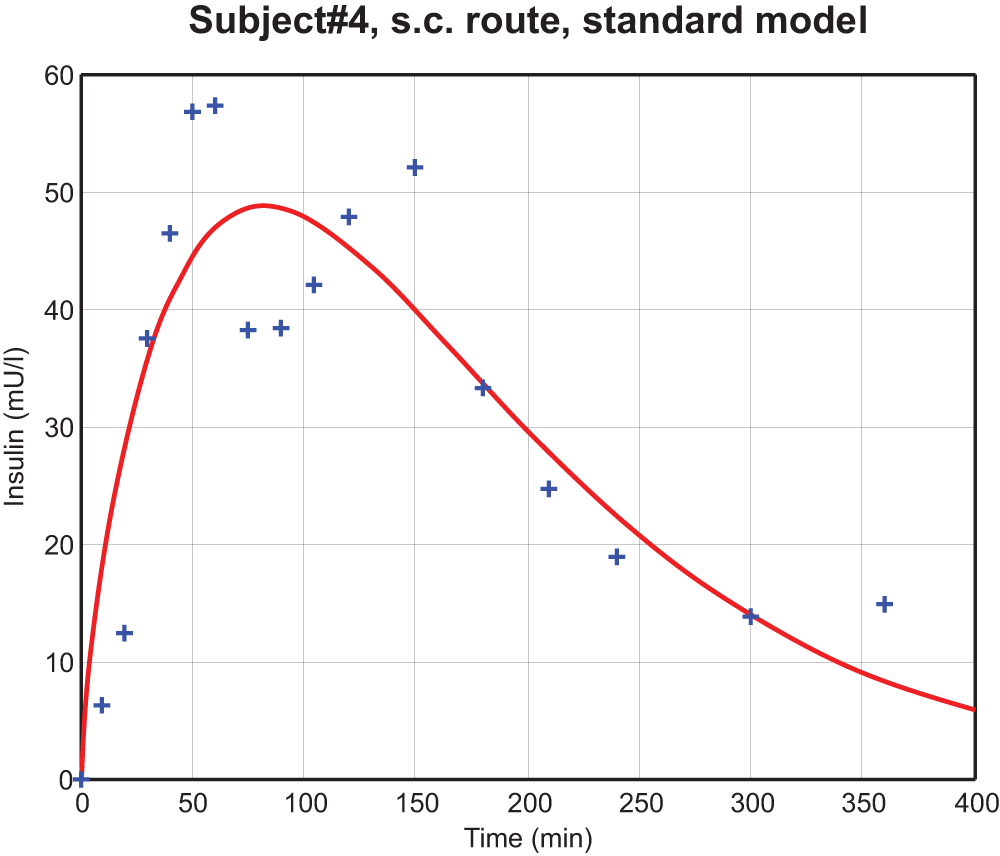
Biphasic phenomenon in subject 4 (SC route). Crossing symbols are the experimental data, and the red curve is the fit using a standard model as a reference. 13
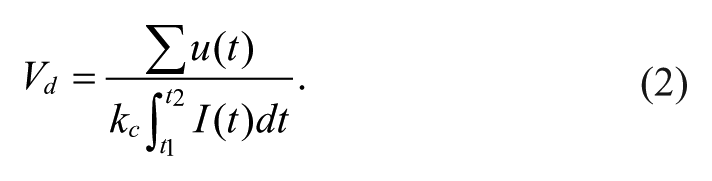
Volume of Distribution
The kinetics of insulin in plasma is determined by a single compartment model
29
with the assumption that all injected insulin
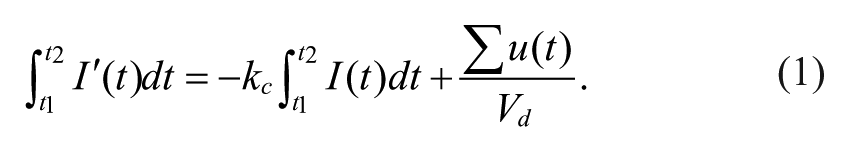
Given enough time, the left-hand-side of Eq. 1 will be equal to 0. So:
Model Representations
We propose for comparison 9 pharmacokinetic (PK) models of insulin appearance summarized in Table 1 ordered by level of complexity.
Models Representations.

Model 1 is a standard (reference) model, currently adopted in the preclinical simulation platform approved by FDA20,21 and for insulin treatment strategies design.30,31 It has 3 compartments and the input is delivered at compt. 1, then it follows either (1) direct diffusion to the plasma (compt. 3) or (2) traveling through an intermediate compartment (compt. 2) before arriving at compt. 3.
Models 2, 3, and 3a are derived from model 1 with an auxiliary intermediate compartment to create a second delayed insulin spike in plasma. In model 2, all diffusions between the compartments are linear; while in model 3, a sigmoid function is used to describe the diffusion between compartments 2 and 3. In model 3, the sigmoid index is fixed
Model 4 (delayed appearance model) imposes a direct time delay to model 1. It assumes that a fraction (A) of the input appears immediately at the administrative site (compt. 1) while the rest (1-A) arrives at comp 1 with a delay of Δ minutes.
Model 5 is described as a transfer function of the Laplace-domain variable approximating a series of diffusions from the administrative site (comp 1) to the plasma (comp 2). The parameters of the transfer function are: a (count parameter, a≥1) representing the number of diffusion compartments and b (rate parameter, min-1) representing the diffusion rate between the compartments.
Models 6 through 9 use 2 or 3 (instead of 1, as in model 5) serial-compartmental diffusion blocks to depict various transport kinetics. In these models, insulin is delivered at the administrative site (comp 1) and is then transported through the diffusion blocks. To avoid the nonidentifiability during optimization, 1 of the diffusion rates is fixed at 0.04 min-1, as it was shown to be nonidentifiable in preliminary analysis (model 6a, not included in analysis). The other diffusion parameters account for the distribution difference among the diffusion blocks. The count parameter
Model 10 is the optimal model in Wilinska et al. 5 The injected insulin is diverted into the slow and fast channels respectively, which have local degradations (following Michaelis-Menten relation).
Model Fitting
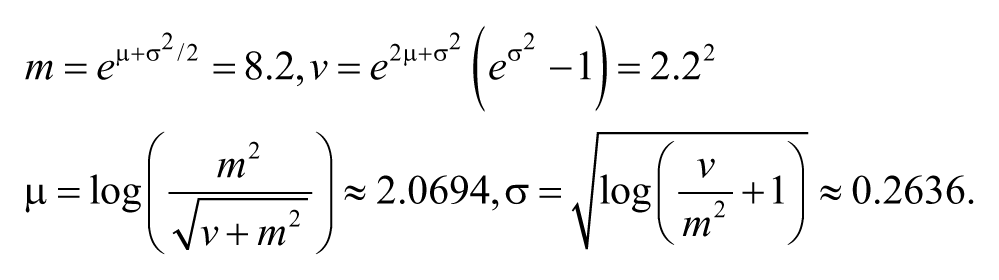
All 9 candidate models were fit to the 30 available data sets for each 1 of the 3 delivery profiles. As the decay of insulin during the “tail” represents a relatively slow removal process, a priori distribution is imposed on the plasma clearance parameter. Given that the insulin clearance rate (kc) follows a log-normal distribution32,33 and the half-life of the second phase of exogenous insulin in plasma of normal volunteers is 8.2 ± 2.2 minutes, 34 the normal mean (μ) and variance (σ) of the half-life are derived from the log-normal mean (m) and variance (υ) as follows:
Therefore, the cost function is defined as:
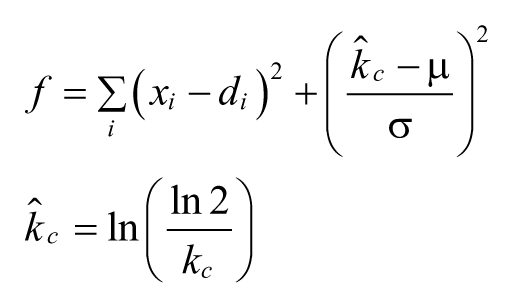
where xi and di represent the model fit and the actual clinical data, respectively and
For models 5 through 9, the count parameters (
Model Selection Criteria
The Bayesian information criterion (BIC) is adopted for model selection given as
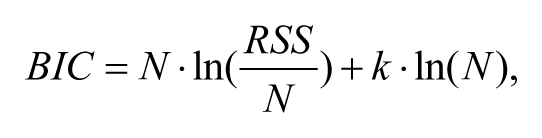
where N is the number of data points (excluding the initial datum at time 0), k is the degree of the optimization space, and RSS is the value of the cost function. A smaller BIC value implies a better model representation.
A 2-step procedure was implemented for model selection/rejection:
A model is rejected if its BIC values in at least 1 route are significantly larger than the corresponding BIC values of another model from the same group and the remaining BIC values are not significantly different. Priority is given to rejections based on the highest number of routes in which BIC is significantly different. A 2-tailed paired t test is used to compare the BIC values; P < .05 is considered statistically significant.
A model is rejected if 1 or more of its parameters are not identifiable. The identifiability of a parameter is determined by the Jacobian derivation method for each subject in each delivery route. A parameter will be identifiable if the value of CV is less than 100% indicating that parameter estimate accuracy is acceptable considering a posteriori identifiability.
35
For models 5 through 9, after finding the optimal count parameters (
Results
After all data sets were fitted with the 9 candidate models, we found that the standard model and its derivatives (models 1 through 3) cannot reproduce biphasic phenomena due to limitations of their structure. The delayed appearance model (model 4) and the serial-compartmental diffusion models (models 5 through 9) on the other hand can approximate a biphasic kinetics. This notion is exemplified in Figures 3 and 4.
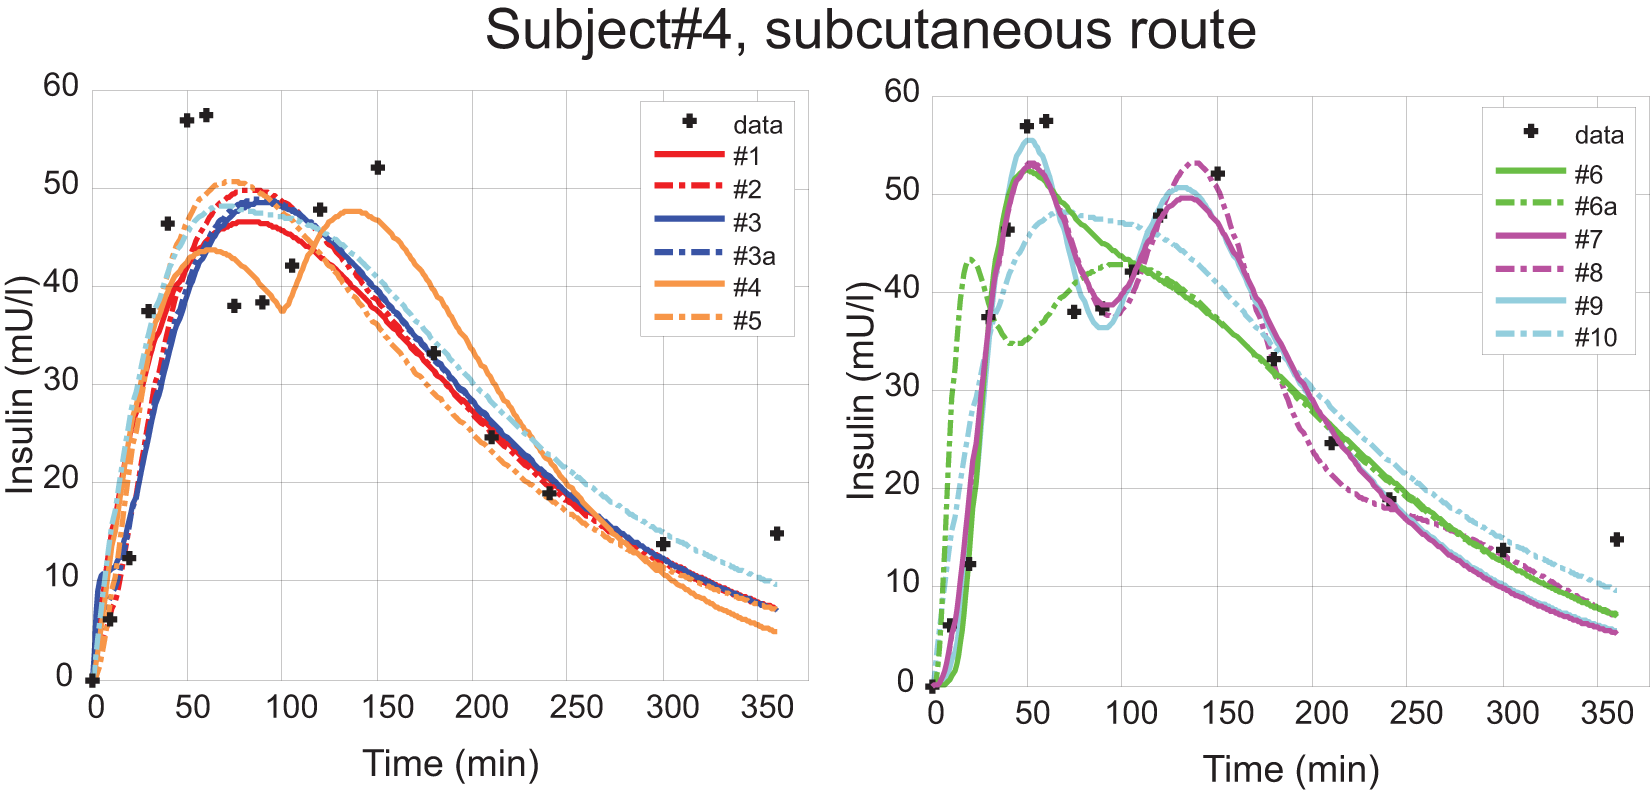
Subject 4, subcutaneous route. Measured data are represented by the black crosses; all model fits are represented as continuous curves.
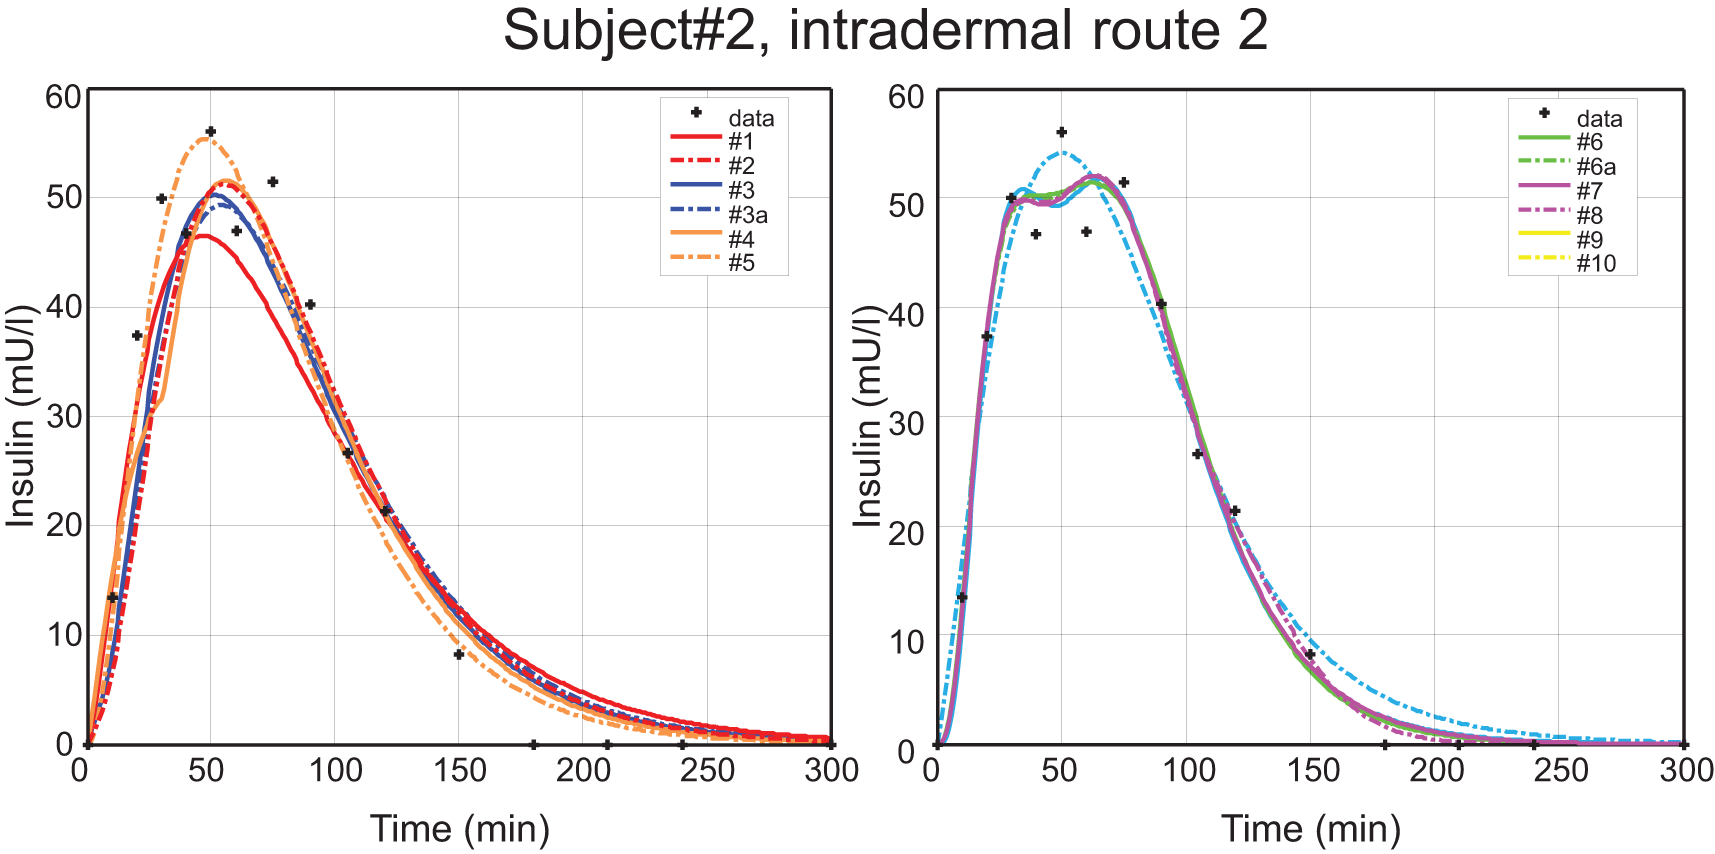
Subject 2, intradermal route 2. Measured data are represented by the black crosses; all model fits are represented as continuous curves.
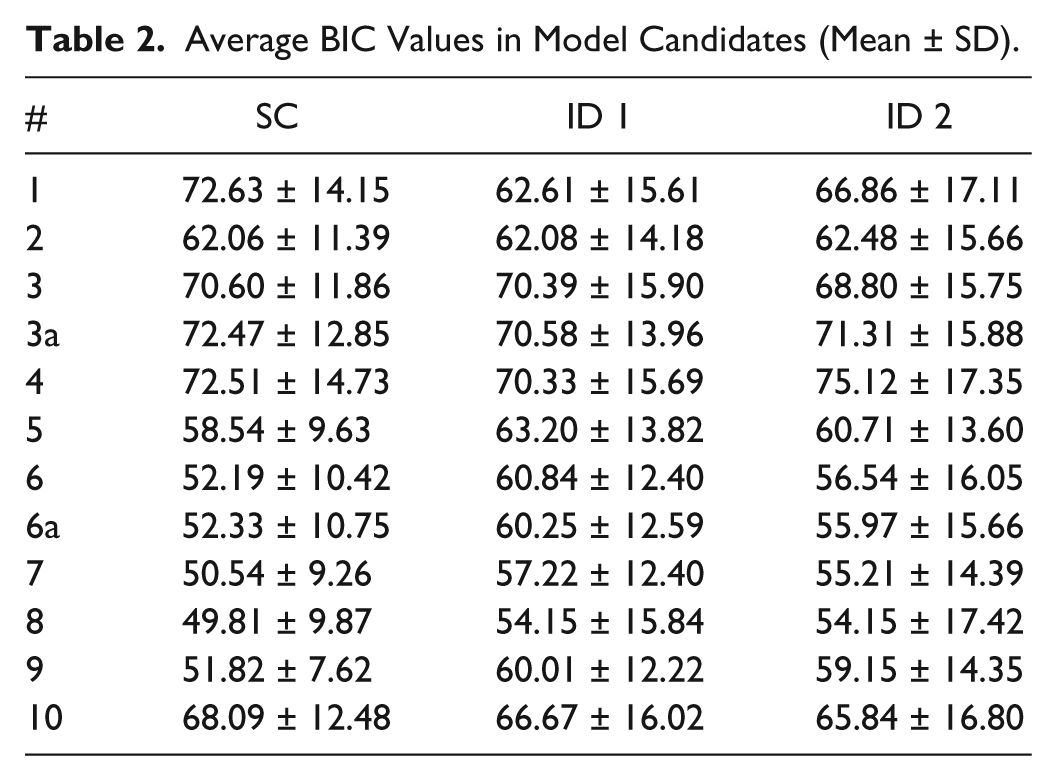
To visualize the performance of all tested models, the average residual errors of the 10 volunteers were compared in Figure 5 in 3 time intervals 0-60 minutes (immediate appearance), 60-120 minutes (late appearance), after 120 minutes (tail clearance) to test the ability to accurately capture different phases of the appearance of exogenous insulin in the bloodstream. In particular, the figure shows that models 1 through 5 fail to capture well the first 2 phases where the biphasic phenomenon occurs. The BIC values of all 9 model candidates are given in Table 2.
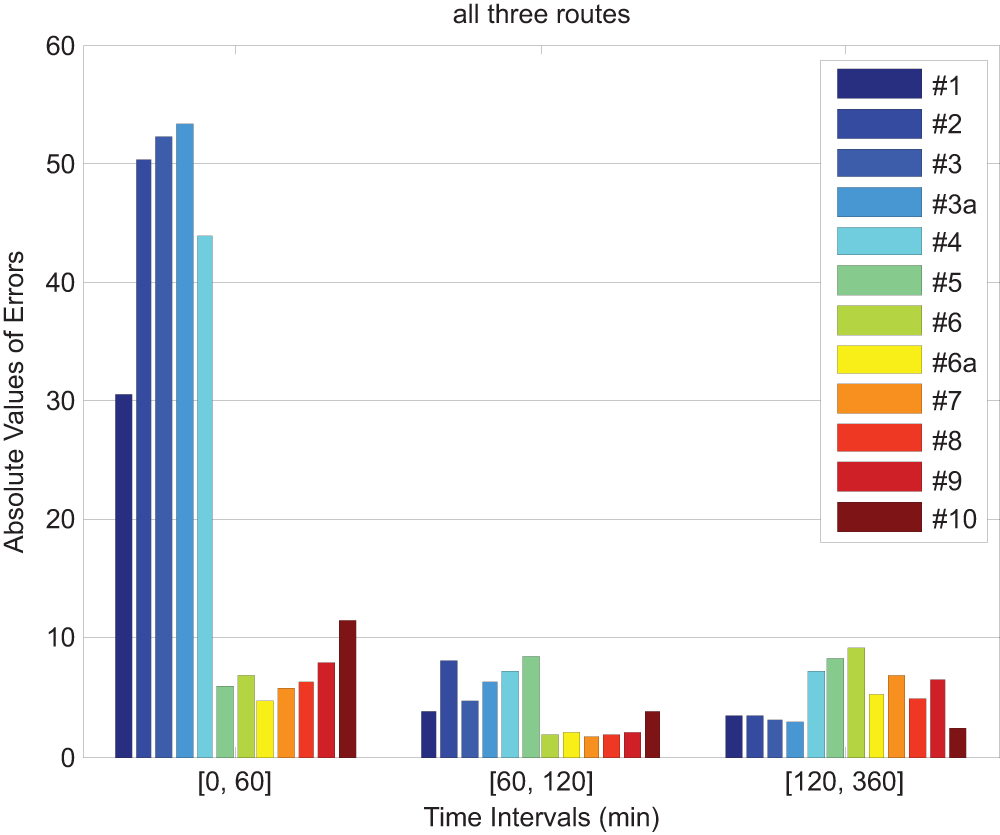
Average absolute residual errors of the 10 subjects (3 routes; 30 data sets total) across all the model candidates for insulin appearance onset, peak and decay.
Average BIC Values in Model Candidates (Mean ± SD).
Model Selection
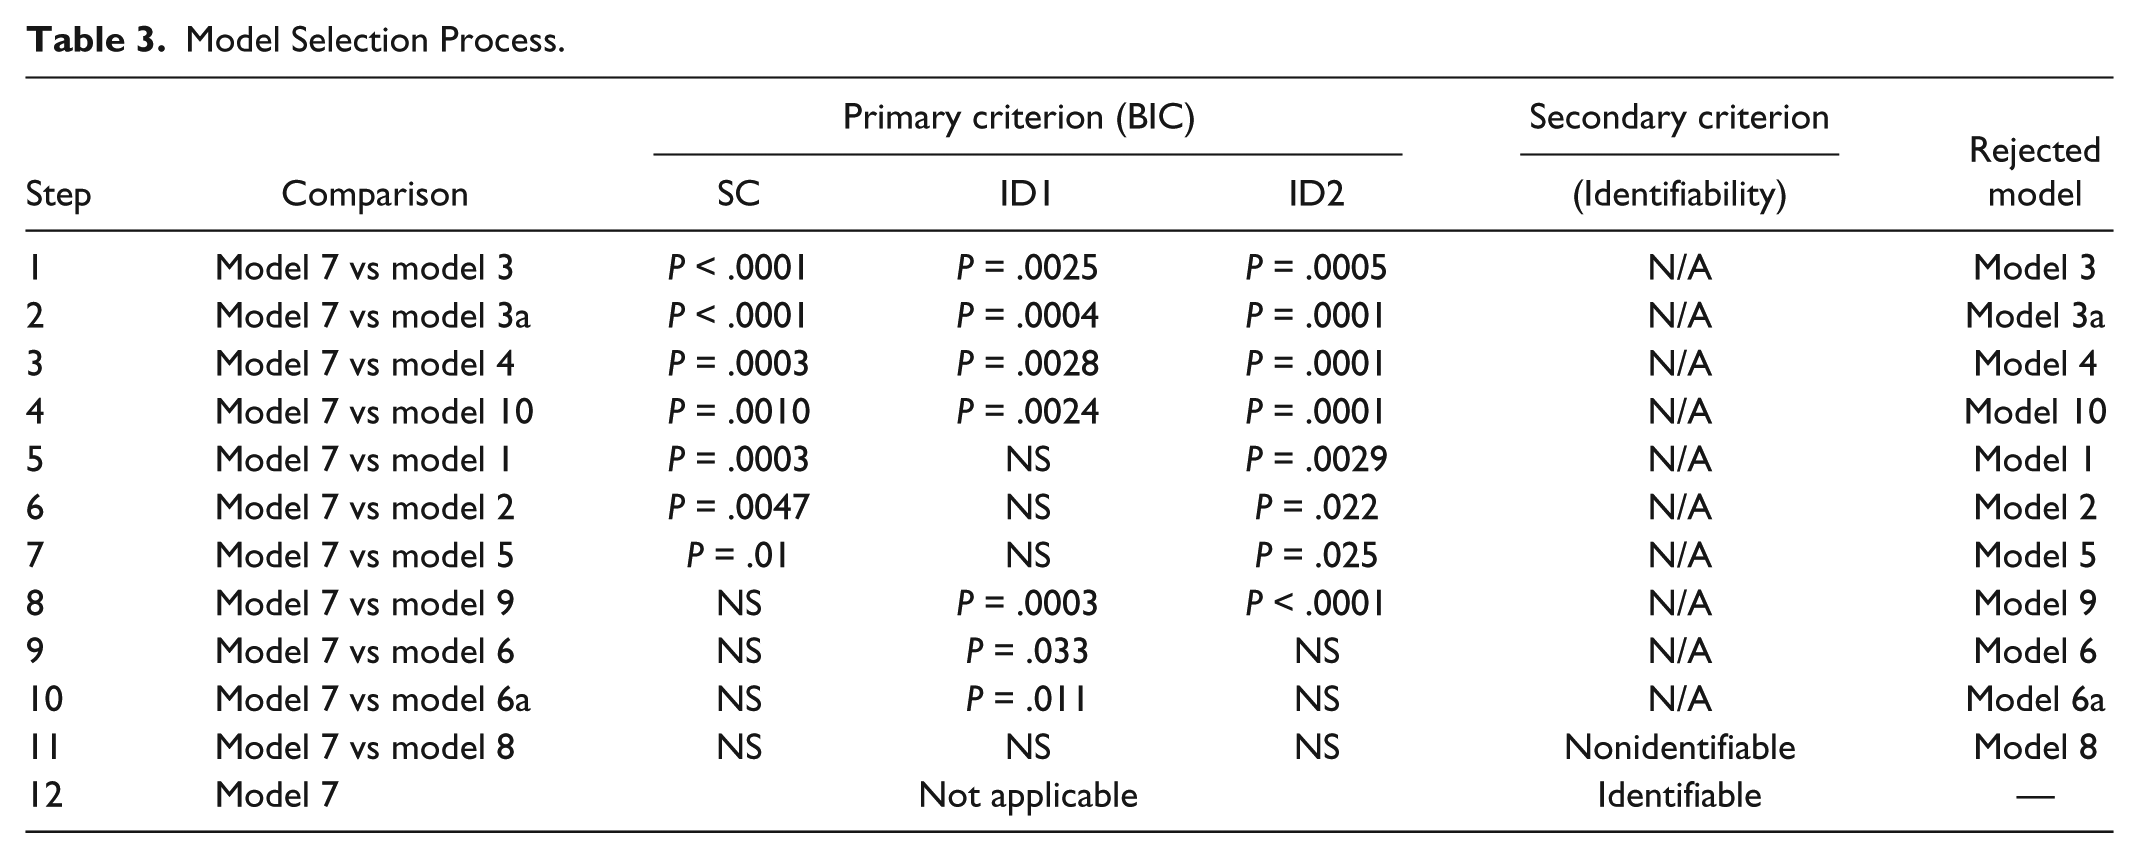
Models 3, 3a, 4, and 10 are rejected first since their BIC values were significantly larger in all routes than the BIC values of model 7. Moreover, model 3a (with the free index) has significant greater BIC values than those of model 3 (with the fixed index) in Route SC and ID2. Models 1, 2, 5, and 9 are rejected since 2 of their BIC values are significantly larger than the corresponding BIC values of model 7 and the remaining BIC values are not significantly different. Analogously, we reject models 6 and 6a which are outperformed by model 7 in the ID 1 route respectively. Among the remaining 2 model candidates, models 7 and 8, model 8 are rejected since some of their parameters are nonidentifiable (CV > 200%). The model selection/rejection process is recapitulated in Table 3. The parameters of model 7 are identifiable (CV < 100%) shown in Table 4 (mean ± SD).
Model Selection Process.
Average Optimal Parameter Values of Model 7 (Mean ± SD) and CV Values.
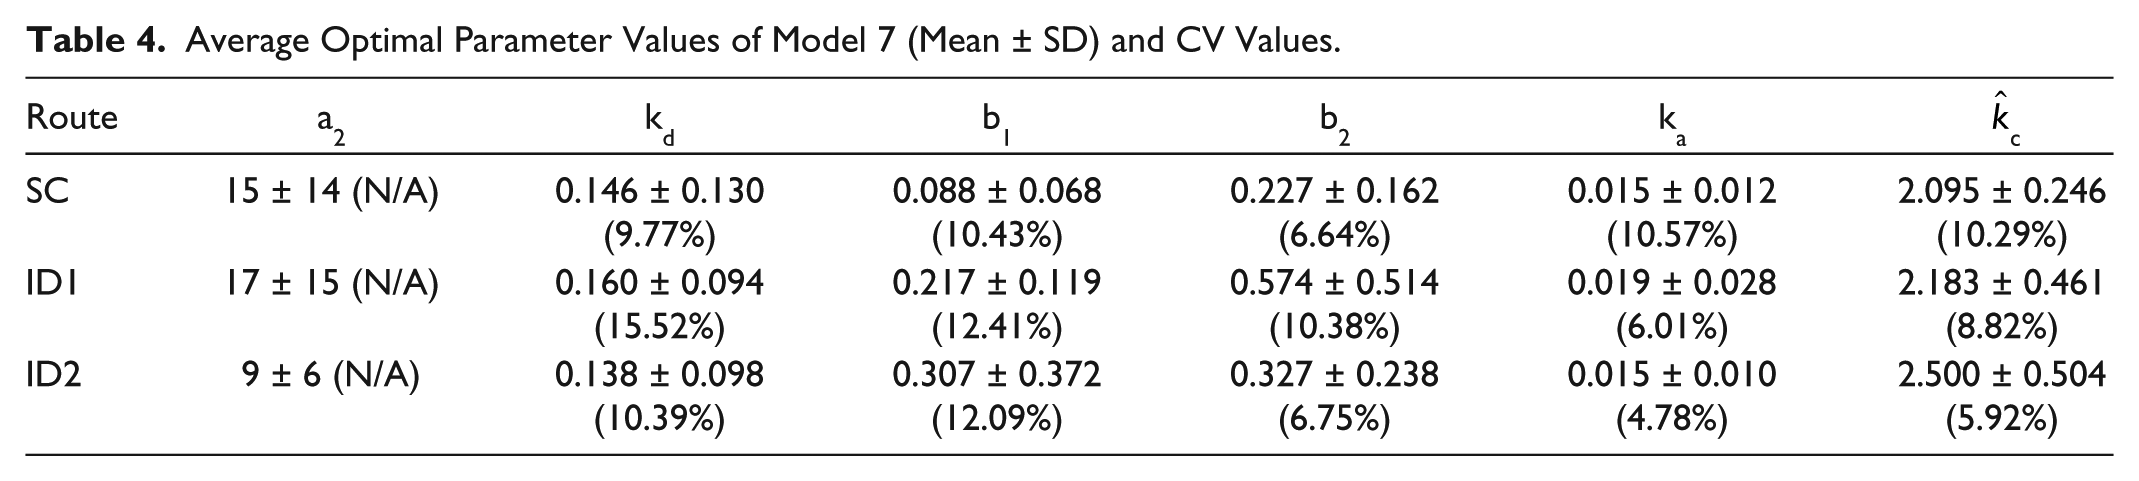
In summary, model 7 is selected as the optimal choice among all candidates. Its average parameters are given in Table 4. Model 7 recreated similar insulin appearance shown in Figure 1, which demonstrates the excellent capability of the optimal model to track the PK specifics of the experimentally observed exogenous insulin appearance and clearance. The residuals are demonstrated in Figure 6 as well.
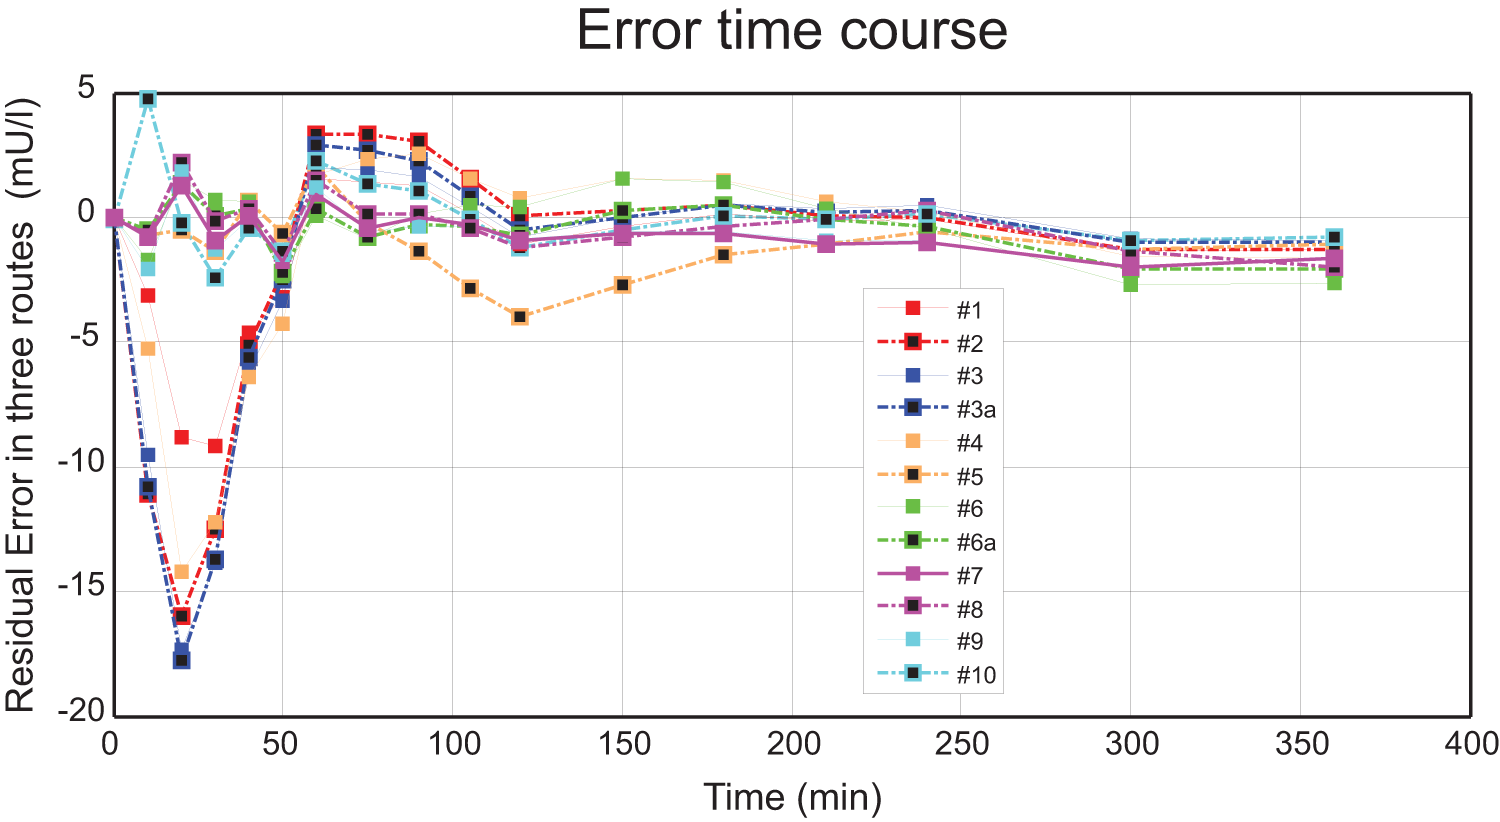
Average residual errors across all the model candidates for each insulin concentration measurement across all routes and subjects.
Discussion
This work uses data from a previous clinical safety and feasibility trial 22 to develop and verify a new unified PK model of a fast-acting insulin analog transport from the subcutaneous and intradermal spaces to the circulation. This model addresses a need for an accurate prediction of insulin transport that accommodates a biphasic appearance and delayed clearance of exogenous insulin required for the development of in silico simulation platforms and insulin delivery algorithms.
To develop and validate the new model we have adopted the following approach. Nine models with different complexities are proposed for assessment including 3 standard models (models 1, 2, 3, and 3a), a delayed appearance model (model 4), and 5 serial-compartmental diffusion models (models 5 through 9). The performance of all models is estimated based on their ability to describe the available clinical data. The individual fits optimize a cost function modified to penalize deviations of the elimination rate kc from a value corresponding to a literature derived half-life of circulating insulin. This was done to guarantee that the models would capture accurately the final phase of insulin appearance in the bloodstream (the “tail”: 120-360 min) which is needed for safe model application (below).
In terms of model performance, models 1, 2, 3, and 3a had larger errors in the first 2 hours after the infusion (Figure 3) corresponding failure to capture correctly the tendency in the data of an insulin spike to rapidly appear within an hour after the injection followed by a second delayed spike during the second hour after the injection. These large errors could indicate that the structure of the standard model and its derivatives is not “rich” enough to reproduce the biphasic kinetics of insulin which appears present in some of the data sets. The underlying cause for the differences in the PK parameters between the SC and ID delivery routes has not been completely established, but may be due to differences in the local fat tissue structure 19 or to differences in the vasculature of the infusion site with a tendency for the venous capillaries to mediate the insulin transport from the SC tissue and for the lymphatic vessels to facilitate the appearance after an ID injection. 22
Model 4 adopts a delayed release and imposes immediate distribution of injected insulin into 2 separate channels, but still may not represent the first and the second peaks (Figures 3). Similarly, model 5 (single serial-compartmental diffusions) is not able to depict well the biphasic phenomenon either.
Models 6, 6a, 7, 8, and 9 adopt different strategies to compensate for the limitation of the single serial-compartmental diffusions. Models 6 and 6a have dual serial-compartmental diffusions. Model 7 adds an intermediate diffusion compartment, model 8 adds a third diffusion compartment, and model 9 adds 2 intermediate diffusion compartments before plasma. These 4 models improved the fitting showing that their structures provides a better approximation of the physiology of in vivo exogenous insulin delivery. Among these models, model 7 is chosen as the best representation for an insulin PK transport model.
To summarize, models 1, 2, and 3 cannot reproduce a dual phase insulin appearance. Models 4 and 5 have larger errors over the population as compared to models 6, 6a, 7, 8, and 9 which can reproduce a biphasic appearance and a slower final clearance phase. The values of BIC will confirm that increasing the model complexity and the degree of optimization space does not interfere with the ability of the models to describe the data. to avoid the overfitting of the limited points in the current data set, we did not investigate models more complex than models 7 to 9. The physiological relevance of model 7 is also supported by the identifiability of its parameters.
In 1 application of the current modeling efforts, we tested whether there exists a relationship between a prolonged clearance and the delayed appearance of the insulin spike(s). In particular, model 7 was used to analyze all 10 volunteers in the 3 delivery routes separately. The last insulin peak time were recorded and compared to the corresponding fitted half-lives in plasma. We found that there was no significant association (r < .5, P > .5) between the onset time of the last insulin peak and the half-life in plasma. However, this may not be sufficient to suggest the independence between the insulin transport in tissue and its removal from plasma since a weighting of half-life is defined in the cost function, which may need further study.
Our results demonstrate that models capable of recreating a biphasic appearance of exogenous insulin agree better with the clinical data. In particular, the selected optimal unified (SC & ID) PK model significantly outperforms existing standard models, which cannot recreate biphasic appearance. This outcome supports the concept that the biphasic phenomenon exists and suggests a putative system-level physiological mechanism that could mediate it. This mechanism is embodied in the optimal chosen model (model 7)—a serial-compartmental diffusion model that assumes that insulin is delivered at the administrative site and is further transported to the circulation through 2 separate diffusion routes.
Although biphasic appearance seems present in the individual data from many volunteers in all administration routes, the overall population averages shown in Figure 1 does not have this property due to significant intersubject variability, such as widely distributed time and/or magnitude of the onset of the second phase appearance. The data in Figures 2A and 2B show different insulin profiles (2 distinct, widely separated phases and comparable dual-peak levels vs 2 peaks close to each other and at different levels). This large intersubject variability favors future efforts to concentrate on creating individual distributions for use in in silico simulation platforms rather than using averaged population parameters.
A limitation of the current study is that 10 subjects is not enough to consider the model valid across a broader population. Moreover, the data were obtained from normal volunteers. Some physiological characteristics approximated by the model may be different in patients with T1DM and it may be necessary to create parameter distributions specific for T1DM patients before the new model can be fully incorporated into in silico pretrial simulation platforms (such as the UVa/Padova T1DM simulator).
Conclusion
Existing standard compartmental linear models of insulin transport form the injection site to the circulation can reproduce only a single phase mode of insulin appearance. Clinical data in healthy volunteers however suggest a mode of biphasic appearance after SC or ID delivery. This work proposes an insulin transport model based on the comparison of 9 model candidates with increasing complexities deliberately introduced to depict the biphasic phenomenon. An information criteria-based analysis shows that a model with 2 serial-compartmental diffusions and 1 intermediate compartment provides the best description of the clinical data in both the SC and ID delivery routes. The selected optimal model can be further incorporated into control algorithms and simulating platforms, or can be used to assist the development of more accurate profiles of exogenous insulin appearance with an immediate clinical impact.
Footnotes
Acknowledgements
The authors would like to thank BD for providing the insulin data, Stephen Patek and Edward Ortiz for physiology discussions, and Stacey Anderson for discussion on clamp procedures.
Abbreviations
BIC, Bayesian information criterion; FDA, Food and Drug Administration; ID, intradermal; IV, intravenous; PK, pharmacokinetics; SC, subcutaneous; T1DM, type 1 diabetes mellitus.
Declaration of Conflicting Interests
The author(s) declared no potential conflicts of interest with respect to the research, authorship, and/or publication of this article.
Funding
The author(s) disclosed receipt of the following financial support for the research, authorship, and/or publication of this article: This work was supported in part by the National Institute of Health under grants R01 DK51562, R01 DK082805, and JDRF 17-2011-273