
Abstract
Background:
Current diabetes education methods are costly, time-consuming, and do not actively engage the patient. Here, we describe the development and verification of the physiological model for healthy subjects that forms the basis of the Eindhoven Diabetes Education Simulator (E-DES). E-DES shall provide diabetes patients with an individualized virtual practice environment incorporating the main factors that influence glycemic control: food, exercise, and medication.
Method:
The physiological model consists of 4 compartments for which the inflow and outflow of glucose and insulin are calculated using 6 nonlinear coupled differential equations and 14 parameters. These parameters are estimated on 12 sets of oral glucose tolerance test (OGTT) data (226 healthy subjects) obtained from literature. The resulting parameter set is verified on 8 separate literature OGTT data sets (229 subjects). The model is considered verified if 95% of the glucose data points lie within an acceptance range of ±20% of the corresponding model value.
Results:
All glucose data points of the verification data sets lie within the predefined acceptance range. Physiological processes represented in the model include insulin resistance and β-cell function. Adjusting the corresponding parameters allows to describe heterogeneity in the data and shows the capabilities of this model for individualization.
Conclusion:
We have verified the physiological model of the E-DES for healthy subjects. Heterogeneity of the data has successfully been modeled by adjusting the 4 parameters describing insulin resistance and β-cell function. Our model will form the basis of a simulator providing individualized education on glucose control.
Diabetes is a serious and life-threatening condition that reduces the quality of life of the patient and is also costly, both in medical costs and in lost work-hours. 1 The incidence and severity of the complications of diabetes can considerably be reduced if patients develop a lifestyle that leads to good glycemic control.2,3 Research has shown that diabetes education can reduce HbA1c over a longer period,4,5 resulting in a lower risk of complications.6,7 Education is therefore a fundamental part of diabetes care. It is currently provided in several 1-on-1 or group sessions with a physician, diabetes nurse, dietician, or podiatrist. This is time-consuming and costly.
A major part of diabetes education is learning how to adjust insulin injections based on carbohydrate intake, exercise and factors like stress or illness. However, possibilities for the patient to safely practice with this newly acquired knowledge are limited to trying different strategies on his own body. This gives a considerable risk of hypo- or hyperglycemia.
Electronic educational tools can provide patients with an environment in which they can safely practice with factors influencing glycemic control, improving HbA1c and other diabetes outcomes.8,9 Two types of electronic environments currently exist: diabetes games (eg, “Time Out,” 10 “Balance Battle,” 11 “Diabetic Dog” 12 ) and mathematical models developed for educational or clinical purposes (eg, AIDA, 13 KADIS, 14 GlucoSim 15 ). Unfortunately, most games focus on children or young adults and are therefore not suitable for adults. Also, none of the games or models are meant for type 2 patients. Moreover, they generally cannot be individualized to account for the large inter- and intrapatient variability in glucose and insulin responses to meals, resulting from the heterogeneity amongst diabetes patients.16,17
Our goal is to create an educational simulator, called the Eindhoven Diabetes Education Simulator (E-DES), that can be individualized to account for heterogeneity. The basis of the simulator is a physiology-based mathematical model that calculates glucose and insulin values during a 24-hour period. The simulator should function for both type 1 and type 2 diabetes patients.
This article describes the first step in developing E-DES: the development and verification of the mathematical model for healthy subjects. The model is created by adjusting and combining different models from literature. We estimate the parameters for healthy persons based on oral glucose tolerance test (OGTT) data from literature and verify the resulting model parameters on separate literature data sets, testing the capability of our model to describe and predict heterogeneous data. We aim for an accuracy such that 95% of the glucose data used for verification lie within a range of ±20% around the results of the model simulation. This range corresponds with the allowed deviation in blood glucose meter measurements as defined in ISO15197:2003, 18 and with the observed glucose variability in healthy patients.
Methods
Model Development
The physiological model (shown in Figure 1) consists of 4 compartments: the gut, the plasma, the interstitial fluid, and the subcutaneous tissue. For every compartment we calculate the dynamic in- and outflow of glucose, insulin, or both using (coupled) differential equations.
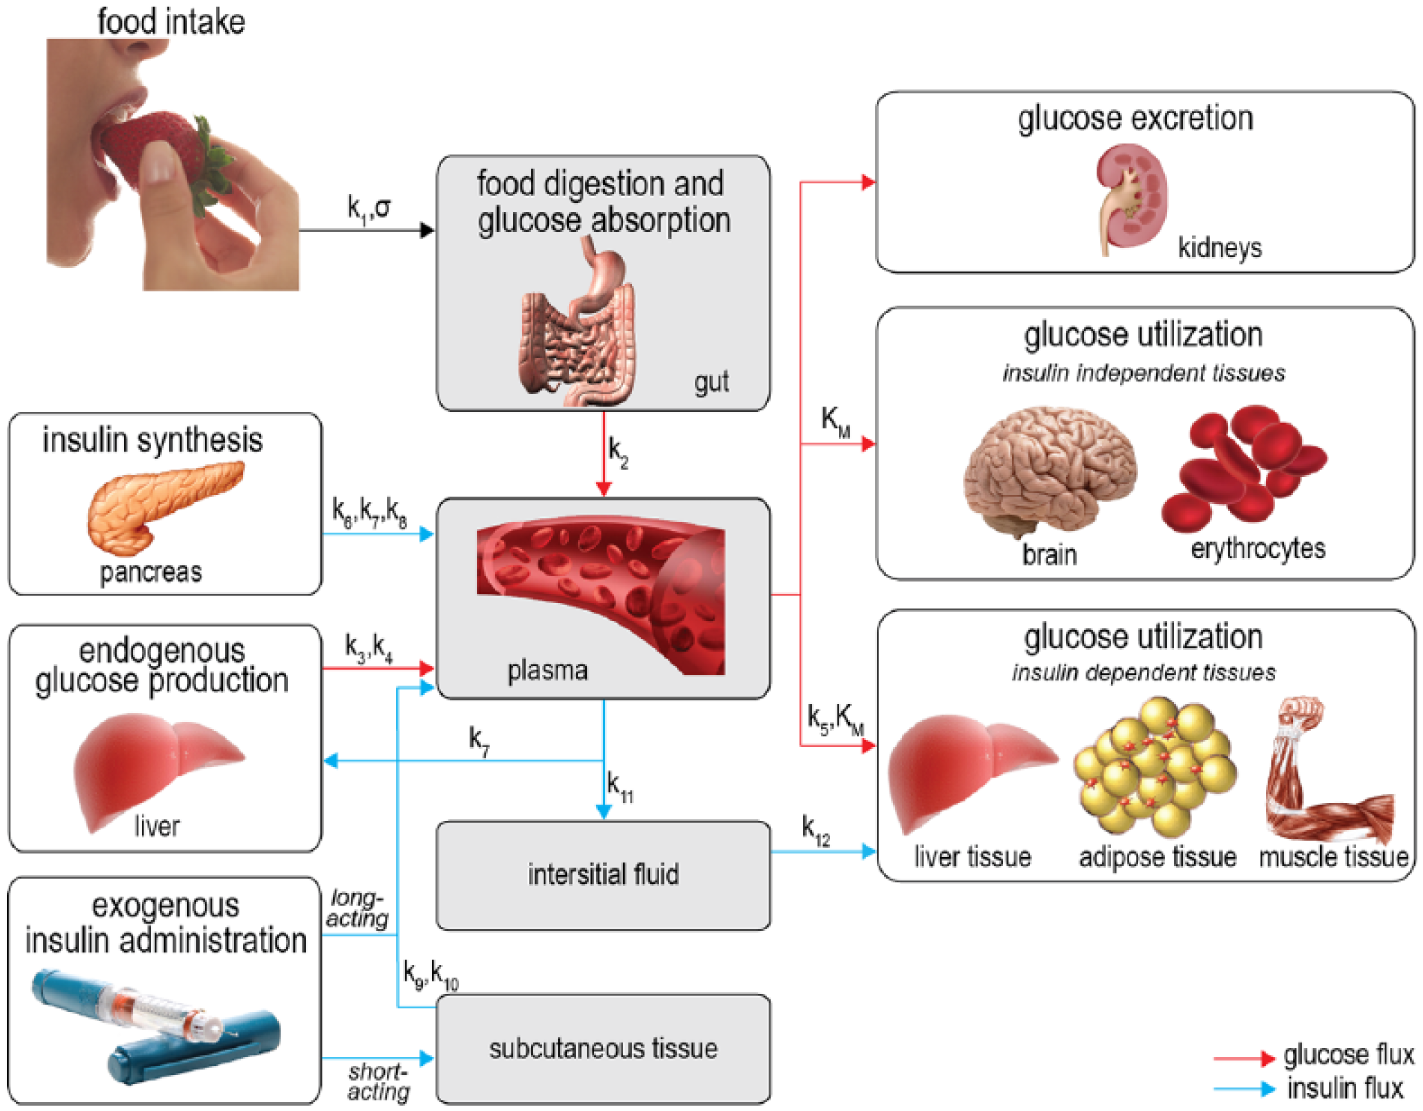
Schematic representation of the model. The gray areas show the 4 compartments used in the model. Red arrows denote glucose fluxes, blue arrows denote insulin fluxes. The parameters governing the fluxes are written above the arrows.
For the gut compartment we only consider glucose balances and assume insulin is not present. The glucose balance in the gut is described in 2 terms: glucose entering the gut from the stomach and glucose leaving the gut through uptake by the plasma. For glucose entering the gut we use the gastric emptying model by Elashoff et al. 19 Glucose uptake by the plasma is modeled linearly: the rate of glucose leaving the gut is proportional to the glucose mass in the gut.
For the plasma compartment we calculate both glucose and insulin fluxes. The glucose balance in plasma is modeled using 5 terms: glucose entering from the gut, glucose entering from endogenous production in the liver, glucose leaving the plasma through uptake by insulin-independent and by insulin-dependent tissue and organs, and glucose leaving the plasma through renal clearance. The glucose entering from the gut is equal to the glucose uptake by the plasma described in the previous paragraph. The model for endogenous glucose production is derived from Dalla Man et al. 20 It consists of a basal production term which is reduced if either the plasma glucose concentration or the interstitial fluid insulin concentration is high. The combined insulin-dependent and insulin-independent glucose uptake follows Michaelis–Menten kinetics and is based on Gottesman et al 21 and Dalla Man et al. 22 Glucose excretion by the kidneys is modeled using the renal clearance model from Rave et al 23 and Lehmann et al. 24
The insulin balance in plasma is composed of 5 terms: inflow from the pancreas, inflow from both short-acting and long-acting insulin injections, outflow through liver clearance, and outflow toward the interstitial fluid. Insulin release by the pancreas is modeled with a proportional-integral-derivative controller similar to the one introduced by Steil et al. 25 We added a constant term to model insulin release in the basal state. Short-acting exogenous insulin inflow is equal to the insulin outflow from the subcutaneous compartment. Long-acting exogenous insulin enters the plasma through a time-dependent function, as modeled by Berger et al. 26 Insulin clearance by the liver is modeled by a clearance rate proportional to the plasma insulin concentration. Insulin outflow toward the interstitial fluid is modeled by diffusion proportional to the plasma insulin concentration minus the basal concentration.
In the interstitial fluid compartment, we calculate the in- and outflow of insulin. The insulin inflow is equal to the insulin outflow from the plasma. The amount of insulin used by cells is proportional to the interstitial fluid insulin concentration.
In the subcutaneous tissue compartment, insulin enters from short-acting insulin injections, and is taken up by the plasma through 2 coupled differential equations that create a delay between injection time and uptake, as modeled by Shimoda et al. 27
The model we created can describe the dynamics of the glucose metabolism of healthy persons, diabetes type 1 patients, and diabetes type 2 patients by adjusting the values of the physiological parameters. For instance, for type 1 patients the parameters governing β-cell insulin production will be zero. In the same way the parameter values describing insulin sensitivity will be higher in healthy persons and type 1 patients than in type 2 patients, who generally suffer from insulin resistance. Table 1 shows all model parameters, including the values for healthy persons determined in this article and an indication of which parameters are adjusted to create every phenotype. The complete model is given in the appendix.
Overview of All Model Parameters.
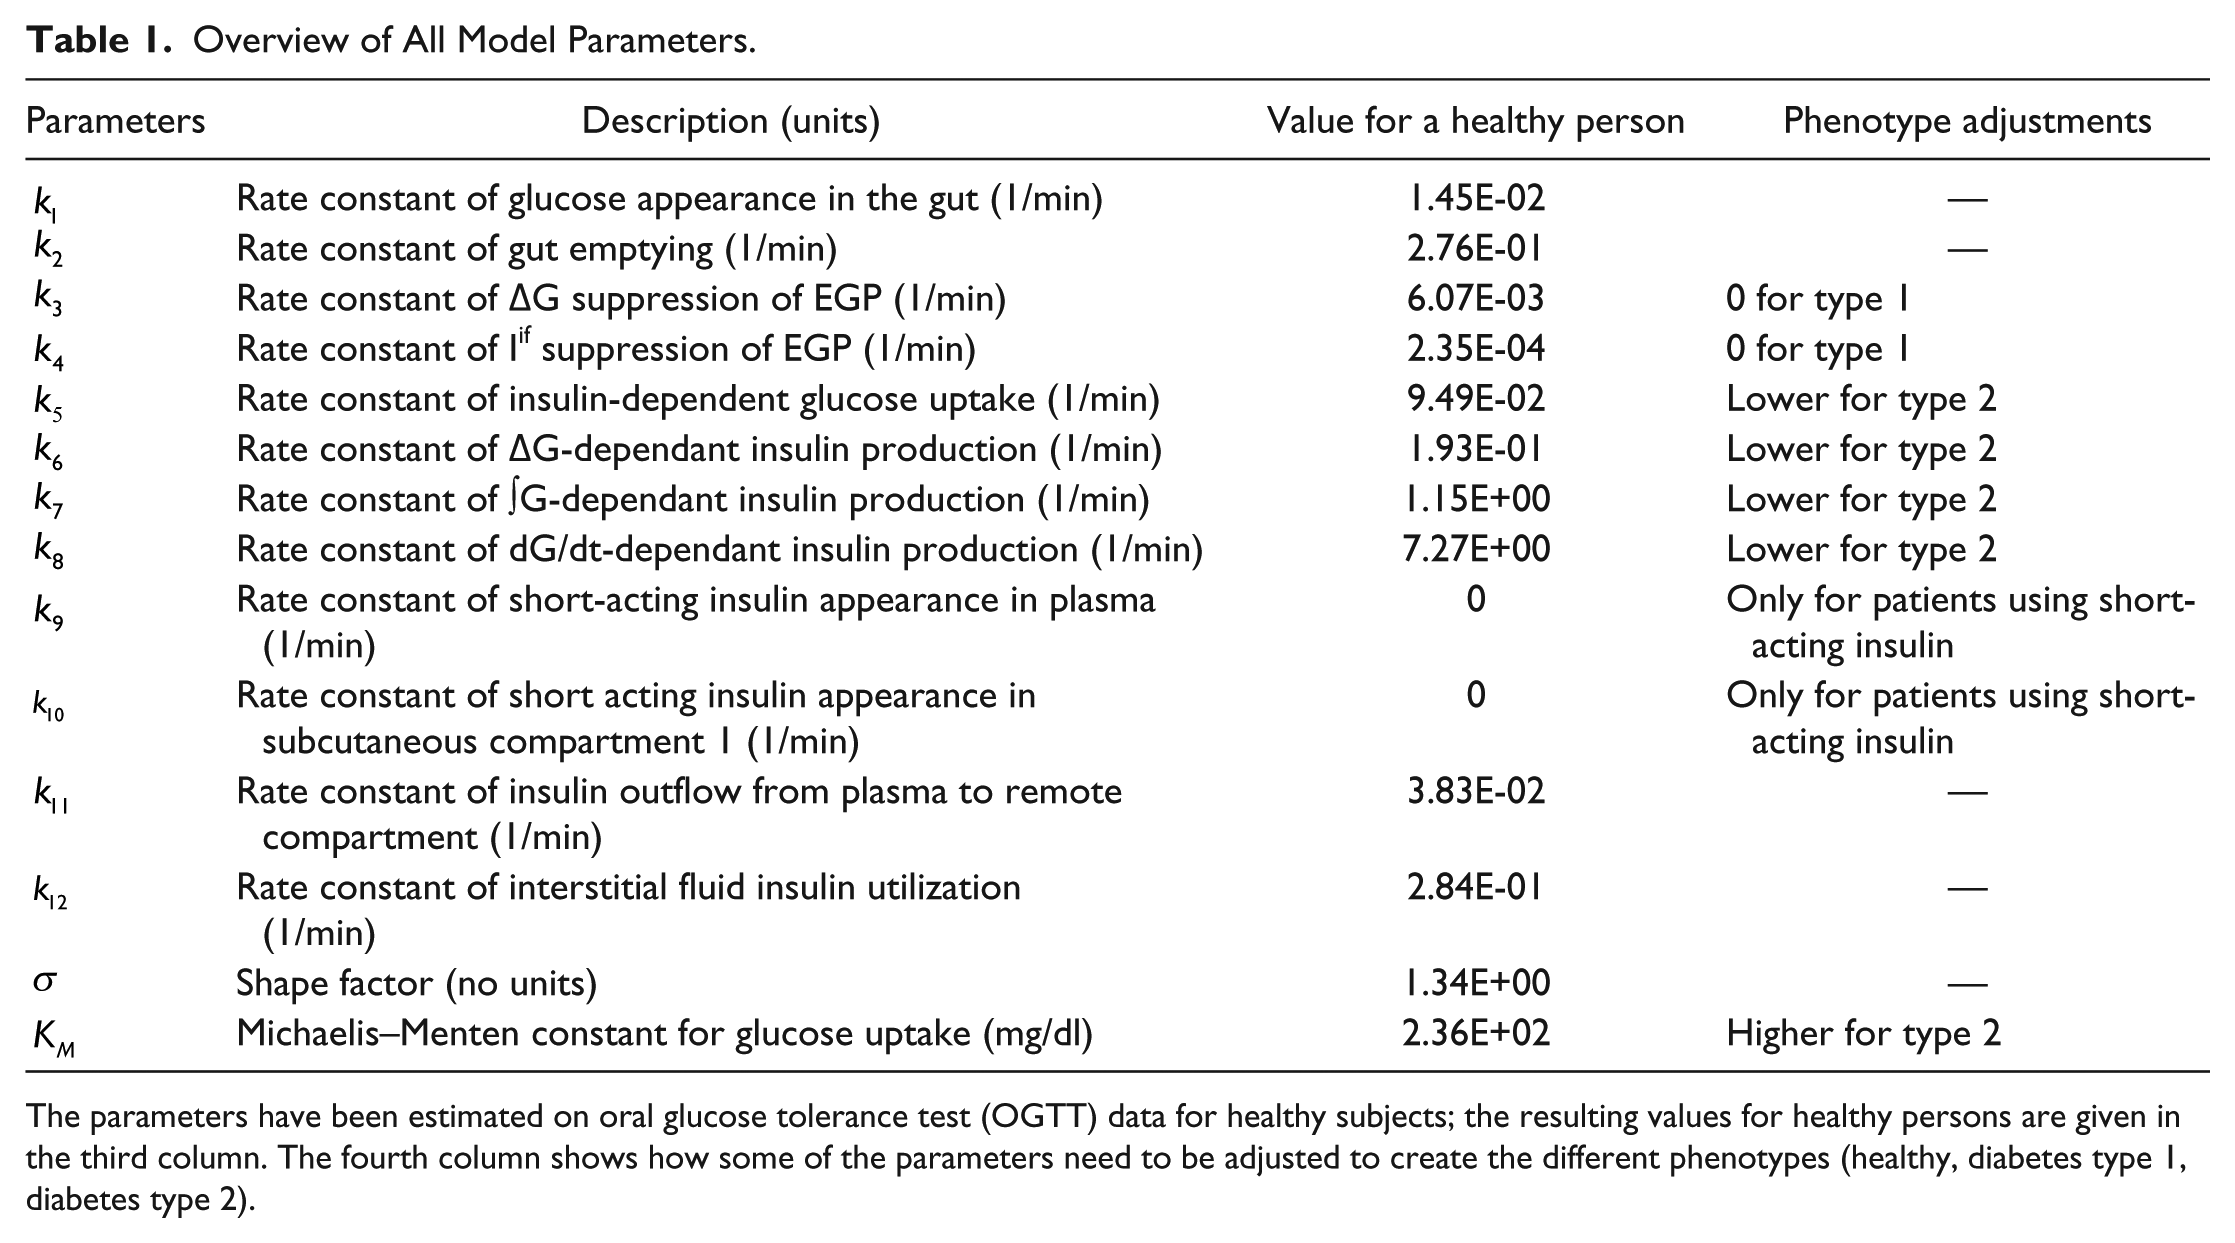
The parameters have been estimated on oral glucose tolerance test (OGTT) data for healthy subjects; the resulting values for healthy persons are given in the third column. The fourth column shows how some of the parameters need to be adjusted to create the different phenotypes (healthy, diabetes type 1, diabetes type 2).
Data Collection
The model parameters for healthy subjects were estimated using OGTT data from literature. For verification, a separate set of OGTT data was used. We performed a search in PubMed using the terms “OGTT,” “glucose,” and “healthy.” A data set was included if it contained more than 4 measurements in time of both glucose and insulin concentrations and if the included subjects satisfied the following inclusion criteria:
- Normal glucose tolerant: fasting glucose <100 mg/dl, peak glucose during OGTT <200 mg/dl, 2h glucose during OGTT <140 mg/dl 28
- Normal insulin sensitive: fasting insulin <15 μU/ml, peak insulin during OGTT <100 μU/ml, 2h insulin during OGTT <50 μU/ml 29
- Normotensive: systolic blood pressure <120 mmHg, diastolic blood pressure <80 mmHg 30
- HbA1c <6,5% (48 mmol/mol) 31
- BMI <30 kg/m2 (<27.5 kg/m2 for Asian and Pacific populations)32,33
The criteria follow the current guidelines of each respective measurement. They ensure that subjects included in the study were not only normal glucose tolerant, but also did not have any other condition that would influence glucose metabolism, like severe obesity.
OGTT data of tests with either 50 or 75 grams of glucose were included. We obtained 20 data sets adhering to our criteria. These sets were divided in 2 groups: 1 for parameter estimation and 1 for verification. Data sets of 75 grams of glucose and an average time between data points of less than 25 minutes (12 sets, 226 subjects34 -44) were used for parameter estimation, which ensures that the data are well spread over the time window, a necessity for model calibration. The remaining data sets (8 sets, 229 subjects45 -52) were used for verification. Table 2 (parameter estimation data) and Table 3 (verification data) give the main features of the included data sets.
Overview of Included Oral Glucose Tolerance Test (OGTT) Data Used for Parameter Estimation.
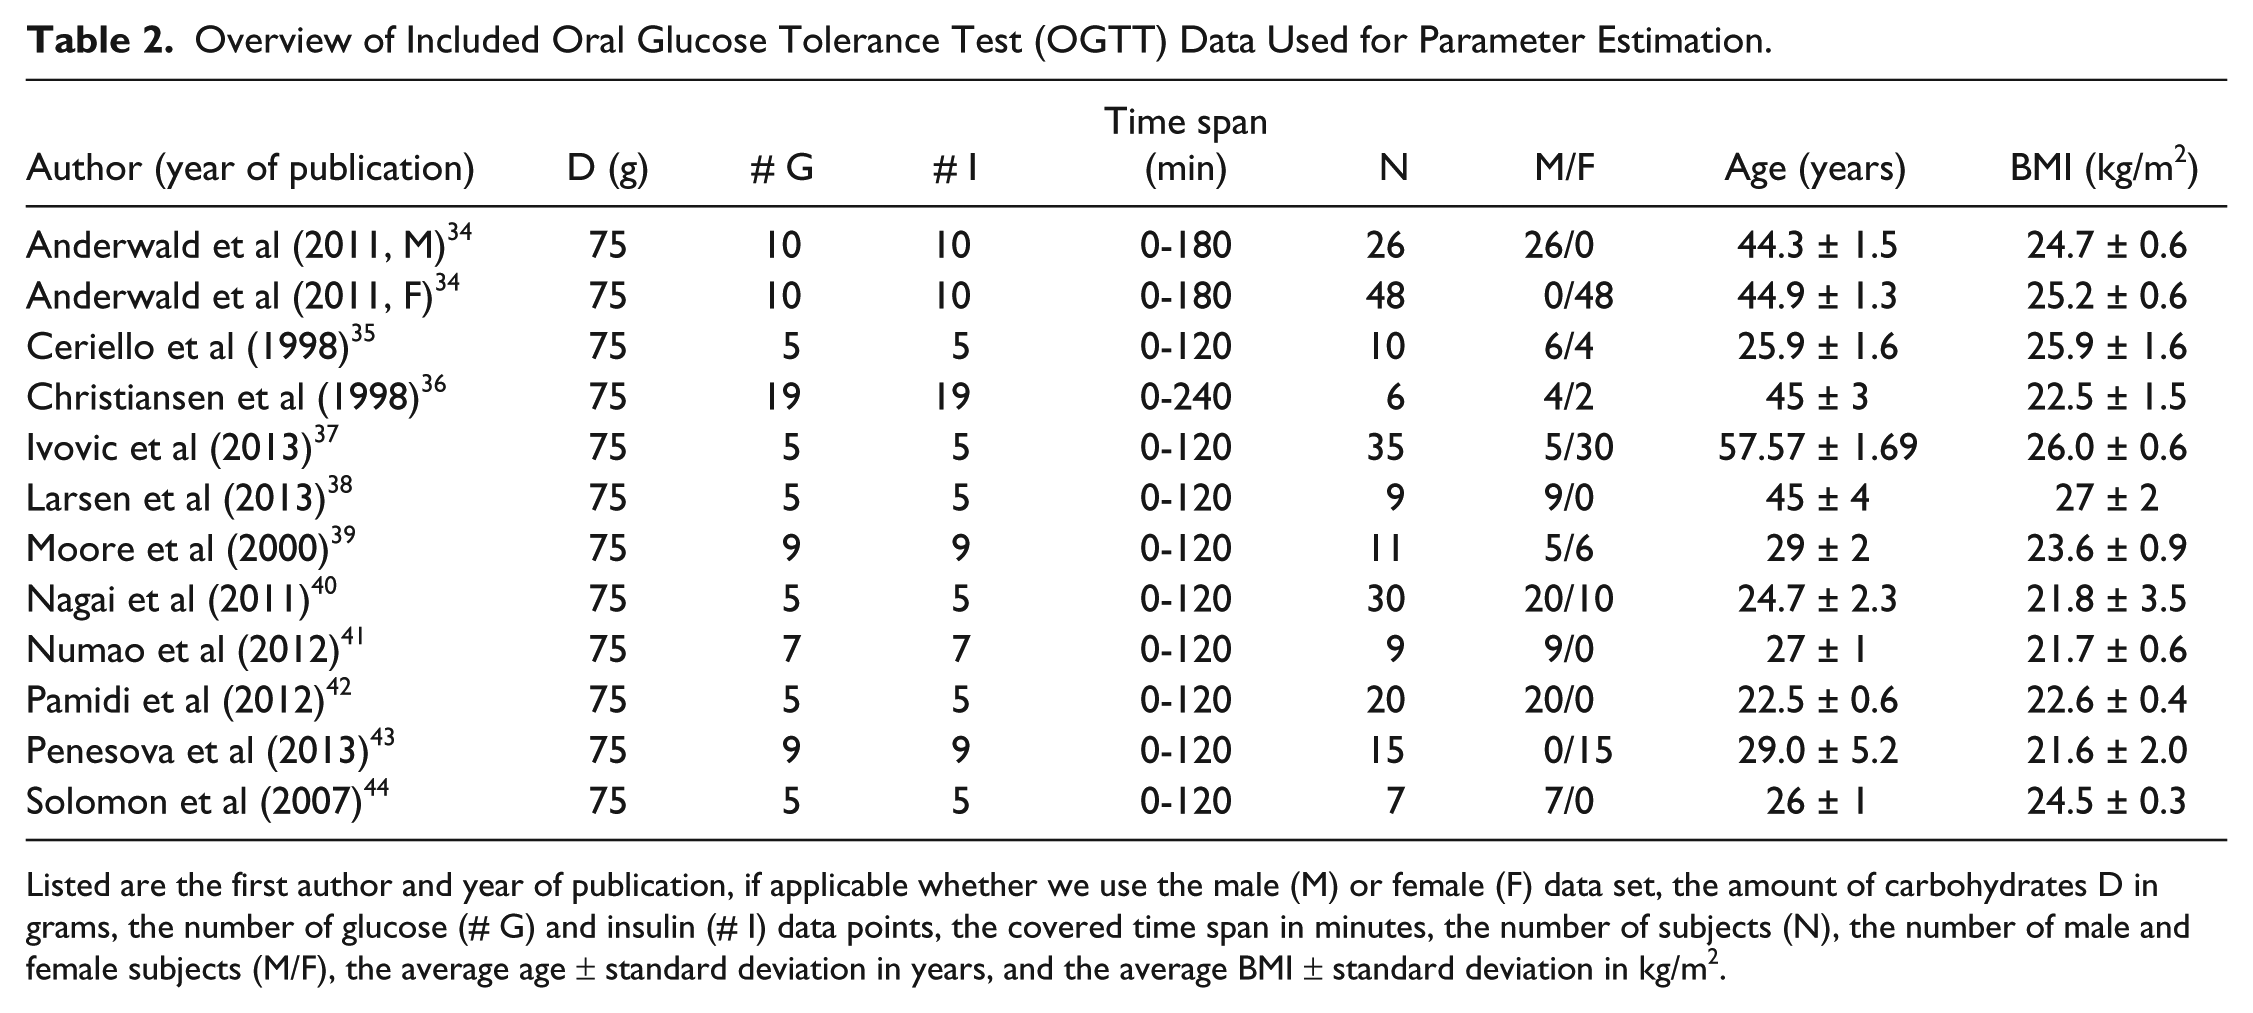
Listed are the first author and year of publication, if applicable whether we use the male (M) or female (F) data set, the amount of carbohydrates D in grams, the number of glucose (# G) and insulin (# I) data points, the covered time span in minutes, the number of subjects (N), the number of male and female subjects (M/F), the average age ± standard deviation in years, and the average BMI ± standard deviation in kg/m2.
Overview of Included Oral Glucose Tolerance Test (OGTT) Data Used for Verification.
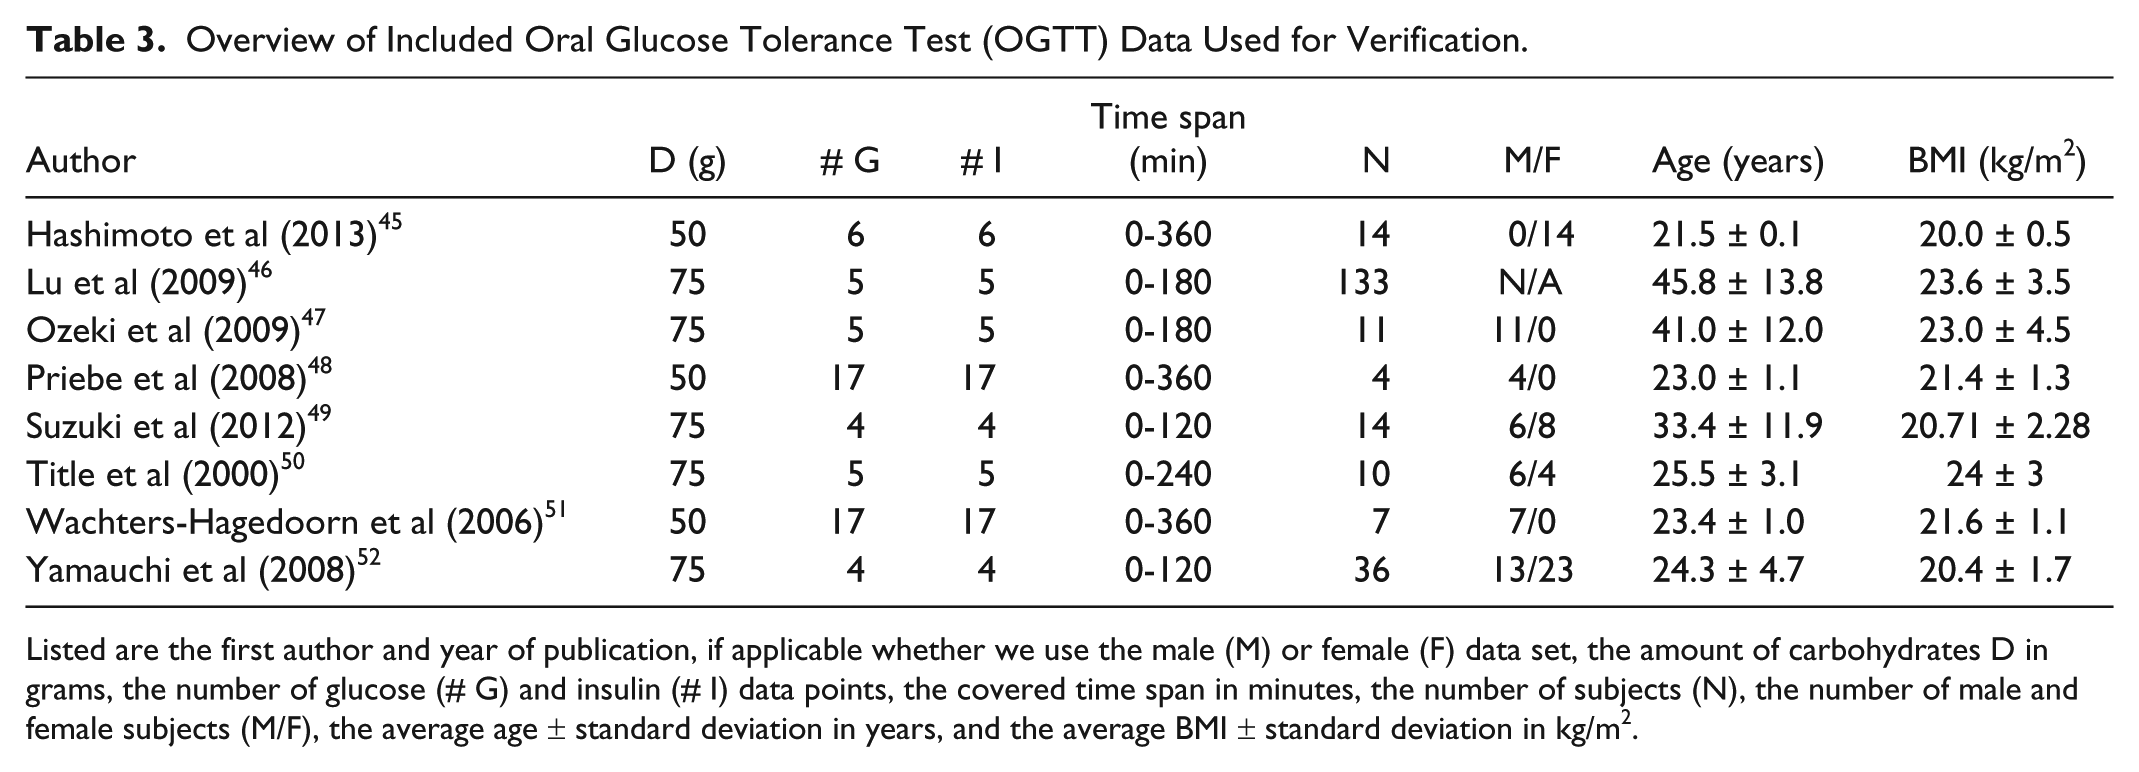
Listed are the first author and year of publication, if applicable whether we use the male (M) or female (F) data set, the amount of carbohydrates D in grams, the number of glucose (# G) and insulin (# I) data points, the covered time span in minutes, the number of subjects (N), the number of male and female subjects (M/F), the average age ± standard deviation in years, and the average BMI ± standard deviation in kg/m2.
Parameter Estimation and Verification
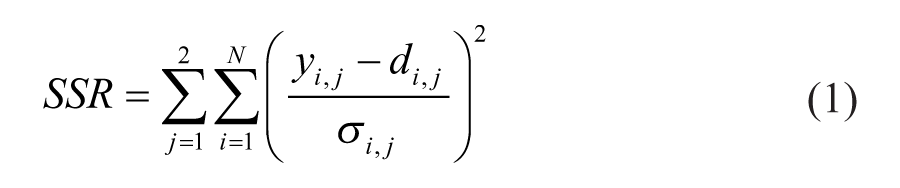
The model was implemented in MATLAB and Optimization Toolbox Release 2010b (The Mathworks Inc, Natick, MA). To solve the coupled differential equations the ode15s solver for stiff systems was used. Parameter estimation was performed based on Maximum Likelihood Estimation principles by optimizing the objective function given in Equation 1 such that the weighted sum of squared residuals (SSR) became smallest. 53 N represents the number of measurements, di,j the experimental data of observable j (either 1=glucose or 2=insulin), σi,j the standard deviation of the experimental data of observable j, and yi,j the corresponding model output as predicted by the current parameter set. For this optimization we used the lsqnonlin algorithm.
We optimized the parameters simultaneously on all parameter estimation data sets. To improve the chances of finding the global minimum of the optimization problem we repeated the optimization for 1000 initial parameter sets, which were obtained by performing Latin Hypercube Sampling for each parameter. 54 The set with the lowest SSR, calculated on both glucose and insulin data, is used as the resulting healthy parameter set.
Verification of our model and healthy parameter set is performed by comparing our model predictions with the verification data. For each verification data set, simulation is performed using the glucose and insulin starting values and carbohydrate input of that specific data set. We consider our model prediction acceptable, and our model verified, if 95% of the glucose data points lie within a range of ±20% around the corresponding model prediction. This acceptance range corresponds with the accuracy criteria for blood glucose meters given in ISO15197:2003. 18 For glucose concentrations below 75 mg/dl the model is not allowed to predict higher values, because identifying and understanding conditions that might lead to hypoglycemia is important in diabetes education. For insulin we choose a wider acceptance range of ±25%, consistent with the larger variability in insulin measurements observed in literature. 55
Results
First, we estimated the parameter values on the 12 parameter estimation data sets. Figure 2 shows the different data sets used for parameter estimation (markers), the standard deviation of the data as reported in the original articles (error bars), and the resulting optimal model prediction (thick solid line). Both the glucose and insulin data show large variation; in some cases more than 50%. The model prediction falls in the middle of the range of data sets and follows the trend of the data sets well. Table 1 lists the estimated parameter values.
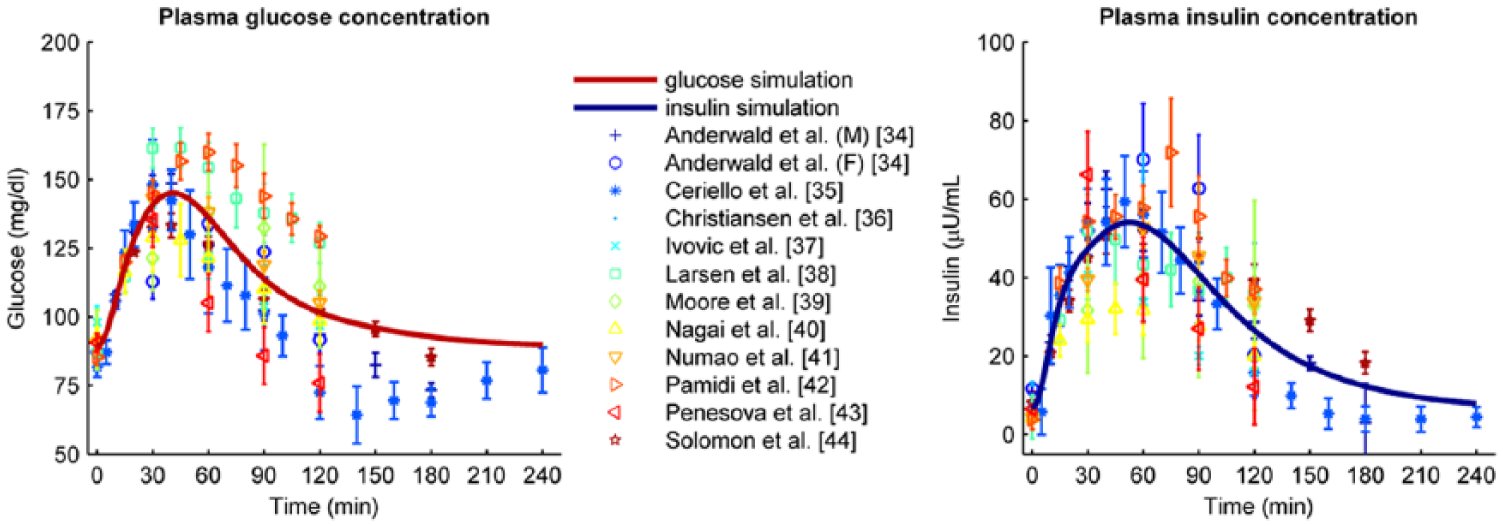
Parameter estimation data sets (markers and error bars representing mean values and standard deviations, respectively) combined with the optimal model determined by parameter estimation (solid line). The left graph shows the glucose data and model; the right graph shows the insulin data and model.
Next, we verified the healthy parameter values on 8 verification data sets. Figure 3A shows the best predicted case (Ozeki et al 47 ); for this verification set, all glucose and insulin data points were within the acceptance range. Figure 3B shows the worst predicted case (Lu et al 46 ). Here all insulin data were in range, but 1 glucose data point was not. However, the difference between model and data was small. Figure 4 shows the percentage of data points within the acceptance range for each verification data set. For all verification data sets 100% of the glucose data lie within range, except for the data from Lu, where 1 data point is just outside range. The percentage of insulin data points within range varies from 100% (Lu et al, 46 Ozeki et al, 47 and Suzuki et al 49 ) to 40% (Hashimoto et al 45 ).
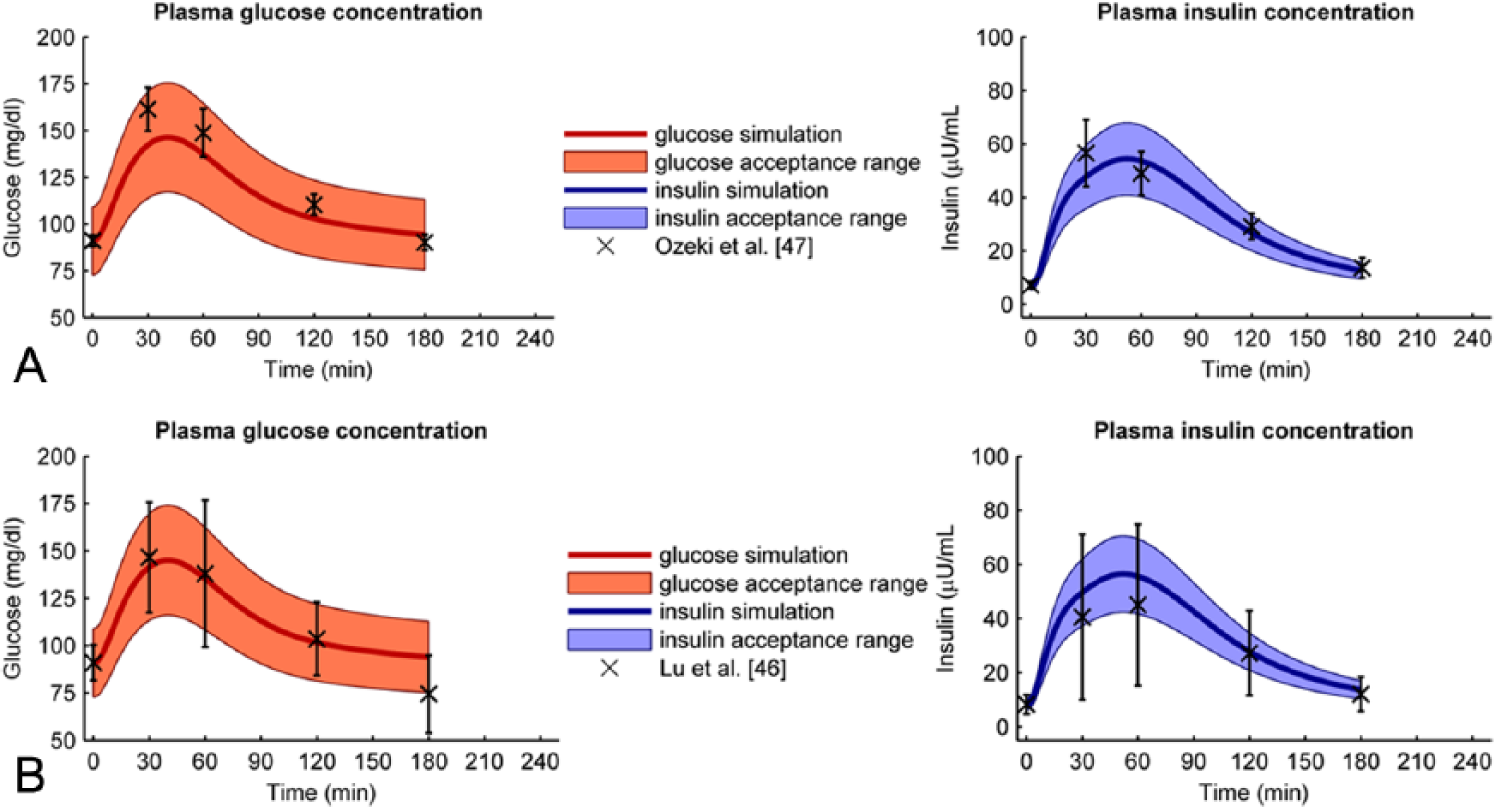
(A) Best fitted verification data set. The data from Ozeki et al 47 (crosses and error bars) are well predicted by the optimal model (solid line) since all data points lie within the acceptance range (filled area). The left graph shows the glucose data and model + acceptance range, the right graph shows the insulin data and model + acceptance range. (B) Worst fitted verification data set. Although the trend of the glucose data from Lu et al16 is predicted well (solid line), one glucose data point (crosses and errorbars) lies just outside the acceptable range (filled area). All insulin data points do lie within the acceptable range. The left graph shows the glucose data and model + acceptance range, the right graph shows the insulin data and model + acceptance range.
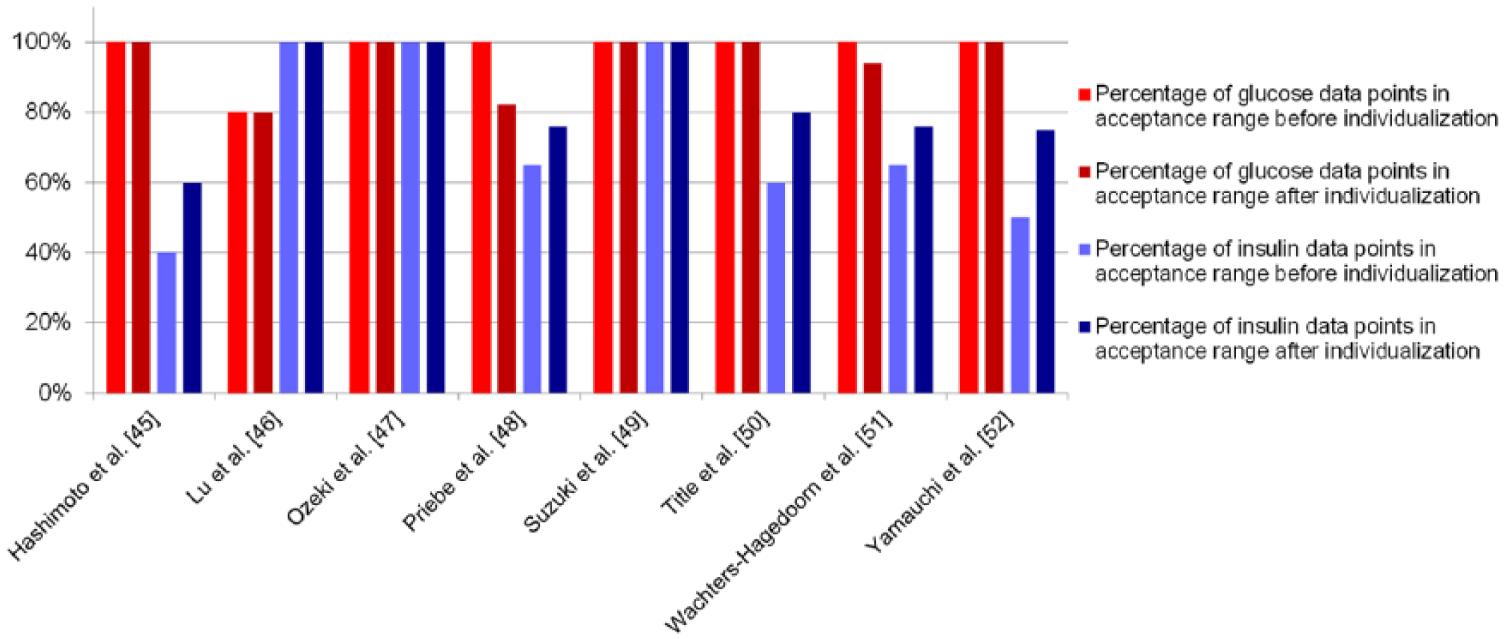
Percentage of data points within the acceptance range, listed per verification data set. The red bars show the percentage of glucose data points within range before (light red) and after (dark red) individualization; the blue bars show the percentage of insulin data points before (light blue) and after (dark blue) individualization.
Last, although all verification data sets were described well by our model, we tested if we could individualize the model by fine-tuning only a small set of parameters. The parameters chosen to reestimate were k5, k6, k7, and k8. These parameters are associated with the insulin resistance and β-cell function of the subject, 2 processes that largely define the pathophysiology of diabetes type 2. A multiparametric sensitivity analysis has shown that these parameters are also the most sensitive to change (data available on request). We reestimated the 4 chosen parameters on the individual data sets while keeping all other parameters constant. Figure 4 shows the percentage of glucose and insulin data points within range before and after individualization. The percentage of insulin data points inside the acceptance range is higher after individualization than before for all verification data sets. However, the percentage of glucose data points within range goes down for 2 studies (Priebe et al, 48 Wachters-Hagedoorn et al 51 ).
Discussion
We have shown that our model can predict glucose and insulin profiles for healthy persons. Of the glucose data points, 98.4% were within range, meaning we achieved our goal of >95% of all glucose data within ± 20% of our model predictions. Our model performed less well when predicting insulin profiles. However, we consider the glucose data to be most important for daily practice, since patients can only measure blood glucose and adjust their insulin based on these measurements. Although insulin predictions can provide patients insight, they are of limited clinical importance.
Nevertheless, the insulin predictions showed only small deviations from the data. In the cases where some of the insulin data points fall outside the acceptance range, the trend is nevertheless still described well. Changing only 4 parameters strongly improved the insulin predictions. This shows that our model is sensitive to its parameters and has possibilities for individualization.
Several other models of the human glucose-insulin system exist.22,26,56-59 Some are simpler than our model, others more detailed. Analysis of the model accuracy is often limited and usually only the capability of a model to fit the training data is reported. This is partly because data often do not provide sufficient information to constrain all model parameters. We aimed for a limited number of parameters that largely define the dynamic response. Uncertainty analysis via the Profile Likelihood method 60 shows that most of our parameters can be estimated with a finite, relatively small confidence interval (results available on request). We further analyzed the accuracy of our model by investigating the uncertainty and variability in the predictions for the verification data sets. The model is able to predict the verification sets well, which speaks strongly for the robustness and predictive power of our model.
The main part of our model is based on Dalla Man et al.20,22 We reduced the number of differential equations from 12 to 6, including 2 differential equations necessary for the short-acting insulin injection model (not present in the model by Dalla Man et al). This simplification was possible by reducing food intake to only 1 differential equation instead of 3 by using the gastric emptying model by Elashoff et al. 19 We simplified the endogenous glucose production model of Dalla Man et al by removing the early suppression term, thus removing 1 more parameter to be fitted. This caused a systematic error of approximately 0.5% on the plasma glucose levels, which we deemed negligible. We made the insulin-independent glucose uptake term dependent on glucose (instead of being constant). This ensured glucose uptake becomes zero if the glucose concentration is zero, preventing a nonphysiological situation where the glucose concentration could become negative. The liver insulin and portal vein insulin concentrations were combined into 1 plasma concentration. We compensated for this by implementing a term that models the removal of insulin by the liver. Our verification proves that our model, although heavily simplified, is still accurate enough for our purposes. Through this simplification, the model is easier to understand for both patients and physicians and requires less computational resources.
In this article, we show the capability of our model to predict the outcomes of averaged OGTT data for 455 healthy subjects from 19 publications in literature (data available on request). All included publications described their subjects as “healthy”; nevertheless the data are heterogeneous, and the variance in glucose and insulin profiles is quite large (Figure 2). Part of the variance in insulin profiles might stem from the fact that insulin immunoassays have not been standardized.55,61 But for glucose assays, which are standardized, this cannot explain the large variability observed. We can only conclude that the variance in glucose and insulin profiles is caused by factors that were not measured, for instance by effects of stress, exercise or food taken in the day before.
The dynamic response of insulin and glucose to (complex) meals will show even larger variability. In meals the stomach has to process complex carbohydrates, proteins, and fats in liquid and solid form; not only liquid glucose solution. This will slow down the process of glucose uptake considerably, depending on the content and form of the meal. 62 The parameters estimated from OGTT data will not be able to predict composite meals. In future work we will therefore extend the part of the model concerning food absorption and reestimate the involved parameters on mixed meal data to resemble postprandial responses in everyday life more closely.
Our next step will be to estimate parameters for patients with diabetes type 1 and type 2. We expect that factors such as age, BMI, total daily insulin dose, and duration of diabetes will have a strong correlation with certain parameters in the model. Our aim is to use these correlations to let users adjust the model to their own individual characteristics. As a final step, we will include the model in an attractive user interface, so that it can be used by patients and health care providers for educational purposes.
Conclusion
We have designed a model to predict glucose and insulin profiles over time. The model will be used in a simulator providing individualized education for patients with diabetes. As a first step, we verified our model for healthy subjects. We calculated glucose and insulin predictions for 8 separate data sets and showed that all glucose data points except 1 were within the acceptance range of ±20%, thus proving our model verified. By adjusting the parameters influencing insulin resistance and β-cell function we could change the glucose and insulin response, showing the possibilities of our model for individualization including application for type 2 diabetics that have varying levels of insulin resistance and β-cell function.
Footnotes
Appendix
Abbreviations
E-DES, Eindhoven Diabetes Educational Simulator; HbA1c, glycated hemoglobin; OGTT, oral glucose tolerance test.
Declaration of Conflicting Interests
The author(s) declared no potential conflicts of interest with respect to the research, authorship, and/or publication of this article.
Funding
The author(s) disclosed receipt of the following financial support for the research, authorship, and/or publication of this article: This work was supported by Novo Nordisk.