
Abstract
Background:
Insulin is a top source of adverse drug events in the hospital, and glycemic control is a focus of improvement efforts across the country. Yet, the majority of hospitals have no data to gauge their performance on glycemic control, hypoglycemia rates, or hypoglycemic management. Current tools to outsource glucometrics reports are limited in availability or function.
Methods:
Society of Hospital Medicine (SHM) faculty designed and implemented a web-based data and reporting center that calculates glucometrics on blood glucose data files securely uploaded by users. Unit labels, care type (critical care, non–critical care), and unit type (eg, medical, surgical, mixed, pediatrics) are defined on upload allowing for robust, flexible reporting. Reports for any date range, care type, unit type, or any combination of units are available on demand for review or downloading into a variety of file formats. Four reports with supporting graphics depict glycemic control, hypoglycemia, and hypoglycemia management by patient day or patient stay. Benchmarking and performance ranking reports are generated periodically for all hospitals in the database.
Results:
In all, 76 hospitals have uploaded at least 12 months of data for non–critical care areas and 67 sites have uploaded critical care data. Critical care benchmarking reveals wide variability in performance. Some hospitals achieve top quartile performance in both glycemic control and hypoglycemia parameters.
Conclusions:
This new web-based glucometrics data and reporting tool allows hospitals to track their performance with a flexible reporting system, and provides them with external benchmarking. Tools like this help to establish standardized glucometrics and performance standards.
Keywords
One in 4 hospitalized adult patients has diabetes, and many more have hyperglycemia without a preexisting diagnosis. 1 Uncontrolled hyperglycemia and iatrogenic hypoglycemia represent common quality and safety issues associated with a broad range of adverse outcomes,2 -4 and insulin is one of the most common sources of inpatient adverse drug events.2,5,6 Professional societies and standards organizations have highlighted the importance of optimizing inpatient glycemic control and reducing hypoglycemia.2,3,4,7 -9 Many medical centers are addressing inpatient glycemic control via the Surgical Care Improvement Program, 10 advanced certification programs from the Joint Commission, 7 the Partnership for Patients efforts, 11 and many other programs.12,13
“You can’t improve what you can’t measure” is an adage that illustrates the dilemma facing improvement teams attempting to optimize glycemic control. Any effort to improve the quality of medical care faces the hurdles of defining the metrics, compiling the data, and developing a system to calculate and distribute reports. For glycemic control metrics (aka “glucometrics”),13,14 this task is particularly daunting. The sheer volume of data, the complexity of multiple calculations, lack of glucometric standardization, and limited resources to carry out these functions all pose challenges. As a result, many (if not most) institutions implement insulin protocols, hypoglycemia management protocols, and other interventions with marginal or no methods to gauge the impact of their efforts. Even for those that succeed in tracking their own performance, a lack of standardization and benchmarking makes comparisons with other medical centers problematic.
The glucometrics barrier posed a problem for the Society of Hospital Medicine (SHM) as they enrolled over 100 hospitals in their Glycemic Control Mentored Implementation (GCMI) program since 2009.12,13 The goals of this Mentored Implementation (MI) program are 2-fold:
Establish programs and processes to improve inpatient glycemic control and reduce hypoglycemia
Develop skills and leaders in quality improvement in hospitals, especially among hospitalists
Details of the program are published elsewhere, 12 but briefly, the GCMI program offers longitudinal coaching from a content and improvement expert (aka mentor), featuring an array of web based and print resources8,9,12,15 -20 that address the design and implementation of protocols, order sets, and strategies to optimize inpatient glycemic control.
The SHM Glycemic Control Task Force published practical recommendations 15 for assessing the impact of glycemic control efforts and glucometrics previously, drawing on the expertise of the task force,21 -24 as well as the groundbreaking work from Yale.25,26 Sites enrolled in the SHM GCMI program often had a very limited capacity to assess hyper- or hypoglycemia rates as recommended however, and this deficit was the rate limiting step to improvement. We set out to build a comprehensive web-based data and reporting center to allow institutions to assess their baseline glucometrics and the impact of their improvement efforts, and allow for comparison of their performance with others.
Methods and Description of the Reporting Engine Design and Metrics
SHM partnered with a company specializing in data management (QuesGen Systems, Inc, Burlingame, CA) to create a secure online glycemic control data registry and reporting engine. All glucometric methods were modeled at the University of California, San Diego, and then replicated with duplicate data sets at QuesGen, to validate all calculations and refine the interface. To more fully support the SHM GCMI program, the data and reporting center (hereafter referred to simply as the Data Center) also hosts a community website for webinars, an active electronic community, peer groups for niche areas of glycemic control (eg, those who use the same electronic medical record, or those interested in different insulin infusion protocols), a Glycemic Control Implementation guide, and a wide variety of resources and tools.8,12,13
Uploading and “Scrubbing” the Data
Participating institutions classify their hospital by setting (academic, community teaching, community nonteaching, government, or other), region of the country, area (urban, suburban, or rural), and bed size. Only point-of-care blood glucose values are used for these glucometrics, as these are often stored as a discrete data set at each hospital. Data fields are uploaded in a comma separated values (.csv) file with the date and time of the blood glucose (BG) test, an identifier for the patient encounter, the BG result in mg/dL, and the testing location as a hospital unit. During the upload process, the data is deidentified while preserving internal validity to recognize the same patient across different uploads. The data file is encrypted en route, and stored on a secure server. To increase the ease of the data upload, multiple months and units can be uploaded at the same time. The first time a new unit is uploaded, a declaration of care type (critical care inpatient, non–critical care inpatient, other) and unit type (medical, surgical, mixed, psychiatric or behavioral, OB/GYN, orthopedics, pediatrics, other) is required. For subsequent uploads, the system recognizes all previously entered care and unit type classifications.
Patient inclusion criteria require at least 4 BG readings over a minimum of 2 consecutive days. There is no cutoff for prolonged hospital stays. The following data conditions for BG readings are either marked as errors and not included in analysis, or they are adjusted as follows: negative, empty, zero, or <10 mg/dL BG values are excluded; BG readings such as case-insensitive versions of “Hi,” “High,” or “H” are reset to 600 mg/dL; BG readings such as case-insensitive versions of “L,” “Low,” “Lo,” are reset to 20 mg/dL; BG readings with a “<” (less than symbol) to the left of their numeric component are decremented by 1 (eg, <20 is reset to 19); BG readings with a “>” (greater than symbol) to the left of their numeric component are incremented by 1 (eg, >300 is reset to 301); BG readings greater than 600 are adjusted to 600. The nature of any reset/adjusted BG data is retained in the uploaded record for potential future reference. Laboratory glucose measurements, diagnostic codes, service codes, and other patient-related data are not collected.
Description of Metrics
Physician experts involved with SHM’s GCMI program drew on their own experience, input from institutions enrolled in GCMI, prior SHM publications, the Yale glucometrics experience, and early published benchmarking studies15,25 -29 to devise a set of glucometrics. Glucometrics can be expressed using each BG test, each patient day, or each patient stay (ie, hospitalization) as a unit of analysis. We used both patient day and patient stay metrics, but decided not to use a BG test as a unit of analysis, since these are less clinically relevant and length of stay and frequency of testing could skew the results.
Glycemic exposure and glycemic control by patient day
Glycemic exposure for a population is expressed by the patient day mean for the population. A mean glucose value is calculated for each individual patient day (ie, the average readings taken for a single patient on a single day in the hospital). All individual patient day means for patients included in the query are then averaged to calculate the patient day mean for the population. The median of all patient day means is also calculated, as is the percentage of patient days with a mean glucose of ≥ 180 mg/dL.
Glycemic exposure and glycemic control by patient stay
The mean for a patient stay is the sum of the means for each patient day, divided by the number of monitored patient days (mean glucose for day 1 + mean glucose for day 2 + mean glucose for day 3 + mean glucose for day 4 / 4 days = a patient’s mean glucose for a 4-day hospitalization). This gives us a mean for each patient’s stay, based on the day-weighted methodology. A patient stay is defined by consecutive inpatient days for which at least 1 glucose reading is available for a patient on that unit. The percentage of patient stays with a mean glucose ≥ 180 mg/dL is also reported. Each hospital unit is characterized as either critical care or non–critical care so that patient stay summaries reported for critical care reflect only critical care days and the alternate being true for non–critical care patient stay summaries. In other words, critical care and non–critical care patient stay summaries are never unintentionally mixed in reports.
The percentage of readings in range is another patient stay marker of glycemic control. For each patient, the number of glucose readings in the desired 70-179 mg/dL range over their patient stay is divided by the total number of readings taken on that patient. For example, if a patient had 20 BG readings during their stay, and 16 of the readings were in the desirable range, the percentage in range would be calculated at 80%. The percentages for all patients in the query are then averaged to create a summary score.
Patient Safety and Hypoglycemia Management
Hypoglycemia rates are a good example of a prototypical “balancing measure” for teams attempting to achieve better glycemic control. Hypoglycemia (<70 mg/dL), severe hypoglycemia (<40 mg/dL), and recurrent hypoglycemia can all be viewed as important safety measures. We also consider severe hyperglycemia (>299 mg/dL) as a safety measure, given the known associations between severe hyperglycemia and adverse outcomes.2 -4,9
In a manner analogous to glycemic control measures, these safety measures can also be summarized by patient day or by patient stay. Because length of stay, frequency of testing, and increased testing around glycemic excursions are less likely to unduly influence patient day than patient stay results, we prefer to use the patient day measurement,14,15 but we present hypoglycemia and severe hypoglycemia by both methods.
In a feature unique to SHM glucometric reports, measures reflect the quality and timeliness of hypoglycemia management. Hypoglycemia management is often neither timely nor effective in preventing potentially avoidable recurrent hypoglycemic events.23,30,31 The mean/median times to repeat glucose testing or resolution after a hypoglycemic event, and percentage of hypoglycemic events with repeat testing or resolution within 15 minutes and 30 minutes are calculated from time interval data. We also calculate the percentage of patients with hypoglycemia who have 1 or more recurrent hypoglycemic days. Time intervals are capped at 240 minutes to prevent undue influence from outlier values, and values obtained within 10 minutes of the index hypoglycemic value are excluded, as they likely reflect reflexive repeat testing.
Constructing a Query, Generating, Saving, and Viewing the Reports
Authorized users at a given institution can construct a variety of reports for their own institution. Figure 1 depicts the menu for constructing queries. The reporting engine is designed to allow for maximum flexibility in creating the reports and ease of use. Any unit or group of units, for any time range can be chosen for analysis. Run charts and graphics of selected metrics are presented along with the tabular data. For all reports, the data can be saved in a variety of formats (.pdf, .csv, .xl, .xls) for the end user.
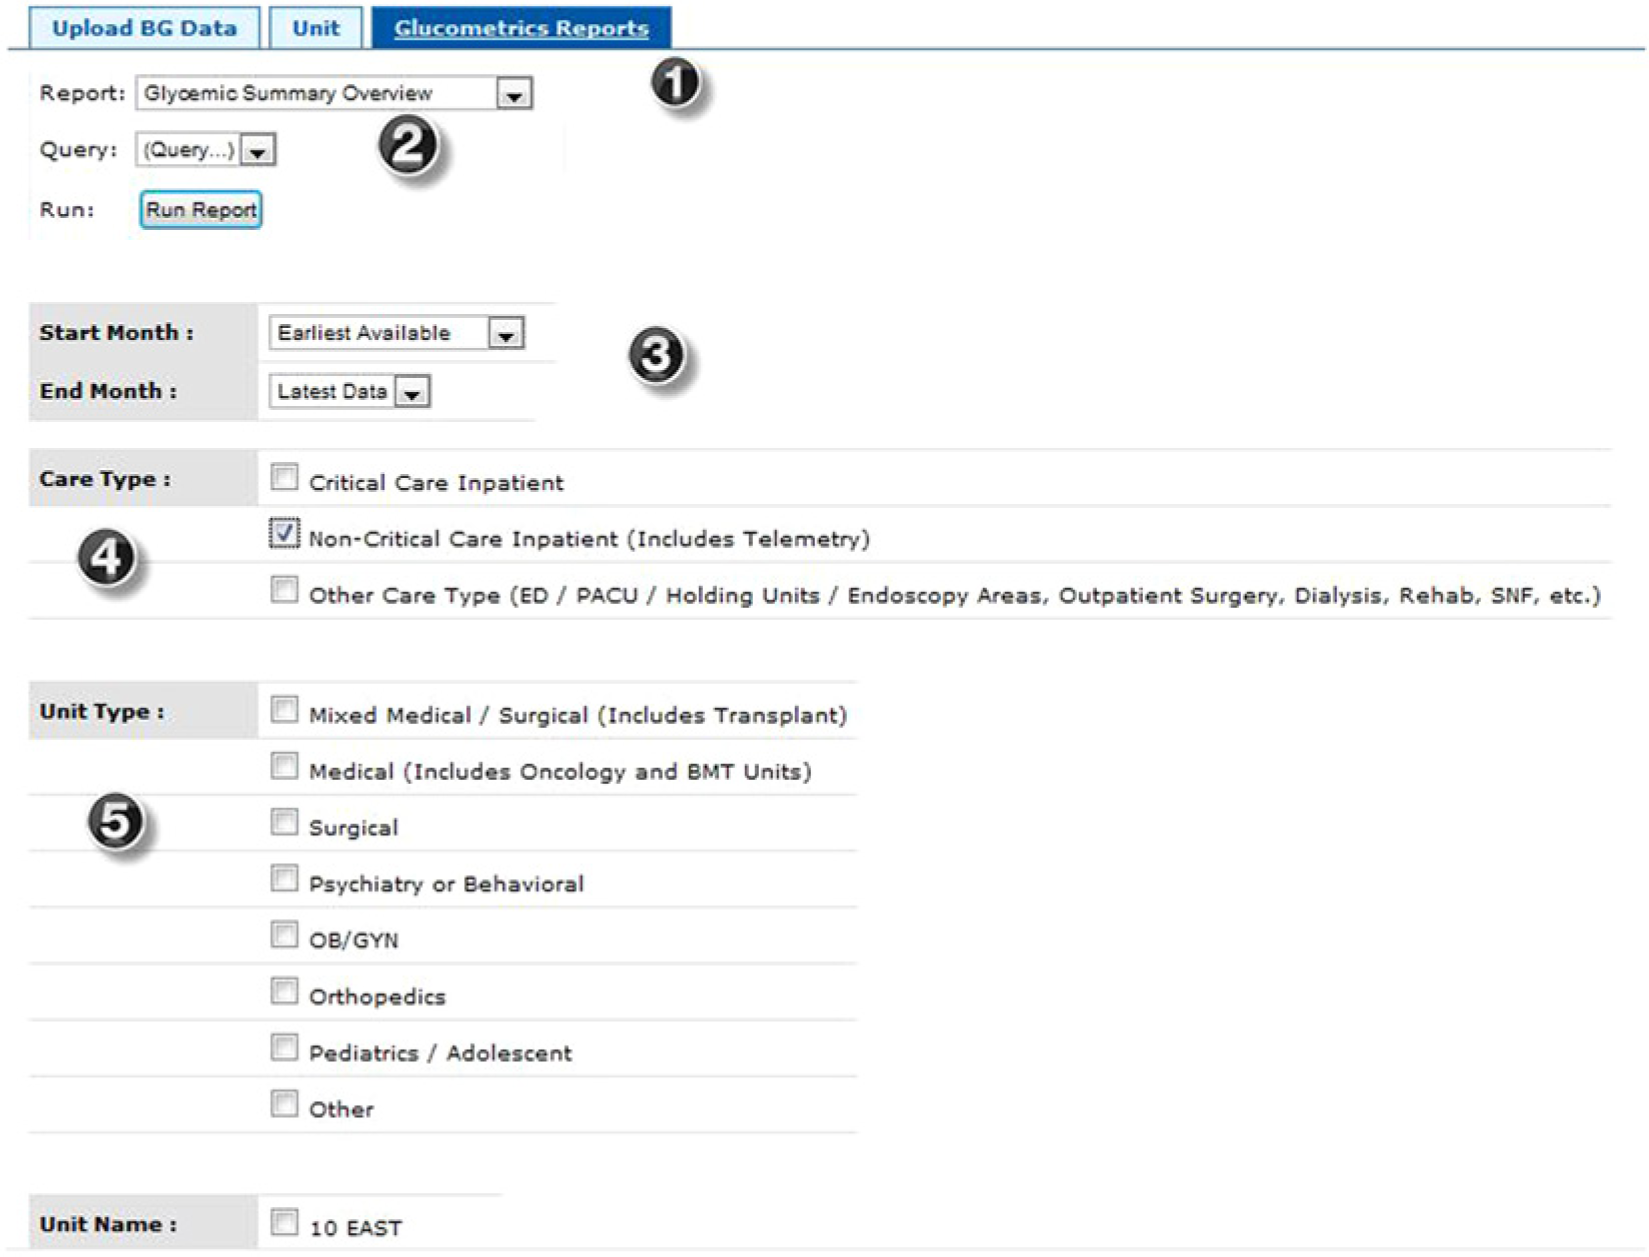
Menu to construct and run glucometrics reports. The description of features corresponds to the numbers superimposed on the screen shots. (1) Four types of reports are available from this pull down menu: a tabular summary overview, patient day reports, patient stay reports, and a unique hypoglycemia management report. All but the tabular summary overview depict month by month results, as well as a summary roll up. (2) The queries can be saved for future reference, and the “run report” button executes the command once the desired parameters are in place. (3) The time frame for the report is selected from this pull down menu. Any start and end date can be chosen, or if no choice is made, data for all months available are included. For convenience, menu items like “6 months prior to latest” (as depicted here) are also available. (4) Care type options include critical care, non–critical care, and other. Users are encouraged to analyze the care types separately, as they often have different goals and interventions available. (5) Further refinement of reports can easily be constructed by restricting the query to certain unit types within a care type. For example, a query can be restricted to surgical critical care units. All units with data are also listed (only 1 unit shown here due to space restrictions). Users may select any individual unit or any combination of units for analysis.
Figure 2 depicts an example glucometrics summary overview. This view depicts all the available metrics in 1 place for the chosen time frame, aggregated as 1 data set. Graphics depicting the distribution of patient day and patient stay means, along with markers of the mean and median, are also presented along with this overview report (not shown).
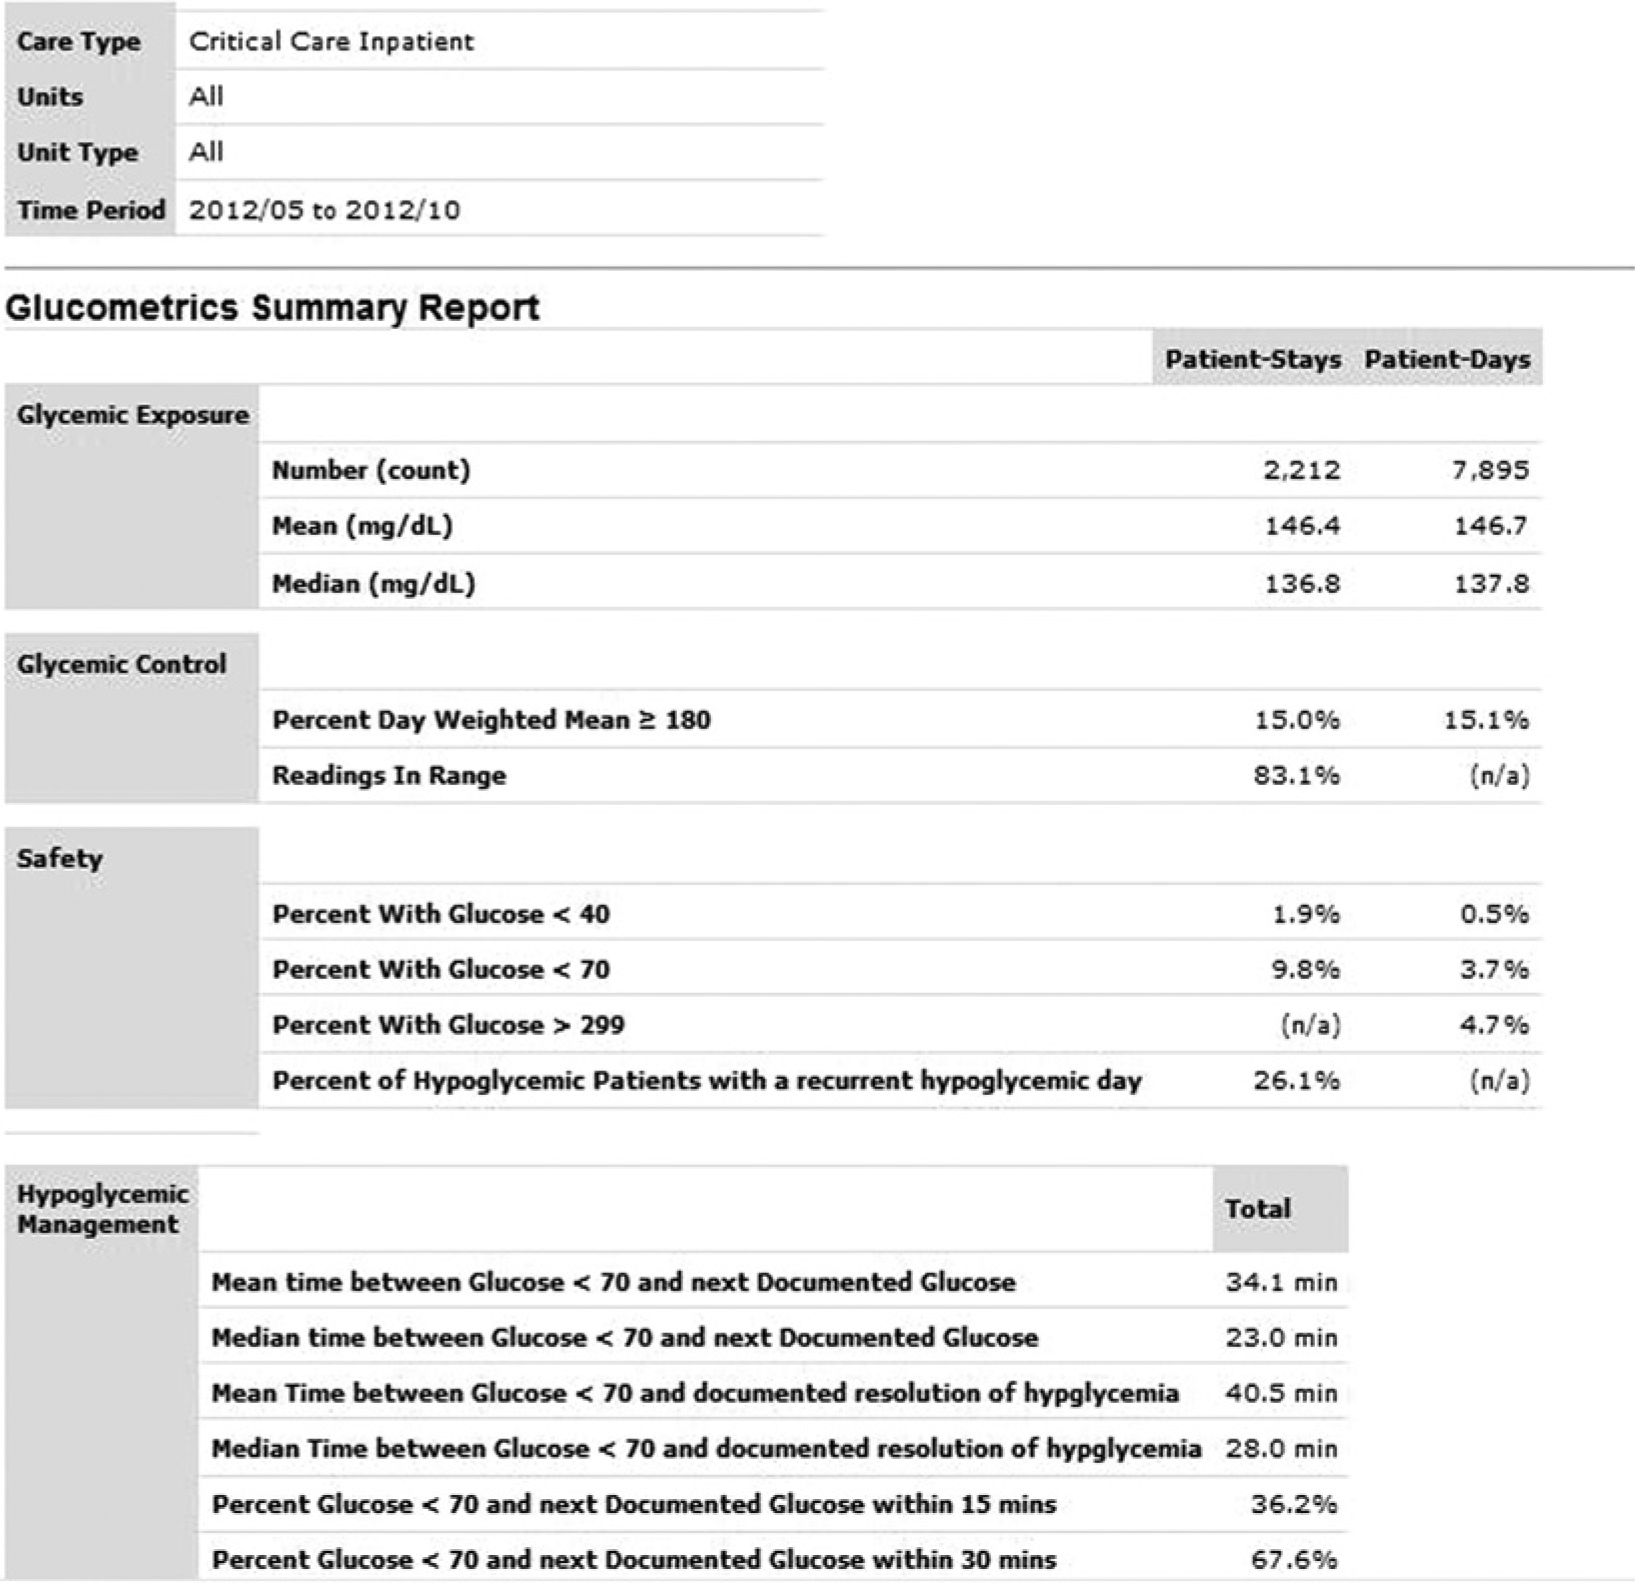
Tabular overview glucometrics report. In this example, the glucometrics for all critical care units over a 6-month time period are depicted. See text for detailed descriptions of the metrics presented.
With just 2 mouse clicks (changing the report type from pull down menu and “run report”) the user can run any 1 of the remaining month-to-month report types for the same population they selected in the first query. In addition to the tabular month to month analysis, run-charts are generated for several selected metrics. Figure 3 represents run-charts depicting the impact of improvement efforts on hypoglycemia management. More examples and an on-demand webinar, reviewing the SHM glucometrics reporting engine, are freely available on the SHM website. 32
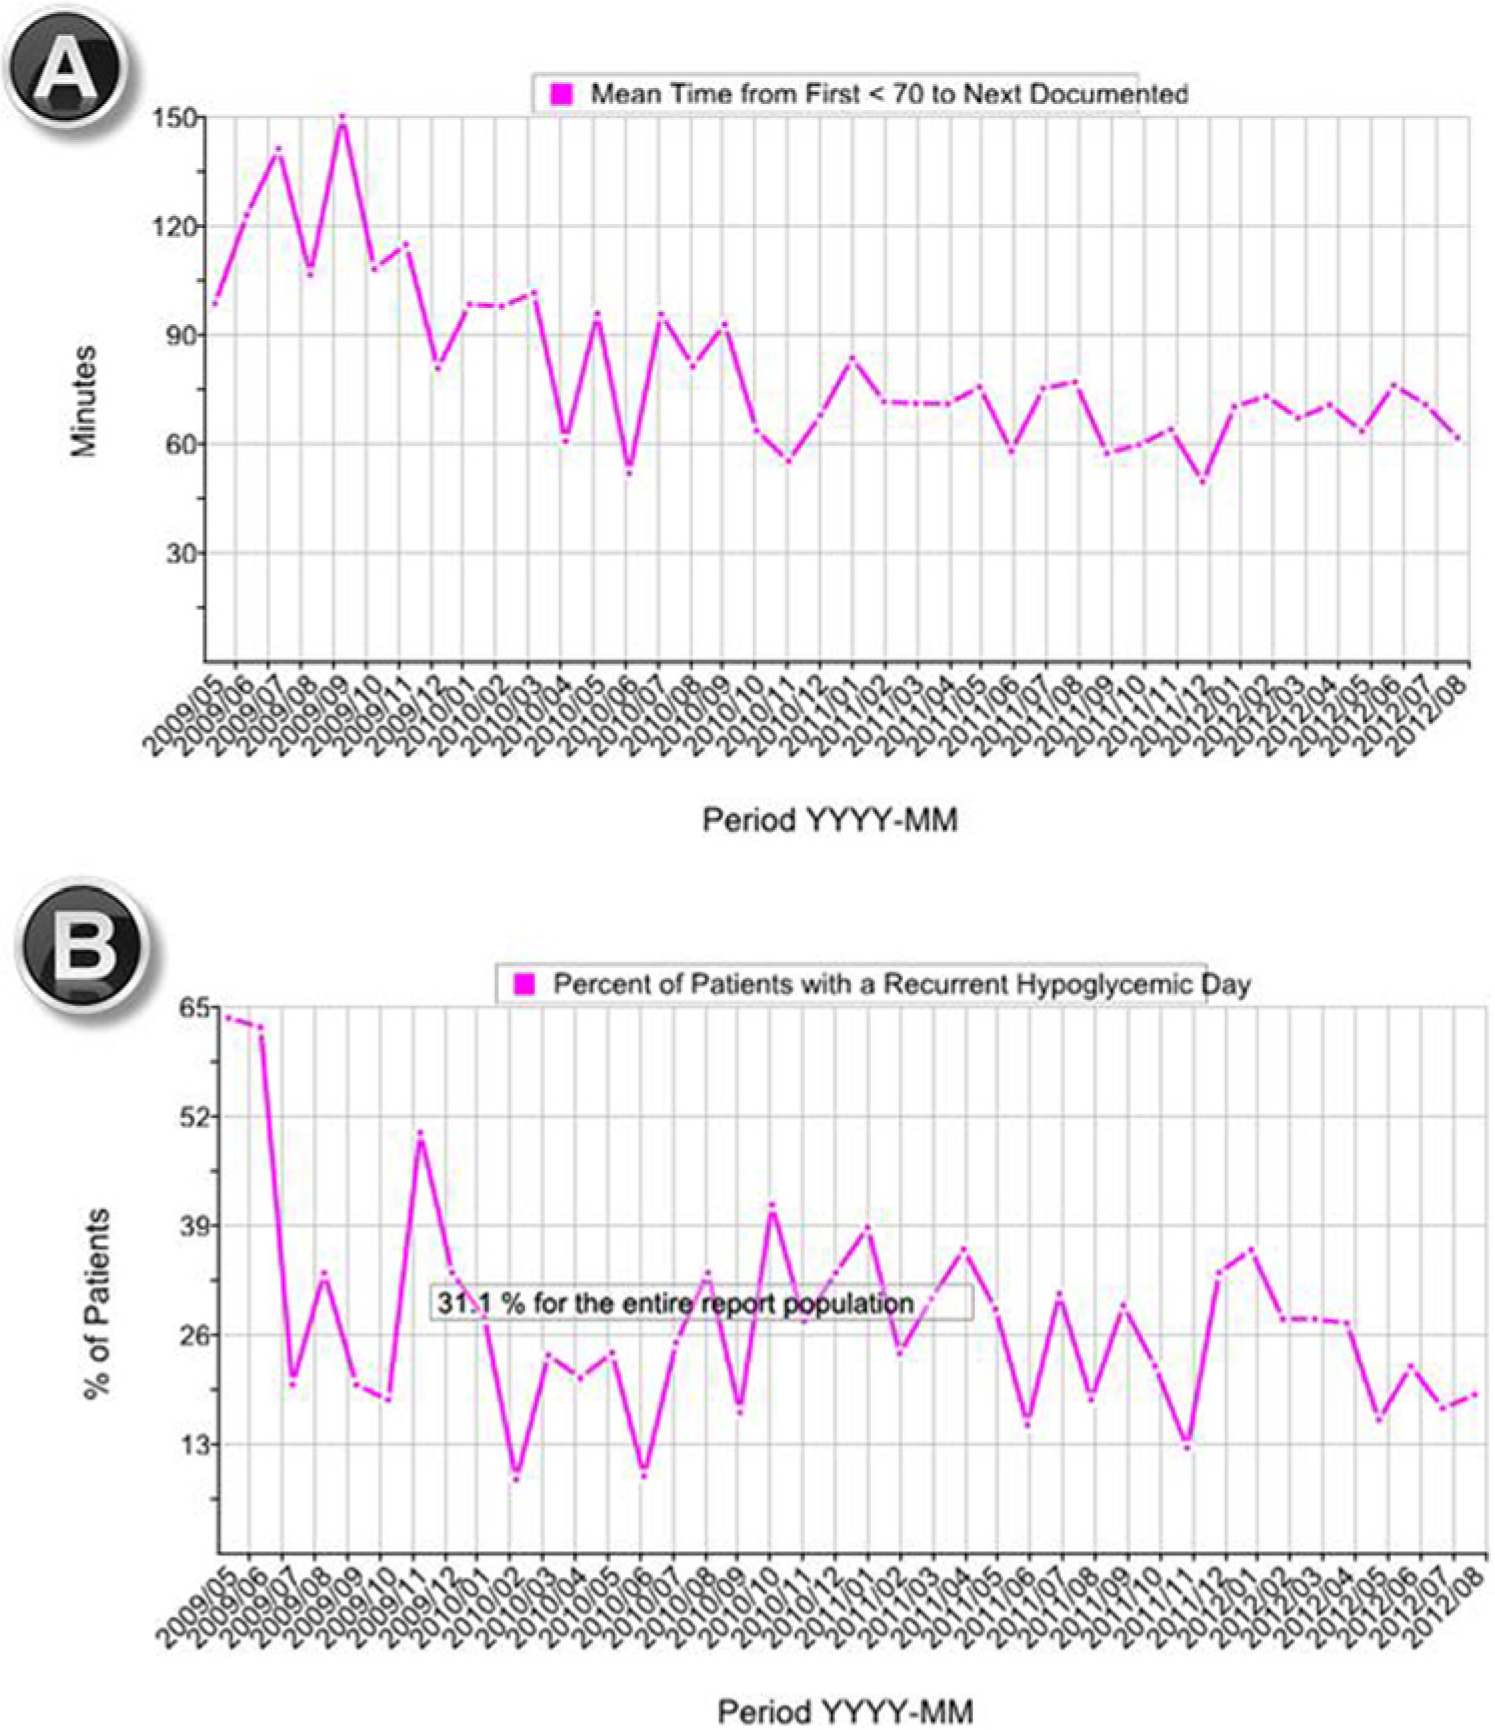
Hypoglycemia management run charts. (A) Decreasing time interval to documentation of a follow-up BG test after an episode of hypoglycemia (defined as a glucose < 70 mg/dL). (B) Reduction in the percentage of patients suffering from a recurrent hypoglycemic patient day in the same population. A tabular report and a run chart depicting the time interval to resolution of hypoglycemic events is generated in the same report (not shown).
External Benchmarking
In May 2013 SHM performed the first in a series of biennial benchmarking reports to participating hospitals. Adult medical/surgical units for each hospital were combined to establish the composite performance for the entire hospital, subdivided by ICU and non-ICU units, based on the last 6 months of uploaded data. Mean, median, and top quartile performance for the cohort were summarized for each parameter. Performance for each hospital was assigned a rank-order, and results were presented in rank order bar-chart plots and scatterplots. A numeric code allowed each hospital to identify their own hospital, while the identity of other hospitals was obscured.
Results
There were 76 hospitals uploading data from 476 adult non-ICU units, with 65 of them also uploading data representing 212 adult ICUs. We present results and examples from the ICUs here. Table 1 depicts the mean, median, range, and top quartile performance levels of the 65 hospitals contributing ICU data. There was a wide range of performance for all measures. The top quartile was viewed as an “achievable benchmark,” as a full 25% of hospitals were able to achieve these levels across all of their ICUs on average.
Benchmarking for Selected Glucometrics from 65 Hospitals—Adult ICU Units.
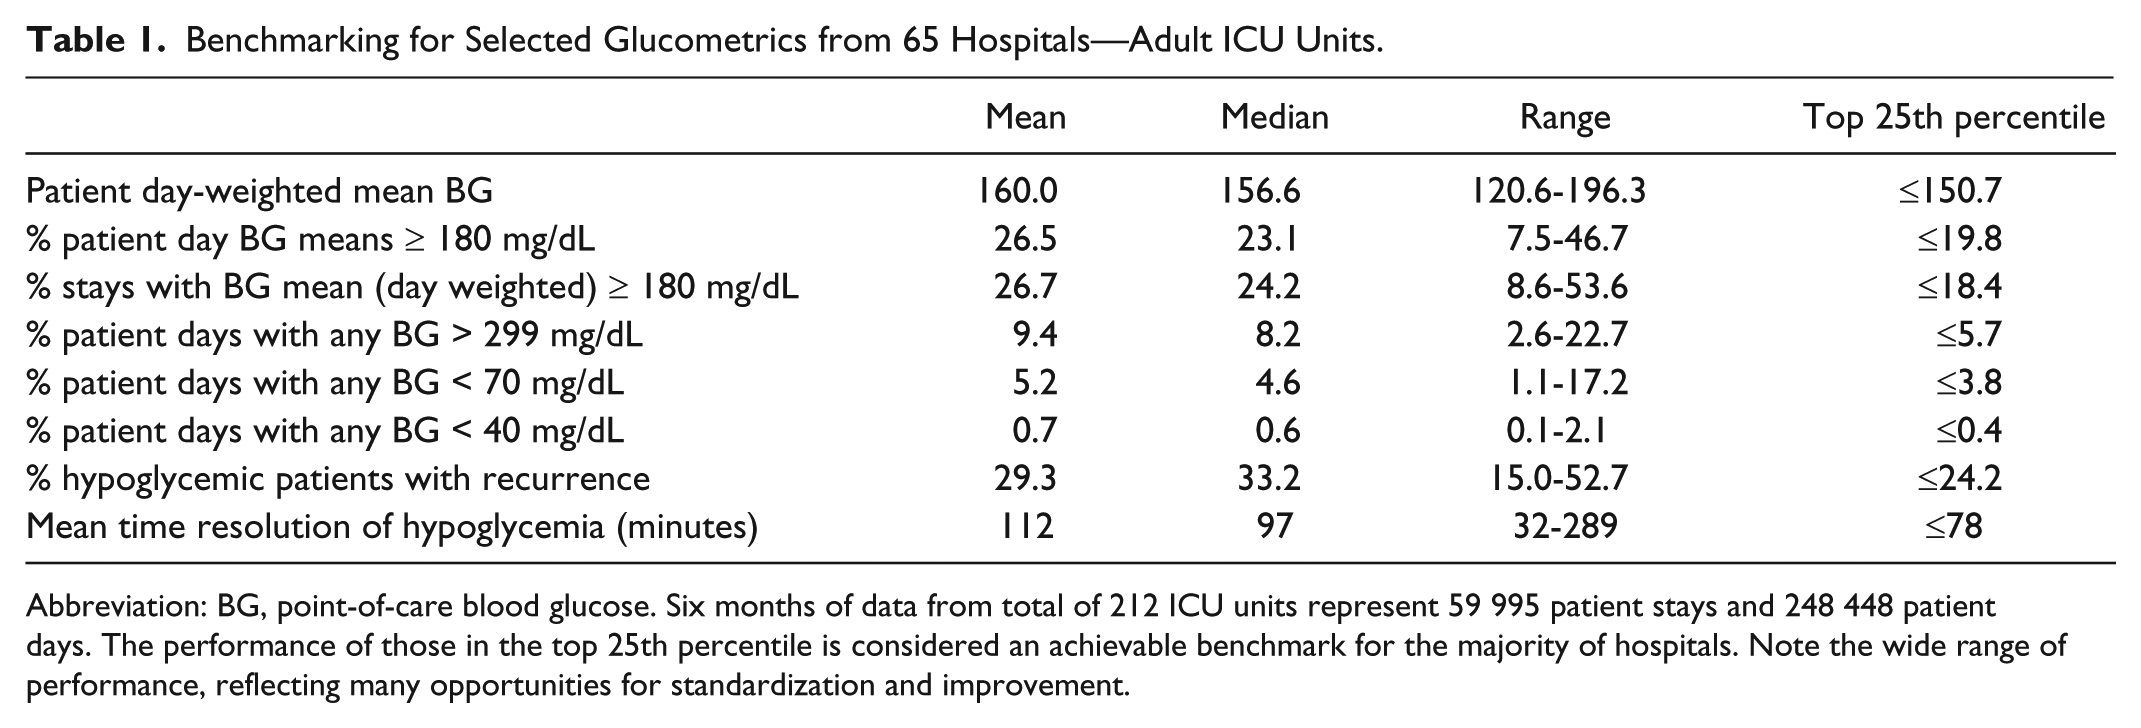
Abbreviation: BG, point-of-care blood glucose. Six months of data from total of 212 ICU units represent 59 995 patient stays and 248 448 patient days. The performance of those in the top 25th percentile is considered an achievable benchmark for the majority of hospitals. Note the wide range of performance, reflecting many opportunities for standardization and improvement.
Figure 4 is an example of a rank order bar-chart. Each hospital is represented as a bar with a numeric identifier, and entering their numeric identifier in the report highlights their bar in red. Each hospital’s absolute performance on a glycemic control parameter is depicted by the height of their bar on the y-axis (in this case, the percentage of ICU patient days with any BG < 70 mg/dL), while consecutive relative performance rank is depicted on the x-axis. The wide range of performance and median are apparent at a glance.
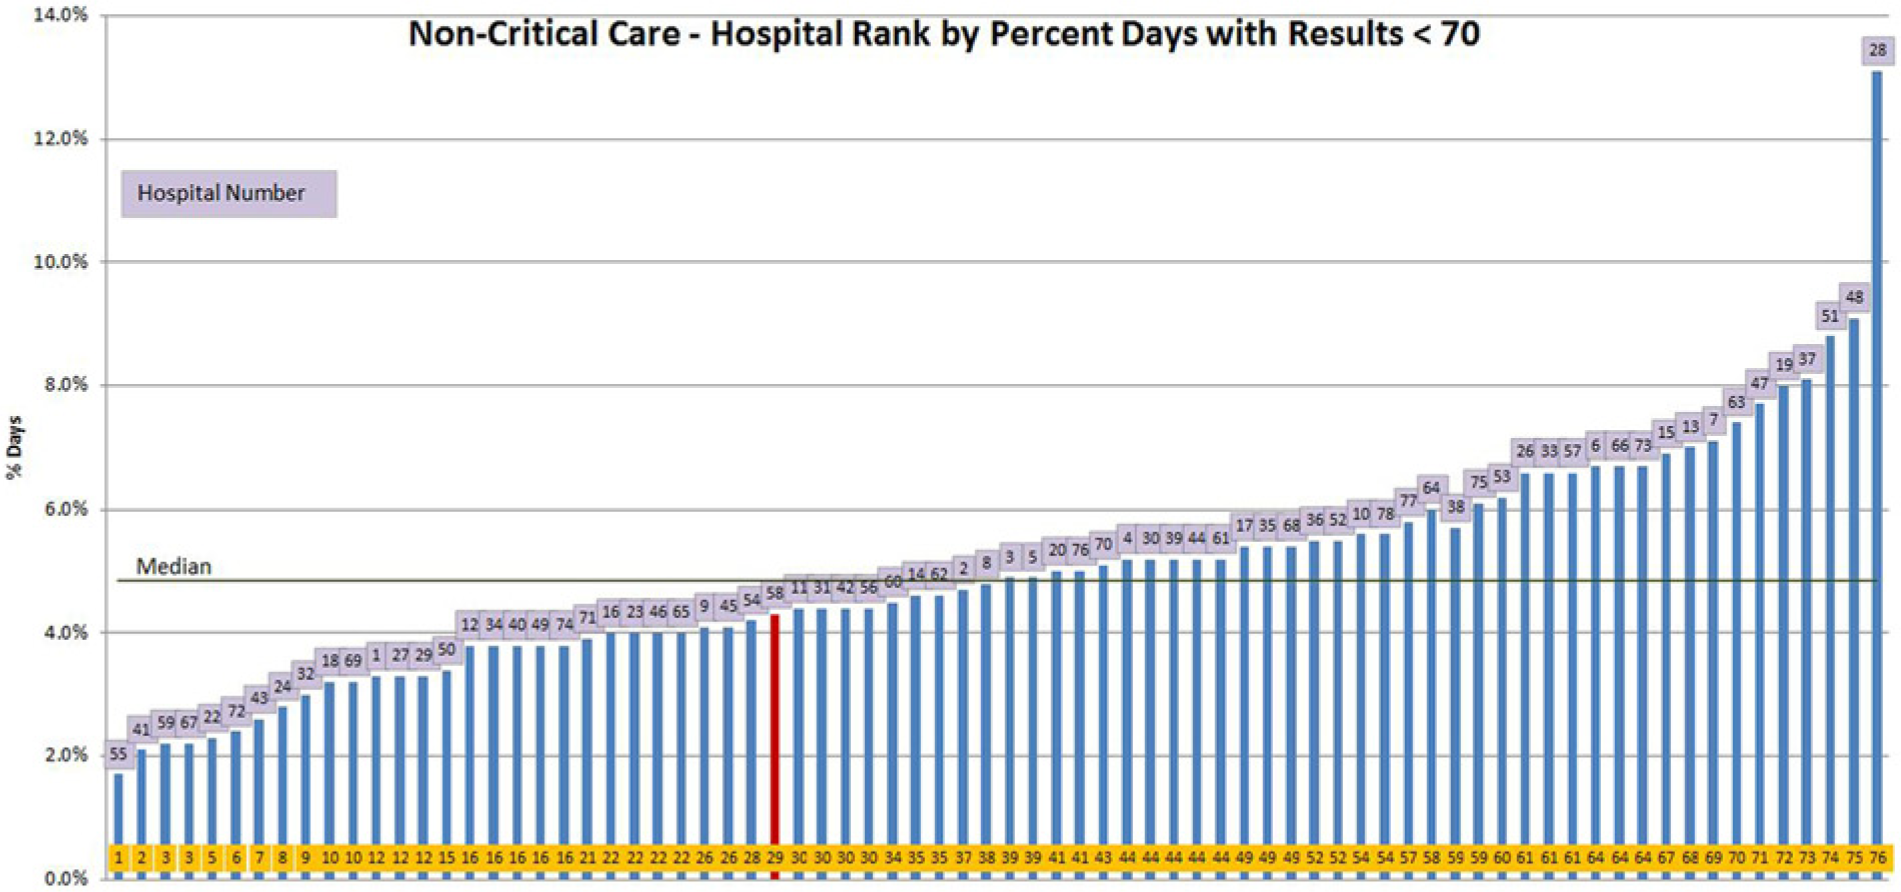
Rank order bar chart— percentage of patient days with blood glucose results < 70 mg/dL for critical care units. Hospitals are assigned a rank order for performance, in this case for percentage of patient days with hypoglycemia. Each hospital is depicted by a vertical bar, with lower rank depicting better performance from left to right on the x-axis, and the absolute performance on the y-axis. The green horizontal line designates median performance for the cohort. The red color helps each hospital identify its own site at a glance.
Figure 5 is an example of an ICU SHM benchmarking scatterplot. As in the rank order bar-chart plots, each hospital can identify their own institution by entering their numeric coded hospital identifier, which highlights their institution in red. Each hospital’s performance on a glycemic control parameter is depicted on the y-axis (in this case, the day-weighted mean BG for ICU patients), while a hypoglycemia parameter (percentage of patient days < 70 mg/dL) is depicted on the x-axis. Lower, median, and upper quartile boundaries are clearly marked.
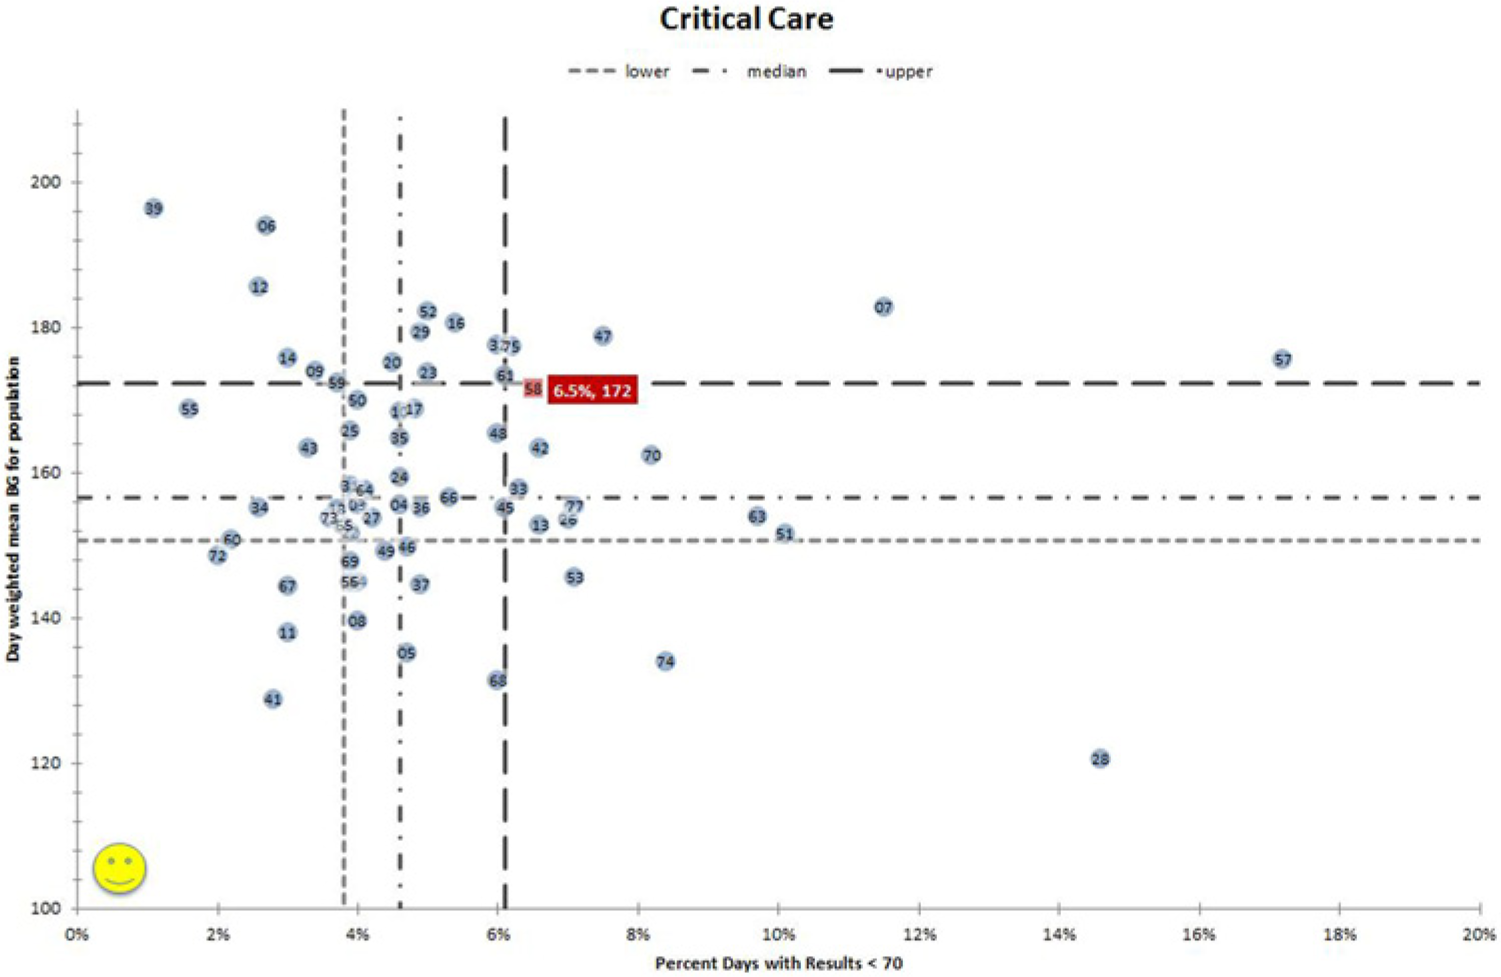
Benchmarking scatter-plot for critical care units. Each hospital is depicted by its number and its position, defined by its performance for glycemic control (day-weighted mean glucose) on the y-axis, and hypoglycemia rates per patient day on the x-axis. Quartiles of performance are depicted by the hatched lines, with the top performers in the left lower quadrant attaining the best quartile of performance for both hyper- and hypoglycemia rates. The red color highlights an individual hospital’s performance. In this case, the highlighted hospital has relatively poor performance in both glycemic control and hypoglycemia.
This juxtaposition of hyper- and hypoglycemic performance on 1 graph makes the trade-offs and priorities for each institution more apparent. For example, in Figure 5 the highlighted hospital might pursue more aggressive insulin dosing if they were looking only at their glycemic control parameter, because they have a fairly high day-weighted mean BG of 172 mg/dL, on the verge of the bottom quartile performers. However, their high rate of hypoglycemia (6.5% of patient days) places them in the bottom quartile of hospital performance for this parameter, alerting them that they need to improve hypoglycemia prevention and proceed cautiously. Good glycemic control and low hypoglycemia rates are clearly achievable, as 14 of the 65 hospitals perform above the median for both at the same time.
Discussion
Defining performance measures, calculating baseline performance, monitoring the impact of improvement efforts, and comparison of performance across hospitals are all desirable to safely optimize glycemic control, yet the majority of hospitals lack this capacity. The SHM glucometrics Data Center addresses the need for flexible, on-demand analysis of glucometrics across any range of dates and units. The external benchmarking capacity also allows hospitals to place their performance in perspective, and to set achievable goals. The highly variable performance revealed in benchmarking reports highlights opportunities for improvement, and the need to individualize hospital goals.
By providing both patient stay and patient day data we allow users to continue to work with metrics that they prefer. The patient day values have the advantage of having a uniform unit of time, and it adjusts to some degree for repeated testing around glycemic excursions and other variations in testing patterns, while some clinicians and administrators find the patient stay metrics easier to communicate and relate to. The measures of time intervals until repeat testing and resolution, and for hypoglycemic recurrent events offer new tools for improvement. Time to resolution can serve as an indicator of nursing adherence to hypoglycemia management policies and procedures. Improvement teams that focus on appropriate assessment and interventions with the first episode of iatrogenic hypoglycemia should be rewarded with a reduction in the percentage of hypoglycemic patients that suffer a recurrent hypoglycemic day.
There are limitations to the SHM reporting engine. In the absence of reference standards, some of our definitions and techniques remain somewhat arbitrary. Severe hypoglycemia, for example, is defined by a recent American Diabetes Association/Endocrine Society workgroup as an event requiring assistance of another person to actively administer corrective action. 33 In the absence of this clinical information, some have defined severe hypoglycemia as < 40 mg/dL,34,35 while others just as reasonably select a cutoff point of < 50 mg/dL. 36 Obstetrics patients have different glycemic targets than those featured in our reports, and they are excluded from the benchmark values presented here. Future versions of our Data Center may allow institutions to choose their own threshold for hypoglycemia and desirable ranges, but this is currently beyond our current capabilities. While the majority of time intervals for hypoglycemia management are derived from automatically generated date and time stamps from the glucometer, some inaccuracy could be present in hospitals that upload data from their health record that are manually entered. We currently group “step down” or intermediate care units with non-ICU units in benchmarking reports, but will likely create a special category for them in the future, given the intensity of care provided in those units at many centers. In the meantime, hospitals can track these units as a distinct group through the “on-demand” reporting function.
Our data includes only point-of-care (POC) BG values, which may be less accurate than serum BG tests, especially in the ICU setting. We made this choice for a variety of reasons. The most common source of data used to guide care in the hospital setting is POC BG testing in both ICU and non-ICU settings. Including a combination of serum and POC BG testing would lead to duplicate “mirror” serum and POC BG readings. Many of our hospitals did not have the capacity to upload combination values or values for serum BG testing, but could easily manage uploading data directly from glucometer data repositories. Prior studies demonstrate that addition of venous plasma glucose results has minimal impact on hypoglycemia or hyperglycemia rates. 37
We cannot provide reports by service line or physician group. In the future, we would like to link the glycemic control data to clinical data like comorbidities, severity of illness, medications, hypoglycemia risk factors, and other demographics, but this is not currently feasible for us. While we make every attempt to exclude inaccurate data, the reporting is only as good as the data being uploaded to it. Hospital practices may vary for their BG testing thresholds, and for continuing testing in those that have already proven themselves to be euglycemic. We have no real control to adjust for testing thresholds and frequency of testing, other than providing patient day weighted reports. We considered eliminating records of patients that were euglycemic throughout their hospital stay, but validation studies at 1 of our hospitals revealed that this would unfairly eliminate a large number of well controlled patients with a known diagnosis of diabetes. We have made every effort to make the process secure and efficient, but institutions must make some effort to upload their data into our system. Finally, while we believe these reports are useful in guiding institutional efforts, we do not capture the clinical outcomes linked to glycemic excursions.
There are other systems that attempt to provide automated reports of hospital-wide glycemic control., all which share many of the limitations noted above. The Remote Automated Laboratory Systems (RALS® Medical Automation Systems, Charlottesville, VA) application and the Yale web-based system have published studies and are the most comparable to the SHM product described here. Large benchmarking studies based on RALS data repositories have been published,27-29 using some metrics quite similar to those we present here, while the reports offered by the company itself are more limited. 38 Yale offers some free, on-demand reporting with high quality glucometrics, but no benchmarking or quality improvement resources.25,26 Table 2 compares and contrasts these products. Other systems39,40 offer some reporting to those using their software, but we are not aware of published details or benchmarking, thus they are not represented in the table.
Comparison of Glucometrics Tools.
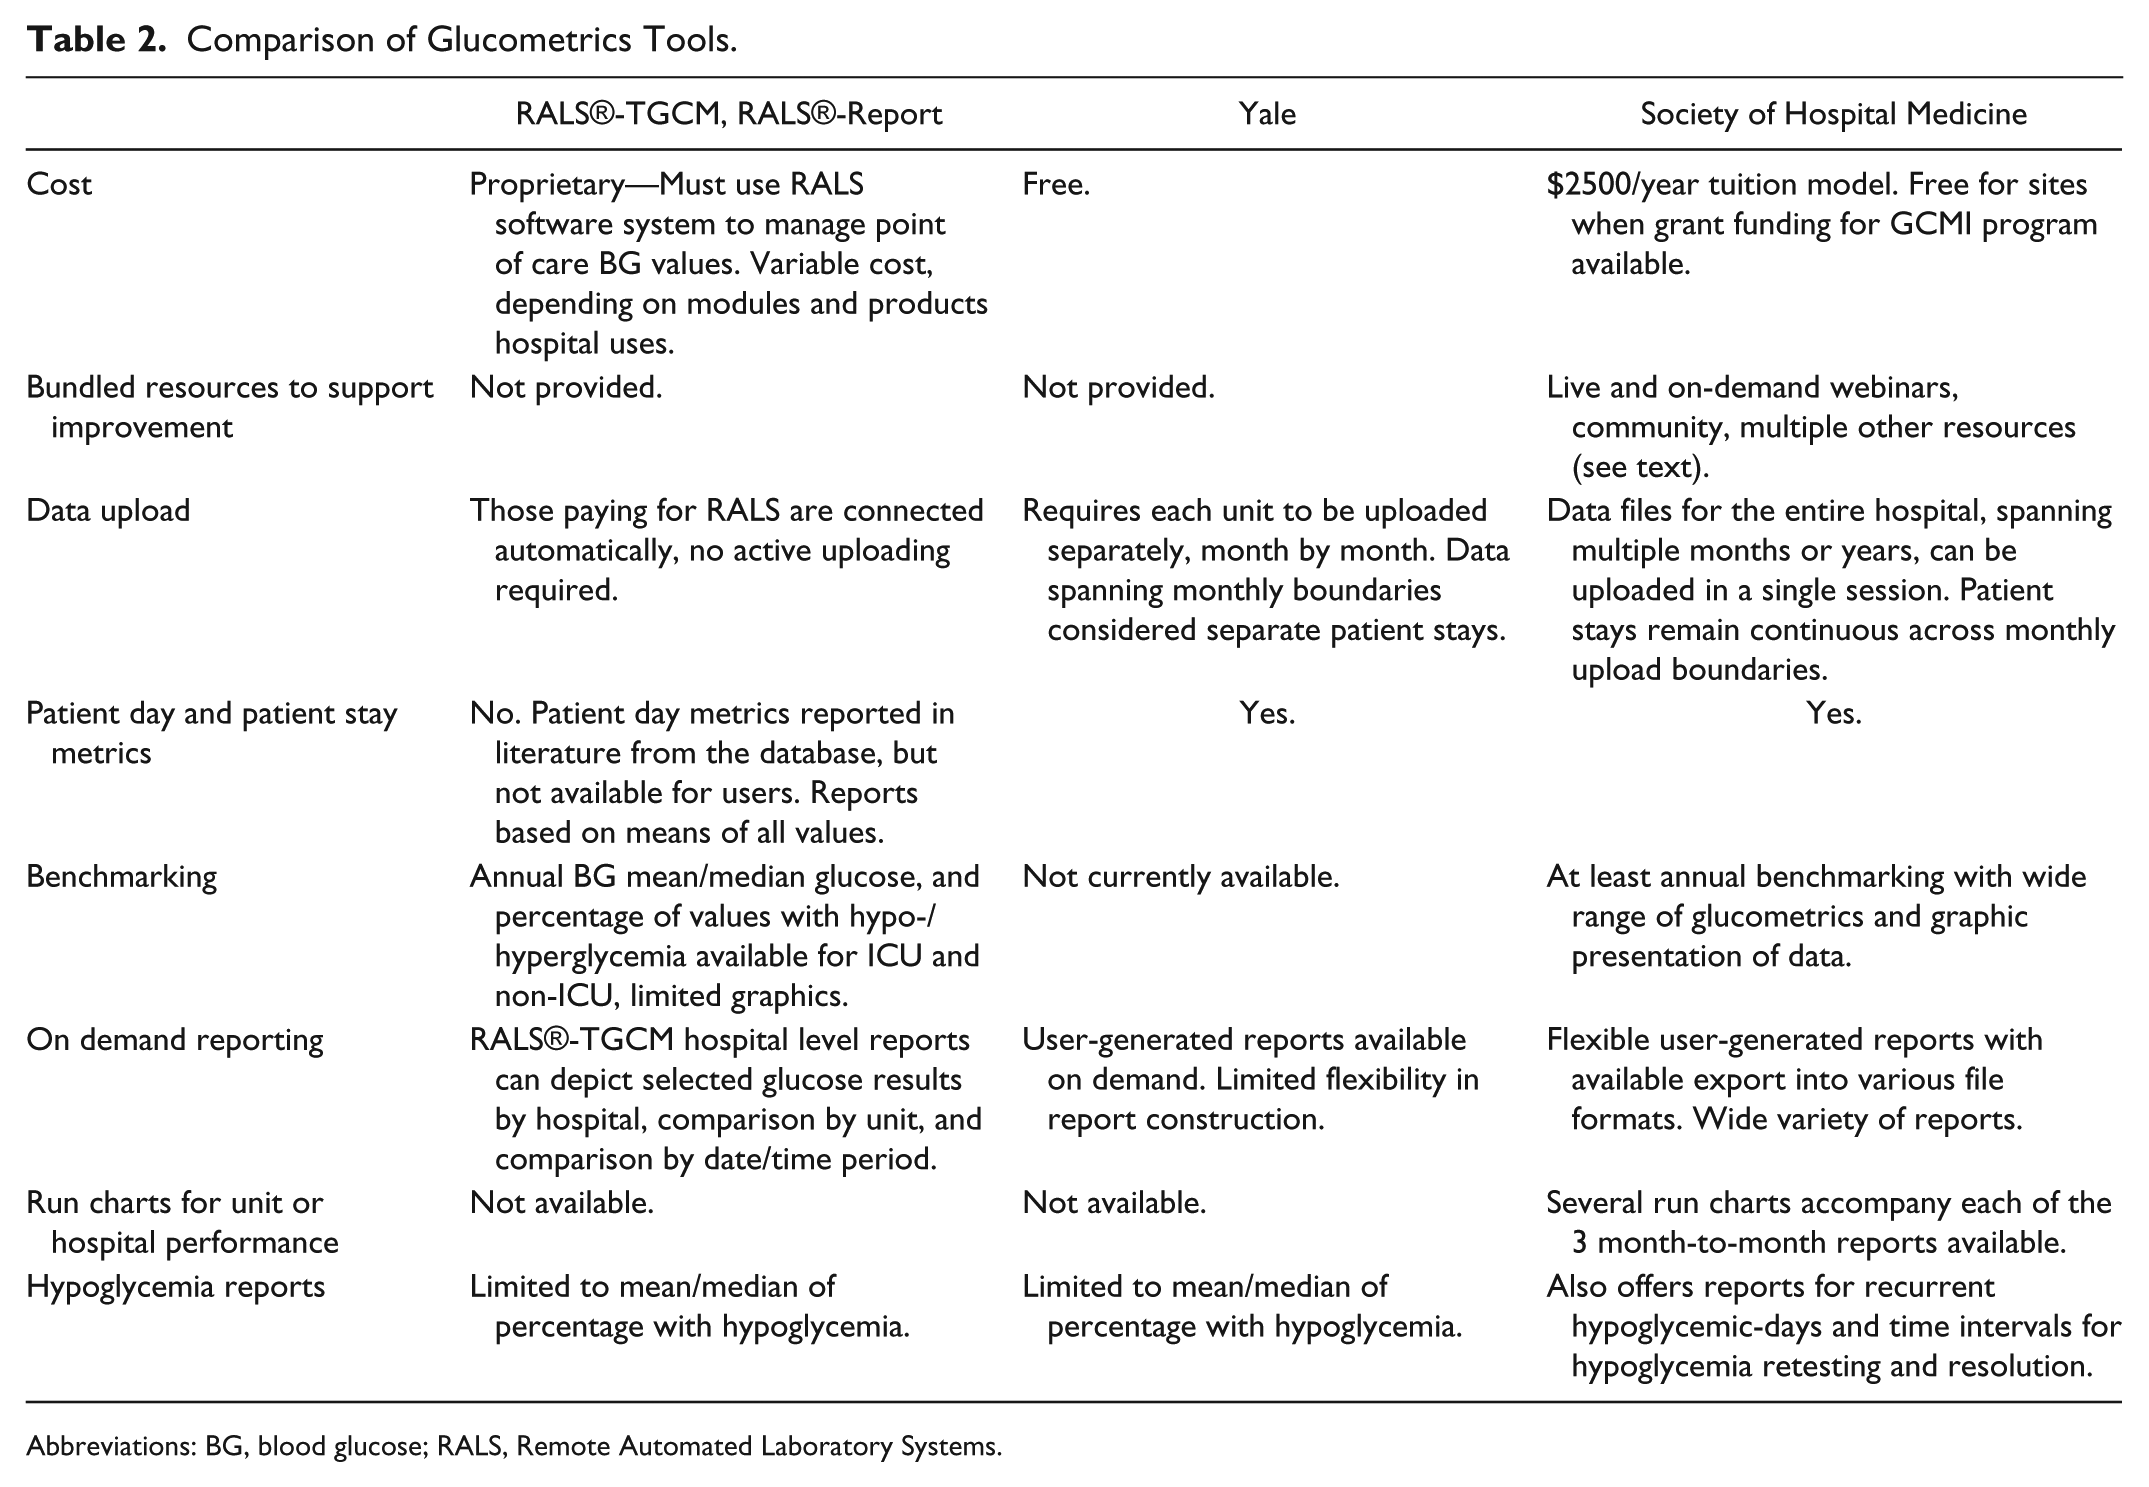
Abbreviations: BG, blood glucose; RALS, Remote Automated Laboratory Systems.
Conclusions
Improvement teams need high quality glucometrics to assess their baseline performance, track performance over time, and compare themselves to other institutions. Some tools have been available, but they had limited flexibility, accessibility, or functionality. The SHM Data Center offers both flexible on-demand reporting and robust benchmarking. Furthermore, the SHM glucometrics data and reporting center is surrounded by a compendium of tools designed to accelerate glycemic control efforts: a community with a very active Listserv, peer groups, on-demand webinars, example protocols and order sets, an annotated bibliography, a complete guide to designing and implementing glycemic control protocols, and many other tools. 12 The extensive suite of glucometrics introduced here should be considered for broader use. While some of our metric definitions are arbitrary, we are hopeful that this opens a dialogue and a push toward further standardization. The wide range of performance on glycemic control parameters reported here suggests a robust opportunity for standardization and improvement. Future efforts will incorporate an examination of characteristics in high performing hospitals, compared to lower performing institutions.
Footnotes
Acknowledgements
The authors would like to acknowledge the expertise, feedback, and assistance of all of the glycemic control teams enrolled in the SHM Glycemic Control Mentored Implementation program. Their work and dedication continues to inform and inspire us.
Abbreviations
BG, blood glucose; GCMI, Glycemic Control Mentored Implementation; ICU, intensive care unit; MI, Mentored Implementation; RALS, Remote Automated Laboratory Systems; SHM, Society of Hospital Medicine.
Declaration of Conflicting Interests
The author(s) declared the following potential conflicts of interest with respect to the research, authorship, and/or publication of this article: The authors have acted as paid mentors for the Society of Hospital Medicine, a nonprofit professional society that offers the product described here for a nominal fee. They receive no personal fiscal benefit from subscribing sites.
Funding
The author(s) received no financial support for the research, authorship, and/or publication of this article.