
Abstract
Background:
Glucose control can be problematic in critically ill patients. We evaluated the impact of statistical transformation on interpretation of intensive care unit inpatient glucose control data.
Methods:
Point-of-care blood glucose (POC-BG) data derived from patients in the intensive care unit for 2011 was obtained. Box–Cox transformation of POC-BG measurements was performed, and distribution of data was determined before and after transformation. Different data subsets were used to establish statistical upper and lower control limits. Exponentially weighted moving average (EWMA) control charts constructed from April, October, and November data determined whether out-of-control events could be identified differently in transformed versus nontransformed data.
Results:
A total of 8679 POC-BG values were analyzed. POC-BG distributions in nontransformed data were skewed but approached normality after transformation. EWMA control charts revealed differences in projected detection of out-of-control events. In April, an out-of-control process resulting in the lower control limit being exceeded was identified at sample 116 in nontransformed data but not in transformed data. October transformed data detected an out-of-control process exceeding the upper control limit at sample 27 that was not detected in nontransformed data. Nontransformed November results remained in control, but transformation identified an out-of-control event less than 10 samples into the observation period.
Conclusions:
Using statistical methods to assess population-based glucose control in the intensive care unit could alter conclusions about the effectiveness of care processes for managing hyperglycemia. Further study is required to determine whether transformed versus nontransformed data change clinical decisions about the interpretation of care or intervention results.
Data have been published on point-of-care blood glucose (POC-BG) levels in a large sample of US hospitals of varying sizes and types and from different regions. 1 These data include information on the prevalence of hyperglycemia and hypoglycemia in critically ill patients and can serve as a benchmark against which individual institutions can compare their own performance. General guidelines regarding management of hyperglycemia in critically ill inpatients have evolved over the past several years, with target glucose values ranging from 140 mg/dL to 180 mg/dL for most patients.2-5
Given concern over hyperglycemia and hypoglycemia in critically ill patients,2-4,6, clinicians often struggle to balance the 2 extremes to achieve recommended glucose targets. In addition to glucose levels, glycemic variability in the intensive care unit (ICU) has been identified as a factor affecting clinical outcomes and patient mortality.7-9 Control charting has been suggested to assess the impact of interventions targeting inpatient hyperglycemia, to trend glucose data over time, and to assist in the management of variability.4,10-11 Statistical process control charting of glucose data may establish whether changes in care processes affect glycemic control, or whether a particular approach to a management process meets expectations. 12 An underlying assumption of process control, however, is that the charted data approximate a normal distribution.13-14 Incorrect assumptions about the distribution could produce false alarms and wrong conclusions about a process, 15 which then may lead to unnecessary or inappropriate interventions.
Getting glucose control “just right” in the ICU might be facilitated by using population-based statistical process control charts in conjunction with point of care glucose methods to track and analyze glucose data therapy. Combining, these methods may assist in alerting practitioners when a management process affects trends toward higher or lower glucose values in critically ill patients. A previous analysis of POC-BG measurements derived from noncritically ill (non-ICU) inpatients with diabetes mellitus demonstrated that interpretation of the POC-BG control charts in the analysis was affected after statistical transformation created a more normal data distribution. 16 A comparable analysis has not been performed for POC-BG data derived from the ICU. Therefore, we applied identical statistical methods to ICU POC-BG data to test the hypothesis that the conclusions drawn from this control chart analysis would be affected by a statistical transformation similar to what was observed with the analysis of non-ICU POC-BG data.
Methods
Data Extraction
ICU POC-BG data were extracted from the laboratory information system for the year 2011 (January 1-December 31). POC-BG measurements were measured on a standardized glucose monitoring system (Accu-Chek Inform II System; Roche Diagnostics North America, Indianapolis, IN, USA) that scanned patient identification and downloaded directly into the laboratory information system. During the 12-month study period, 8679 POC-BG values were obtained. No patient identifiers were included, and the analysis was part of overall quality improvement/quality assurance efforts on inpatient glycemic control at our institution. Therefore, the Mayo Clinic Institutional Review Board determined that formal review and approval were not necessary.
Data Transformation
Methods for statistical process control commonly assume that data sets are approximated by a normal distribution. 17 Statistical transformations enable skewed data to more closely model the behavior of normalized data. 18 While debate persists over the efficacy of transformations, they nonetheless support the application of statistical techniques that leverage the properties of normally distributed data.19-22
Box–Cox transformations were applied to the ICU POC-BG data, as previously described for non-ICU POC-BG data. 16 As with the non-ICU POC-BG data, an iterative process was used to identify the Box–Cox transformation parameter lambda (λ), which represented the closest fit of the raw data set to a normal distribution. 16 After transformation, a goodness-of-fit test was used to calculate test statistics to assess how well the data conformed to a normal distribution. Since the goodness-of-fit test required the collection of data points into bins of 5 or more samples, individual observations were grouped.23-24 Since data were grouped and analyzed without knowledge of the clinical status of the patients or the therapies used to treat hyperglycemia, the authors assumed the data to be independent.
Control Charts
Exponentially weighted moving average (EWMA) control charts were constructed to evaluate glucose values over time. EWMA charts highlight out-of-control processes as soon as plotted points exceed specified control limits.25-26 As previously described, different 3-month subsets of data were used as a baseline to calculate upper and lower control limits before proceeding with construction of the EWMA charts. 16 Upper and lower control limits were established to maintain glucose levels in a band above and below the baseline average by 3 times the standard deviation, commonly referred to as the 3-sigma limit. 13 Once the baseline 3-sigma limits were established, example charts were constructed in arbitrarily chosen 1-month blocks. Statistical process control was applied to both nontransformed and transformed POC-BG data, with comparisons in observations then made between the 2 analyses. The control chart graphs presented here specifically highlight portions of the 1-month intervals when differences were observed between nontransformed and transformed data. We highlight 3 examples from different months, examining whether data transformation may alter the interpretation of out-of-control events identified by control charts.
Results
Example 1
Example 1 represents the analysis of ICU POC-BG data from April 2011 (Figure 1, top panel). The high χ2 value (59 430.6) and the left-skewed probability plot of the nontransformed data supported a poor fit to a normal distribution. After transformation, a smaller χ2 result (557.6) and a better approximation of normality were observed. Although the χ2 results from the transformed data failed to meet a critical value with 95% confidence, the transformations nonetheless improved the normal behavior characteristics of the data.
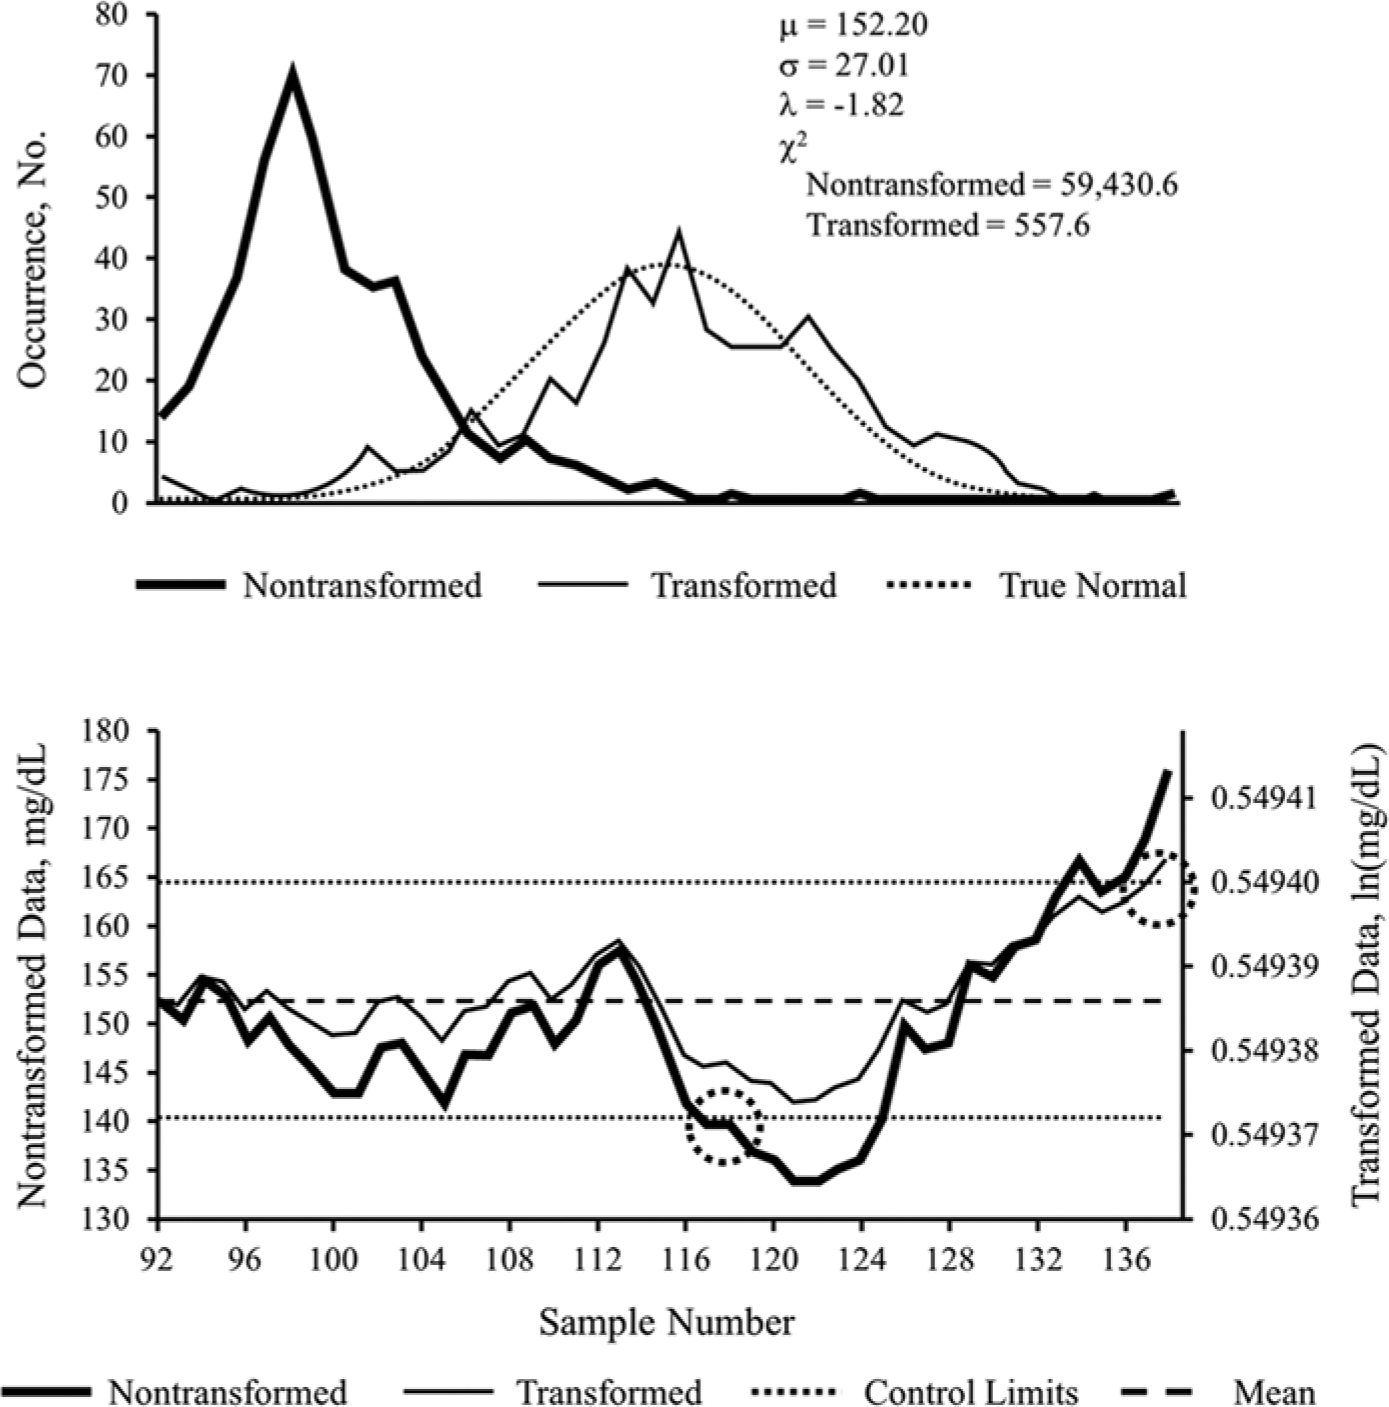
Nontransformed versus transformed ICU glucose data sets for example 1. Probability plot (top panel) and exponentially weighted moving average control chart (bottom panel) of nontransformed and transformed intensive care unit point-of-care blood glucose data sets from April 2011, used in example 1. Population mean of the nontransformed data set is denoted by μ; SD is denoted by σ; Box–Cox transformation parameter is denoted by λ. The decrease in the χ2 test statistic from 59 430.6 to 557.6 demonstrates improvement in the normal distribution characteristics of the transformed data. Transformed data are in natural logarithm (ln) form. Control limits represent 3 × SD, commonly referred to as 3-σ limits, above and below the mean. Circled areas represent samples exceeding upper or lower control limits, suggesting the occurrence of an out-of-control process. See text for interpretation of control chart findings.
An EWMA control chart (Figure 1, bottom panel), was then constructed for the April 2011 data. Nontransformed and transformed data were superimposed to highlight differences. With nontransformed data, an out-of-control process exceeding the lower control limit was identified at sample 116 (left circle) that was not seen in the transformed data. However, the transformed data remained in control until sample 137 (right circle), at which point it exceeded the upper limit.
Example 2
Example 2, derived from the analysis of data from October 2011, illustrates another instance of how statistical transformation of ICU POC-BG data can affect the interpretation of control chart data. As with example 1, nontransformed glucose data (Figure 2, top panel) were skewed, yielding an excessively high χ2 statistic (71 307.8). After transformation, the χ2 statistic (1100.0) improved, with the resulting distribution behaving closer to normal.
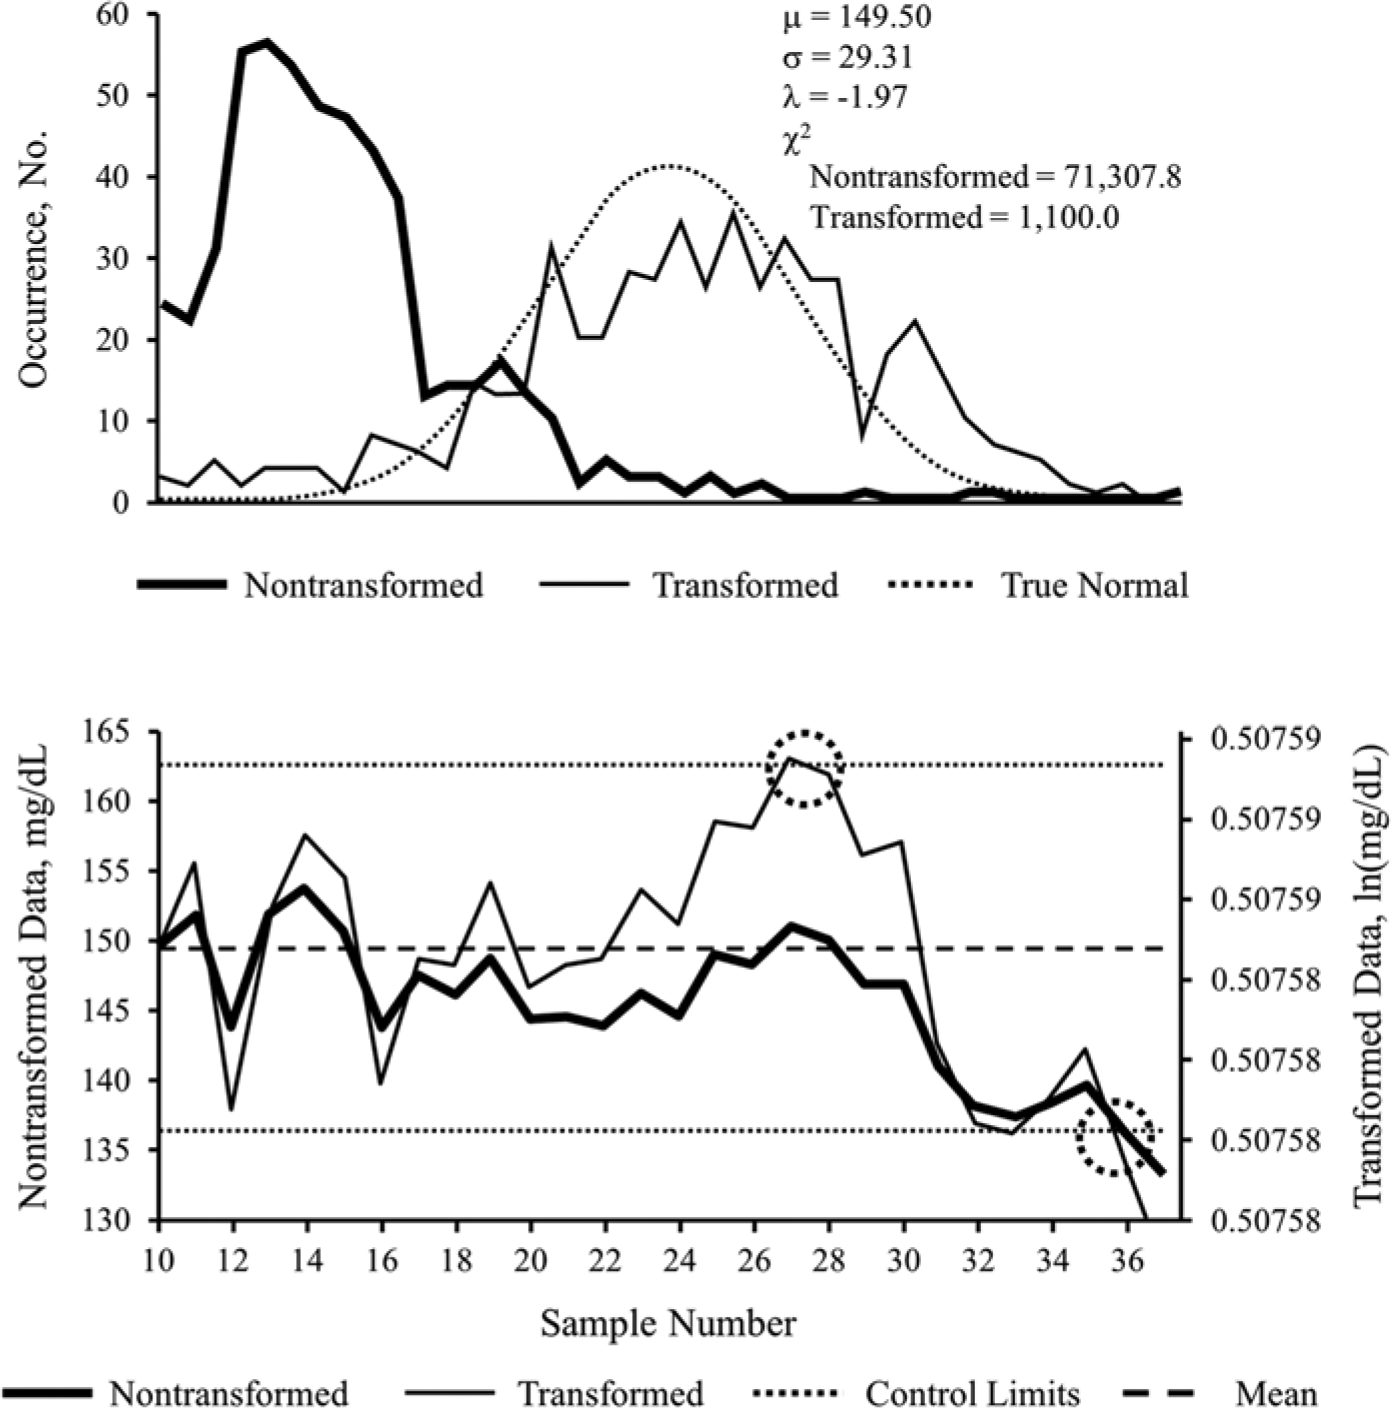
Nontransformed versus transformed ICU glucose data sets for example 2. Probability plot (top panel) and exponentially weighted moving average control chart (bottom panel), of nontransformed and transformed intensive care unit point-of-care blood glucose data sets from October 2011, used in example 2. Population mean of the nontransformed data set is denoted by μ; SD is denoted by σ; Box–Cox transformation parameter is denoted by λ. The decrease in the χ2 test statistic from 71 307.8 to 1100.0 demonstrates improvement in the normal distribution characteristics of the transformed data. Transformed data are in natural logarithm (ln) form. Control limits represent 3 × SD, commonly referred to as 3-σ limits, above and below the mean. Circled areas represent samples exceeding upper or lower control limits, suggesting the occurrence of an out-of-control process. See text for interpretation of control chart findings.
Assessment of the EWMA control chart for October 2011 glucose data showed distinct differences between nontransformed and transformed data. Both nontransformed and transformed data saw glucose values on a downward trajectory, eventually crossing the lower control limit at sample 36 (right circle). However, transforming the data pulled the plotted points toward the center line and detected an out-of-control process exceeding the upper control limit at sample 27 (left circle) (Figure 2, bottom panel). Thus, the transformed data detected an out-of-control process sooner. As with the first example, the transformation shifted the limit associated with the first out-of-control event from the lower limit to the upper limit.
Example 3
The skewed nature of glucose values from November 2011 was once again observed in example 3, brought closer to normal by transformation (Figure 3, top panel). As with the previous examples, the EWMA control chart from that period (Figure 3, bottom panel) revealed differences between the nontransformed and transformed analysis. In this case, nontransformed November results remained in control from samples 73 to 105. Once transformed, however, the process experienced an out-of-control event less than 10 samples into the observation period, at sample 80 (circle), where the upper control limit was exceeded.
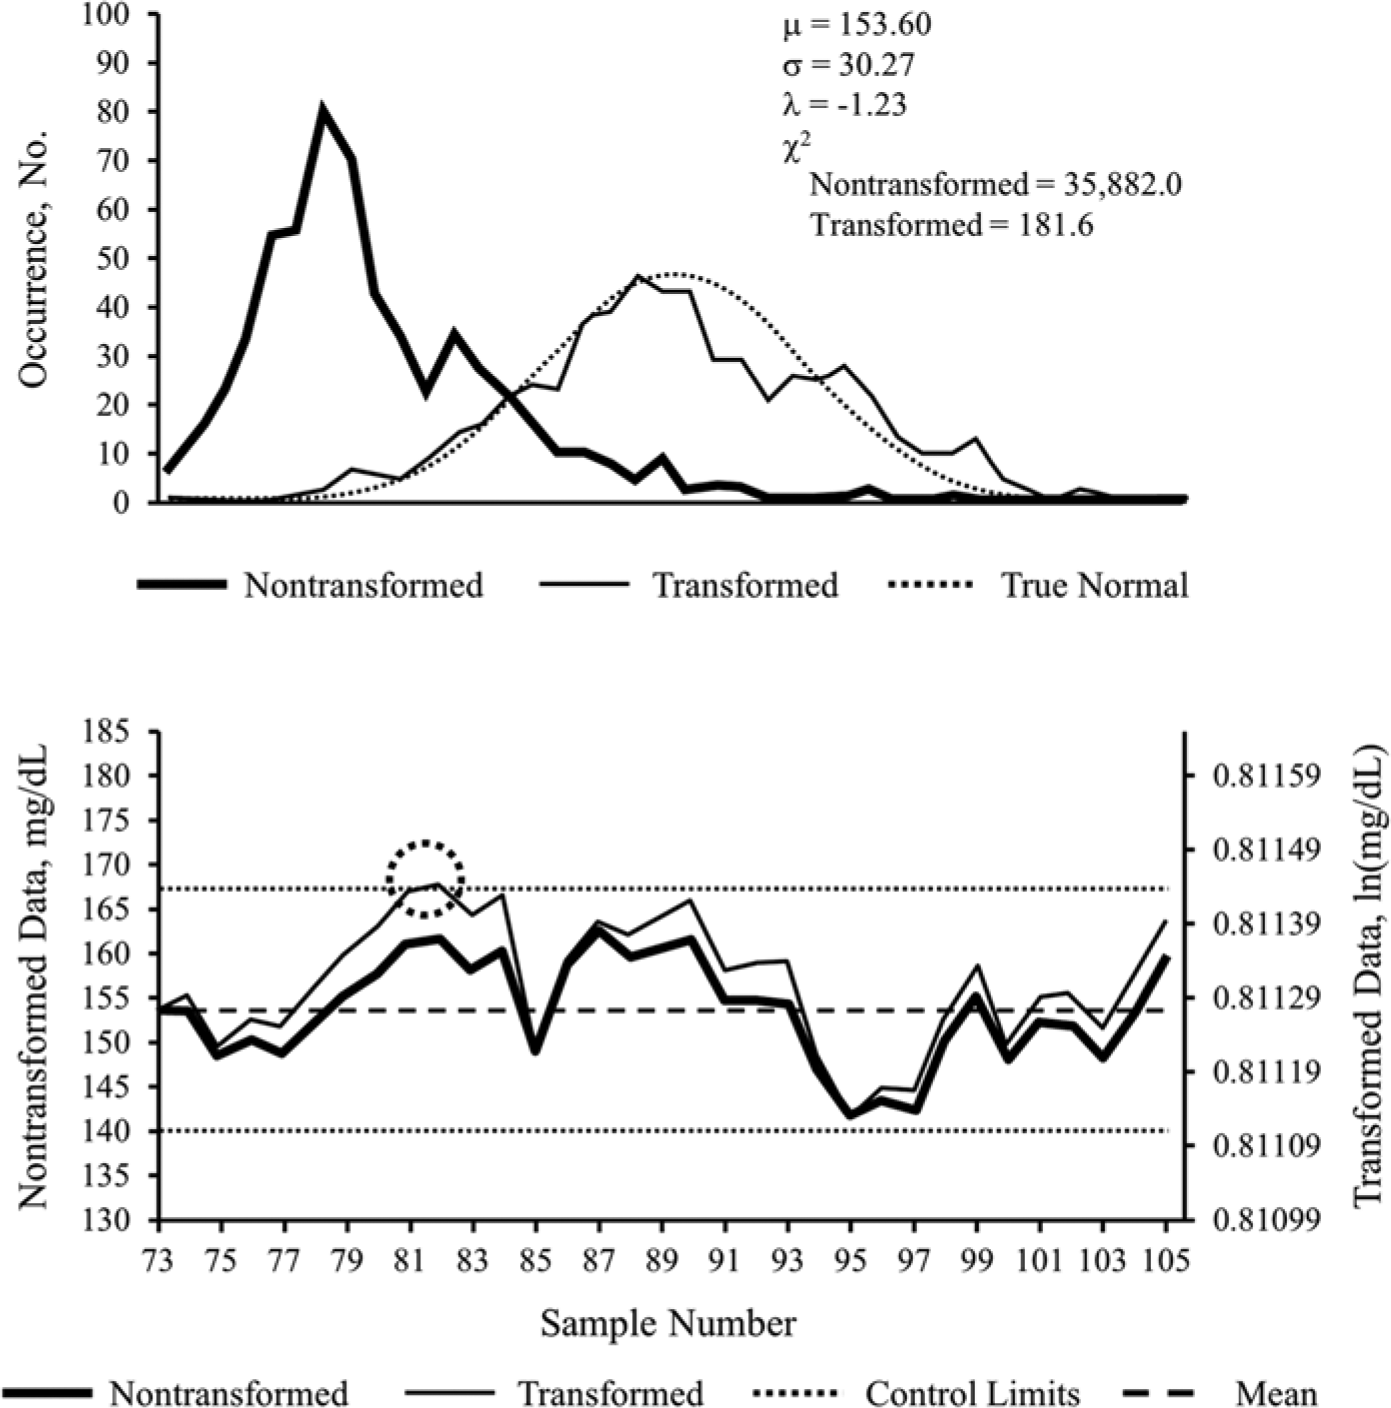
Nontransformed versus transformed ICU glucose data sets for example 3. Probability plot (top panel) and exponentially weighted moving average control chart (bottom panel), of nontransformed and transformed intensive care unit point-of-care blood glucose data sets from November 2011, used in example 3. Population mean of the nontransformed data set is denoted by μ; SD is denoted by σ; Box–Cox transformation parameter is denoted by λ. The decrease in the χ2 test statistic from 35 882.0 to 181.6 demonstrates improvement in the normal distribution characteristics of the transformed data. Transformed data are in natural logarithm (ln) form. Control limits represent 3 × SD, commonly referred to as 3-σ limits, above and below the mean. Circled areas represent samples exceeding upper or lower control limits, suggesting the occurrence of an out-of-control process. See text for interpretation of control chart findings.
Discussion
A variety of approaches to analyzing and transforming outpatient and inpatient glucose data have been proposed.27-28 However, studies of inpatient glycemic control have not focused on assessing the impact of statistical transformations and control charts on the analysis of inpatient POC-BG data. Development and testing of robust statistical methods to evaluate the status of inpatient hyperglycemia using POC-BG data are needed to provide researchers, clinicians, hospital administrators, quality management organizations, patients, and other stakeholders meaningful data on care processes affecting inpatient glucose control. To our knowledge this is the first article that explores a methodology for identifying potential differences in clinical care processes for ICU glucose management.
Similar to what was found with non-ICU POC-BG data distribution, 16 the findings of this analysis also demonstrated that ICU POC-BG data were not normally distributed. The method of statistical transformation applied here did shift the data toward a more normal distribution. This skewness of the nontransformed POC-BG measurements should be recognized and appropriate statistical methodologies selected when comparing differences in glucose control among inpatient populations over time, or when evaluating results of quality improvement efforts targeting glucose control in the ICU.
Just as with non-ICU POC-BG data, statistical transformations can alter the interpretation of how ICU glucose control processes are affecting glycemic control. For instance, as illustrated in example 1, transformed data demonstrated that the control process maintained glucose levels within control limits for a much longer period, eliminating the possibility of a false alarm—and possibly unnecessary premature intervention—that might have occurred in nontransformed data at sample 116. Both nontransformed and transformed data in example 2 identified a process that eventually resulted in a crossing of the lower control limit at sample 36. However, transforming the data identified a process earlier on (at sample 27) when the upper control limit was exceeded that had been missed with the nontransformed data. If this out-of-control process had been recognized, intervention at that point might have prevented the later event when the lower limit was exceeded. Finally, nontransformed results in example 3 remained in control throughout the span of samples analyzed. However, once the data were transformed, an out-of-control event less than 10 samples into the observation period (at sample 80) was identified. Failure to recognize this out-of-control event in the nontransformed data could have led to a missed opportunity to make changes in the glucose management process.
Debate related to the efficacy of statistical transformations persists. To this debate, the authors propose the introduction of common ground. Similar to this study, future research should focus on assessing nontransformed data superimposed with its transformed counterpart. Leveraging 1 method in conjunction with the other affords a truer insight into the magnitude and significance of outliers. This is particularly relevant if control charts are to be used as tracking tools for inpatient glycemic control and glycemic variability, given the increased risk of mortality of these at-risk patients.
The clinically recommended lower and upper glucose limits of 70 mg/dL and 180 mg/dL, respectively, are much broader than the narrow lower and upper bounds established through the statistical analysis of these data. This should actually be reassuring to an institution that, if their glucose control limits remain within the bounds of statistical control limits, clinical targets will be achieved as well. Exceeding control limitscould be an early signal that clinical targets might be in danger also, and institutions would be prompted to take appropriate corrective action in their glucose control processes before that occurred. With the exception of example 2, where the lower bound of the clinical range was exceeded, the analysis indicated that glycemic control processes in the ICU maintained the suggested target range of 140 mg/dL to 180 mg/dL without creating a problem of frequent hypoglycemia.
This is a patient deidentified population-based control chart. Within this context, therefore, the purpose is to identify, preferably as soon as possible, a glucose management process that has resulted in loss of control as defined by institutionally calculated control limits. This would allow appropriate analysis and corrective measures to be taken before exceeding clinical targets became a risk. Developing informatics applications linked to laboratory information systems to provide real time control charts could provide rapid feedback to clinicians on how their glucose control processes were performing.
Although there is a lack of consensus about the best methods for analyzing and reporting national glucose control data, there is general agreement that such analyses should occur.2 -5,29 Hospitals will likely want to analyze and report inpatient glucose metrics against some type of benchmark (eg, national mean glucose or rates of hyperglycemia or hypoglycemia). Quality control managers, however, will also want to monitor glucose management processes, to tightly monitor glycemic variability, and to be able to identify out-of-control processes early, to permit intervention so that metrics can remain within standards. Other metrics, such as mean glucose levels, could be used to track changes over time, but given the large number of POC-BG measurements that may be available, small changes may be detected statistically without clear clinical relevance. 30 As with the previous analysis 16 utilizing non-ICU POC-BG data, this analysis evaluated different statistical approaches (ie, using nontransformed and transformed data) to evaluate the ability of control charts to identify out-of-control inpatient glucose events in critically ill patients. Potentially any glucometric currently being tracked (eg, patient-day mean glucose) could be subjected to statistical process control, as long as appropriate statistical testing and transformation are undertaken to meet the requirements of control chart analysis.
Limitations of this analysis center on the retrospective nature of the data and the arbitrary grouping of samples. It is not possible to determine with this retrospective data whether out-of-control processes were recognized and appropriate actions were taken to correct them. The differences exist statistically and mathematically, but whether those differences are associated with or yield changes in the clinical process of care is a topic of further study. As well, the grouping of samples overemphasized a goodness-of-fit methodology without sufficient consideration of a relevant clinical context. Since the data were limited to ICU POC-BG measurements from a single institution, it would be of interest to determine whether data from other institutions would show a similar impact of statistical transformations on control charts.
In addition to the above, POC-BG measurements have drawbacks that may affect data quality. Among these is the accuracy of POC-BG values relative to reference laboratory blood glucose measurements.31-32 This is particularly true from measurements derived from ICU patients.33-35 The accuracy of POC-BG measurements can also be affected by the presence of interfering substances.31,36 The sampling source (arterial, venous, or capillary) also may impact the interpretation of glucose data and the management of hyperglycemia and hypoglycemia in hospitalized patients. 37 Finally, recent data suggest that results from different devices are not equivalent,38-39 and it will be important for facilities to employ standard technology for POC-BG measurements as was done here. Despite the limitations or POC-BG technology, it remains the only method for frequent and rapid bedside assessment and the richest source of data to conduct analyses of the type described here.
Together with the prior analysis of the non-ICU POC-BG data, our current analysis leads us to draw some general conclusions. Both analyses demonstrated that statistical transformations improve the normal behavior of ICU-derived and non-ICU-derived inpatient glycemic data sets. In addition, the results suggest that transformed data produce different control charts. The decision to analyze nontransformed or transformed inpatient glucose data could alter the interpretation and conclusion about the status of inpatient glycemic control, which potentially might affect when interventions are introduced and how they are interpreted. A best practice might, therefore, involve the simultaneous consideration of transformed and nontransformed data. Further study is needed on how best to apply these methods and integrate use of control charts into real-world ICU and non-ICU glucose management processes.
Footnotes
Abbreviations
EWMA, exponentially weighted moving average; ICU, intensive care unit; POC-BG, point-of-care blood glucose.
Declaration of Conflicting Interests
The author(s) declared no potential conflicts of interest with respect to the research, authorship, and/or publication of this article.
Funding
The author(s) received no financial support for the research, authorship, and/or publication of this article.