
Abstract
Glucose meter performance specifications provide limits for 95% of results, which is the same as total error. A popular total error model is that total error equals (average) bias plus 2 times imprecision. This model has been used to specify combinations of average bias and imprecision that satisfy total error goals. But this model is incomplete and its conclusions are suspect. It is shown that when interferences occur in glucose meters as exemplified by hematocrit interference, the total error model proposed by Boyd and Bruns cannot distinguish between meters that differ in performance. The CLSI standard EP21-A, does not have this problem because it directly estimates total error bypassing the need for a model. An example illustrates these points.
With the availability of so many glucose meters, one needs to know what acceptable performance is. Two standards organizations have addressed this with performance limits for glucose meters.1-2 Although I have commented that these standards fail to provide limits for 100% of the results, 3 the limits provided for 95% of the data are an important criterion for glucose meter quality. Westgard stated that total error, which is represented by the location of 95% of the data, is of prime importance to clinicians. 4 Moreover, he developed a simple model to estimate total error as:
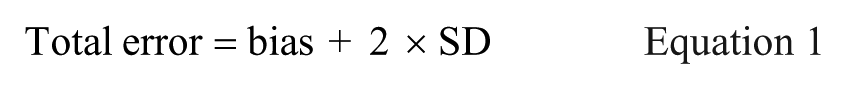
Thus, total error equals bias plus imprecision. This model is intuitively appealing, since what else could there be besides bias and imprecision. Boyd and Bruns have used this model to show combinations of bias and imprecision needed to keep total error within limits for glucose meters. 5
The purpose of this article is to show that this model is incomplete and how it can mislead one in estimating glucose meter performance. First, it is noted that in the Westgard model, what is meant by bias is really average bias of a series of specimens. Lawton and coworkers provided a more complete model to estimate total error. 6 Their model adds a random bias term (as a standard deviation) to the Westgard model. This additional term accounts for interferences that vary from sample to sample. A problem with the Lawton model is that the extra term is difficult to estimate.
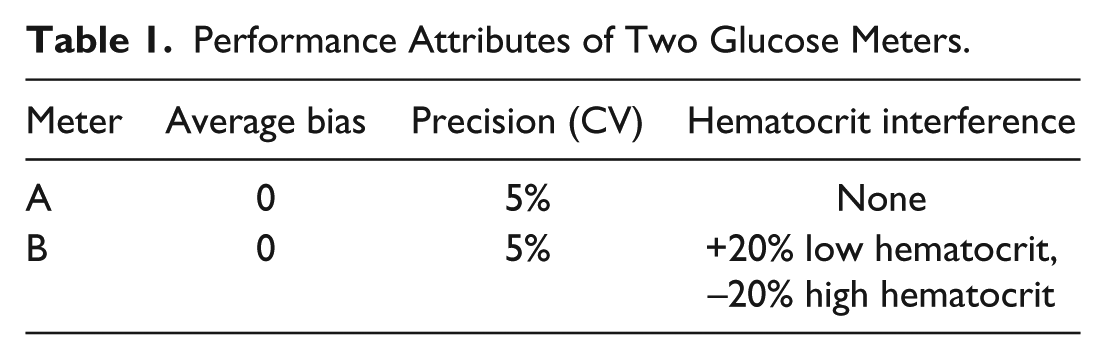
This random bias term is sometimes thought to deal with large, rare interferences, but it accounts for any size of interference, and this is especially pertinent to glucose meters. Thus, some glucose meters suffer from hematocrit interference and others not. 7 The CLSI standard EP21-A takes a different approach to estimating total error by directly computing the differences between the candidate assay and reference. 8 Thus, no modeling is required. The difference between EP21-A and the Boyd and Bruns method can be shown by comparing 2 hypothetical glucose meters, A and B. As shown in Table 1, the 2 meters both have no statistically significant average bias and the same precision. But meter B shows 20% bias at the extremes of hematocrit.
Performance Attributes of Two Glucose Meters.
According to the Boyd and Bruns model, glucose meters A and B have the same total error because they have the same average bias and precision (equation 1). But when analyzed with a CLSI EP21-A mountain plot,8-9 meter B with hematocrit interference is clearly not as accurate as meter A and fails the POCT12-A3 glucose meter standard (Figures 1-2). In a mountain plot, the glucose differences from reference are sorted from low to high and ranked. The Y axis represents the cumulative probability which normally ranges from 0 to 1. But to present a plot that is easier to visualize, the mountain plot cumulative probability values above 0.5 have been subtracted from 1 to give adjusted values. Two worked examples of how to construct a mountain plot using a spreadsheet are explained in EP21-A.
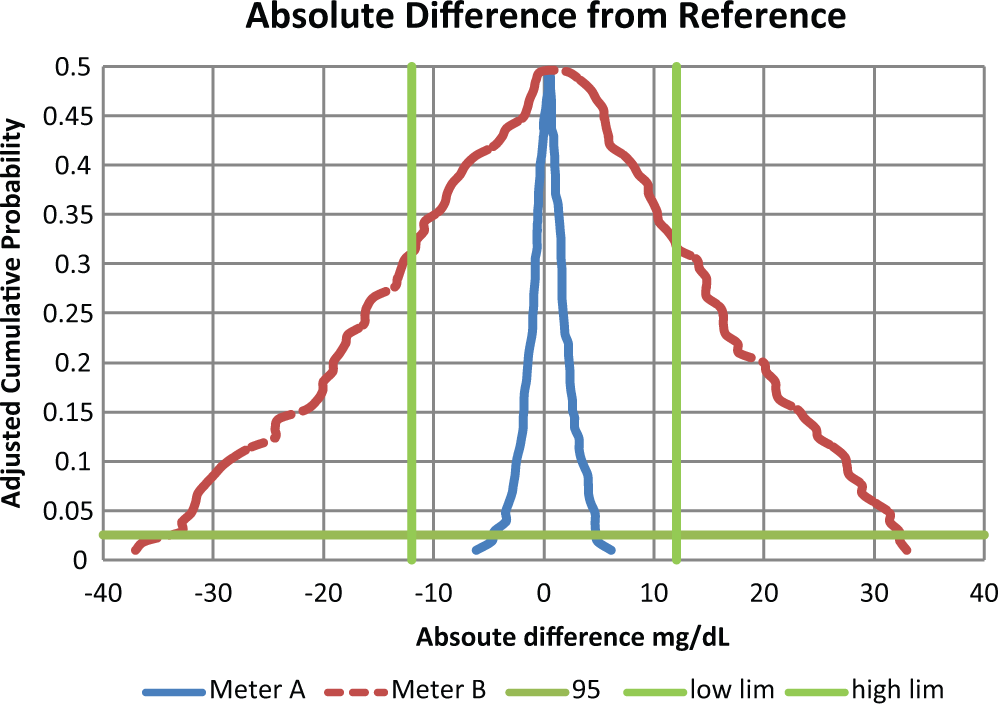
Absolute differences for glucose meters for reference less than 100 mg/dL. The intersections of the horizontal and the straight vertical lines represent the limits to contain 95% of the data. A meter that is contained with this space meets goals. Thus meter A meets goals and meter B does not.
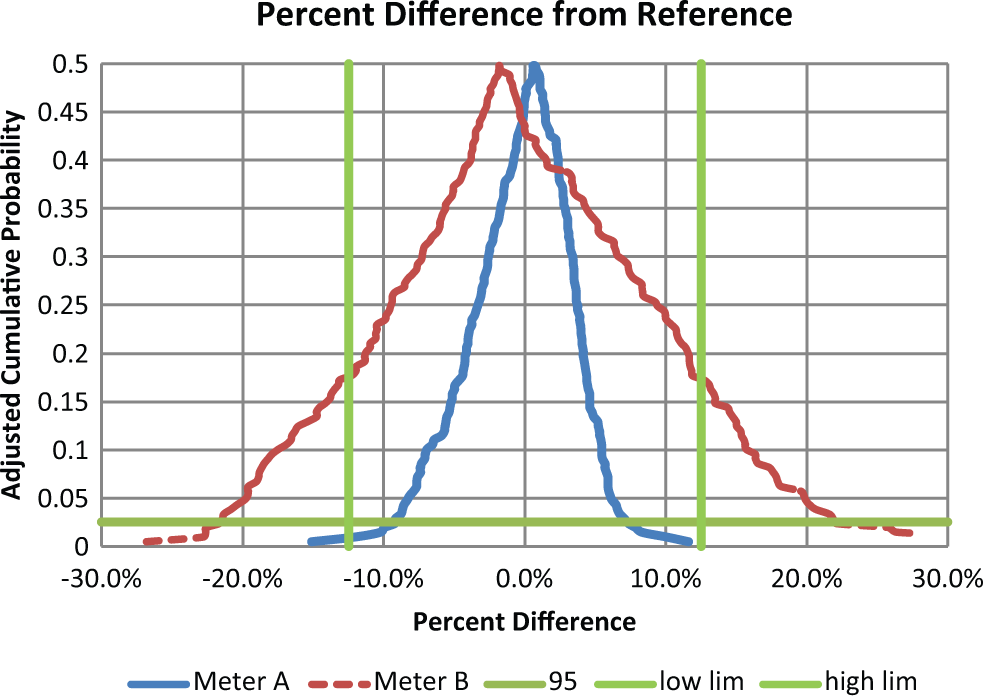
Percentage differences for glucose meters for reference greater than 100 mg/dL. The intersections of the horizontal and the straight vertical lines represent the limits to contain 95% of the data. A meter that is contained with this space meets goals. Thus meter A meets goals and meter B does not.
This demonstration was performed by simulations and simulations always work. The hematocrits were chosen as discrete values uniformly spanning 32% to 56% and applied to discrete glucose values uniformly spanning 30 to 280 mg/dL. Had different simulation conditions been used, meter A would remain the same and meter B might have become more narrow or wider in Figures 1 and 2. Only hematocrit interference was chosen. Other interfering substances would widen a meter’s total error performance and at the same time not be detected by the Boyd and Bruns approach. The fact that the average bias is not statistically significant is because manufacturers calibrate their systems to guarantee this property.
Yet, this commentary is not the first objection to the Boyd and Bruns model. I critiqued their model in a fashion similar to this commentary and they responded.10-11 In their response, they said I was correct but the sources of error I mentioned were “outside the scope of our study, in part because it is difficult to know how one might model the interferences.” They went on to say that in their article they discussed the need for manufacturers to “design instruments that avoid sources of error, such as those encountered by patients with special needs.” Unfortunately, my critique had no effect because their model continues in recent articles as if the critique never happened.12-13 Moreover, in the recently released CLSI glucose meter standard, POCT12-A3,2 these models are cited as a basis for the performance limits for glucose meters. Ironically, Boyd and Bruns 11 state in their response to my critique: “The points raised in Dr. Krouwer’s letter do point out that our estimates of quality requirements, as demanding as they may seem, would become even more demanding if the additional sources of error were included.” In a similar story, I critiqued 14 the NCEP’s use of the Westgard model to arrive at performance goals for cholesterol. 15 In spite of objections, the Westgard model also persists. 16 Perhaps these models persist because they are models and (simple) models are satisfying. In a total error analysis conducted using CLSI EP21-A, there is no means to separate error components nor a basis for setting limits on error components.
Finally, it is noted that total error only captures error that is allowed to occur in the experiment. For example, such experiments are often done with a single lot of reagent with many conditions controlled more tightly that would occur in routine use.
Footnotes
Abbreviations
CLSI, Clinical Laboratory Standards Institute; NCEP, National Cholesterol Education Program.
Declaration of Conflicting Interests
The author(s) declared the following potential conflicts of interest with respect to the research, authorship, and/or publication of this article: Jan S. Krouwer is an employee of Krouwer Consulting
Funding
The author(s) disclosed receipt of the following financial support for the research, authorship, and/or publication of this article: This work was funded by Krouwer Consulting.