
Abstract
Introduction:
Lens autofluorescence is increased in patients with diabetes mellitus, but clinical application has been limited by the lack of an instrument suitable for routine clinical use. We investigate possible uses of a new scanning confocal biomicroscope (1) to identify subjects with undiagnosed type 2 diabetes and (2) as a marker for the progression of diabetes.
Methodology:
One hundred seventy-eight subjects self-reported as normal and 53 subjects physician-diagnosed with diabetes or prediabetes were recruited. Measurements were collected using a ClearPath DS-120 Lens Fluorescence Biomicroscope calibrated with standards traceable to National Institute of Standards and Technology (NIST).
Results:
Fluorescence intensities were corrected for age by subtracting the value expected from a regression of intensity versus age for normal subjects. This “fluorescence deviation” showed progressively higher values for normal, prediabetes, type 2 diabetes, and type 1 diabetes and a high degree of predictability of diabetes diagnosis. A receiver operating characteristics curve was used to determine sensitivity and specificity for prediction of diabetes type 2. At a fluorescence deviation of 2500, a sensitivity of 67% at 94% specificity was observed detection of type 2 diabetes.
Discussion:
The progressively higher fluorescence deviations are consistent with the physiological mechanisms of accumulation of fluorescent advanced glycation end products as the subject ages. The sensitivity and specificity performance of the lens autofluorescence test for type 2 diabetes is comparable to the performance of glucose threshold tests.
Conclusion:
The statistically significant difference between fluorescence deviations of normal and type 2 diabetes supports the feasibility of lens autofluorescence to screen subjects for undiagnosed type 2 diabetes. Ophthalmic practices are points of care at which there may be a public health benefit for screening patients for undiagnosed diabetes.
Keywords
Studies of the autofluorescence of the human crystalline lens have established that lens autofluorescence intensity increases with the age of the subject1-4 and that lens autofluorescence is further increased in patients with diabetes mellitus.5-10 Within the diabetic patient population, lens autofluorescence is correlated with duration of diabetes and average blood glucose levels, 9 with the development of the ocular pathologies of cataract and retinopathy,11-13 and with the systemic pathologies that characterize diabetes. 14
However, the clinical application of lens autofluorescence has been limited by the lack of an instrument capable of making noninvasive measurements at the point of care in a routine clinical setting. Freedom Meditech, Inc has received US marketing clearance for a scanning confocal biomicroscope that rapidly measures lens autofluorescence without dilation of the pupils. 15 Our previous study of lens autofluorescence of 127 subjects with healthy eyes who had not been diagnosed with diabetes showed a linear relationship of lens autofluorescence with the age of the subject, 15 a result consistent with previous reports.3,6,16
We wish to investigate 2 possible clinical uses of our instrument: (1) to identify subjects with undiagnosed type 2 diabetes and (2) to measure lens autofluorescence as a marker for the progression of diabetes. To establish the feasibility of conducting controlled clinical studies to demonstrate these utilities, we conducted a pilot study to confirm the hypothesis that the lens autofluorescence measurement reported by this instrument was capable of distinguishing subjects with a known history of diabetes from subjects with no history of diabetes. In this pilot study, we supplemented the previous data set from 127 subjects with measurements on an additional 51 subjects who also self-reported as not having diabetes and with 53 subjects with known histories of type 1 diabetes, type 2 diabetes, or prediabetes (impaired glucose tolerance).
Methods
Biomicroscope
As previously described, 15 the ClearPath DS-120® Lens Fluorescence Biomicroscope (Freedom Meditech, Inc, San Diego, CA) optical system consists of a blue (465 nm) Light Emitting Diode (LED) excitation light with (430-470 nm) band pass filter, source and collection focusing optics, motor driven filter wheel with 25% neutral density and long pass (500-1650 nm) filters and a silicon photomultiplier light detector. In addition, there is a red blinking LED target fixation light positioned within red blinking concentric rings to aid the patient in self-alignment, 3 infrared LED lights positioned around the optics window to illuminate the eye, and a video camera. Stepper motors control the optics window horizontal motion, chin rest motion, filter wheel rotation, and the optical focus point for x, y, z positioning. The biomicroscope is controlled by a laptop computer with software that includes an automatic tracking program for positioning the pupil. The system automatically aligns its optical axis before a measurement is taken. The instrument can report either green fluorescence intensity or the ratio of green fluorescence to scattered light.
The instrument is calibrated with reference standards traceable to the National Institute of Standards and Technology (NIST). Clinical precision studies show approximately 7.5% coefficient of variation for the fluorescence intensity measurements reported here.
Human Participant Selection Criteria
Each participant signed an informed consent document and filled out a health questionnaire. The following criteria were used to select patients:
Inclusion Criteria for Normal Subjects
Persons is between the ages of 21 and 70 years.
Subject does not have type 1 or type 2 diabetes, as reported on the health questionnaire.
Subject has healthy eyes, as determined by the optometrist.
Inclusion Criteria for Diabetic Subjects
Person is between the ages of 21 and 70 years.
Subject must have healthy eyes (self-reported).
Physician reports that subject has type 1, type 2, or prediabetes diagnosis.
Exclusion Criteria for All Subjects
Subject has had the crystalline lens removed from the test eye or has had the crystalline lens removed and replaced with an intraocular lens (IOL) implant in the test eye.
Subject has had a fluorescence angiogram within the past 6 months.
Subject has undergone a treatment using photodynamic drugs within the past year.
Subject has been clinically diagnosed with cataracts in the test eye, with any sign of opacification.
Subject has ocular surface (dry eye) disease.
Human Participant Recruitment
The 127 normal subjects were recruited from an optometry practice in La Jolla, California; these subjects underwent an eye examination by an optometrist before being tested with the study device. An additional 51 normal subjects with self-reported healthy eyes were recruited in the course of the performance optimization studies carried out at a Freedom Meditech facility. The 53 diabetic subjects were recruited from an endocrinology practice in La Jolla, California. These subjects were diagnosed by the physician as having type 1 or type 2 diabetes or prediabetes and were self-reported as having healthy eyes.
Fluorescence Intensity Measurement
Subjects were scanned up to a maximum of 8 scans; however, testing was terminated after 5 successful scans on the subject. A successful scan is one for which the instrument reports a fluorescence value instead of an error code (eg, if the subject blinks). The fluorescence intensity values are reported as detector counts.
Statistics
Measurements were made with 1 prototype instrument. The subjects varied in the number of replicate measurements taken; replicate measurements were averaged for each subject. No weighting adjustment was made for the different numbers of replicate measurements.
Data were analyzed with SPSS version 21 software on Mac OS X version 10.8.
Limitations of the Study
Because the normal subjects were self-reported as healthy and their blood glucose was not measured as a part of this study, we cannot exclude that some of the normal subjects may have had diabetes or prediabetes. Possible bias caused by the possibility of undiagnosed diabetes among these subjects is described in the discussion section below. Due to incomplete data, results are not adjusted for smoking.
Results
Demographics
Demographic characteristics of the study subjects are shown in Table 1.
Age, Sex, and Weight by Diabetes Status of Subjects.
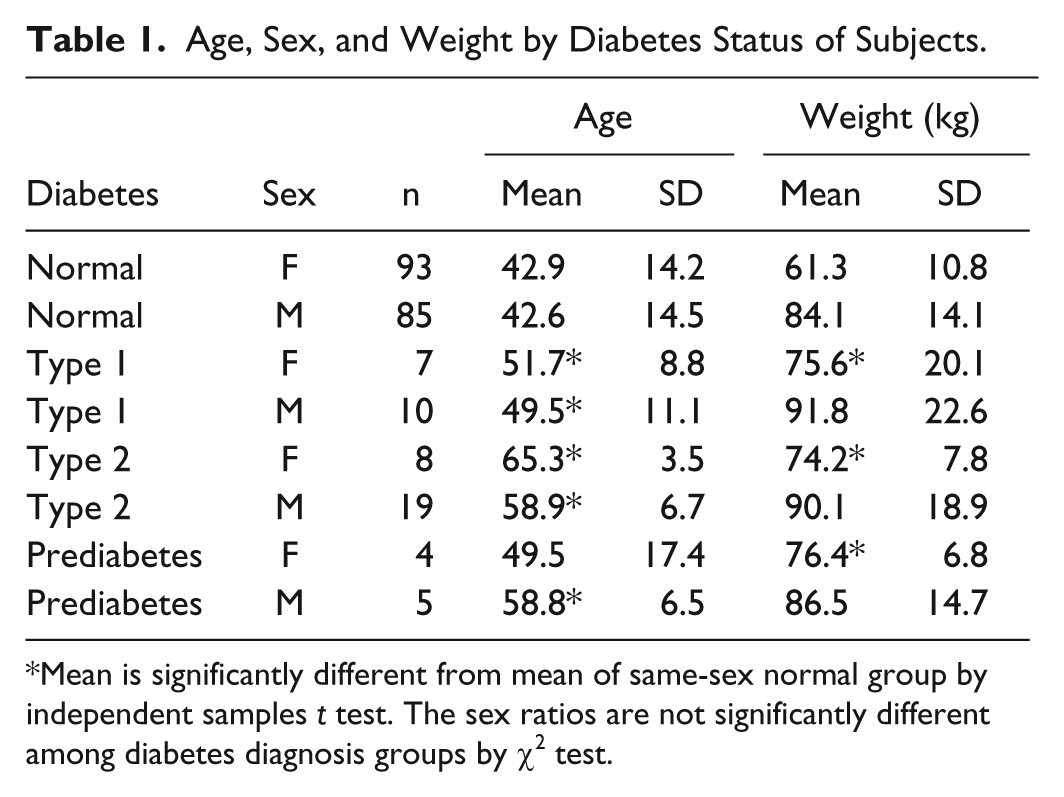
Mean is significantly different from mean of same-sex normal group by independent samples t test. The sex ratios are not significantly different among diabetes diagnosis groups by χ2 test.
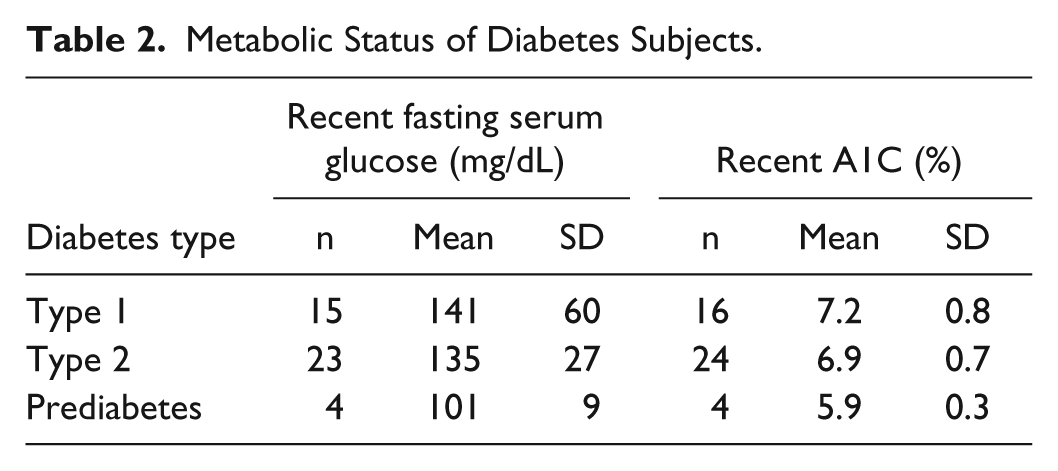
Table 2 shows available data on the metabolic status of the diabetes subjects.
Metabolic Status of Diabetes Subjects.
Fluorescence Intensity Values
A linear regression of fluorescence values versus age for 178 normal subjects is shown in Figure 1. (A weighted regression was also performed, with weights based on previous observations that the standard deviation of the residuals is proportional to age.6,8 However, the weighted regression line was not materially different from the unweighted regression line shown here.)
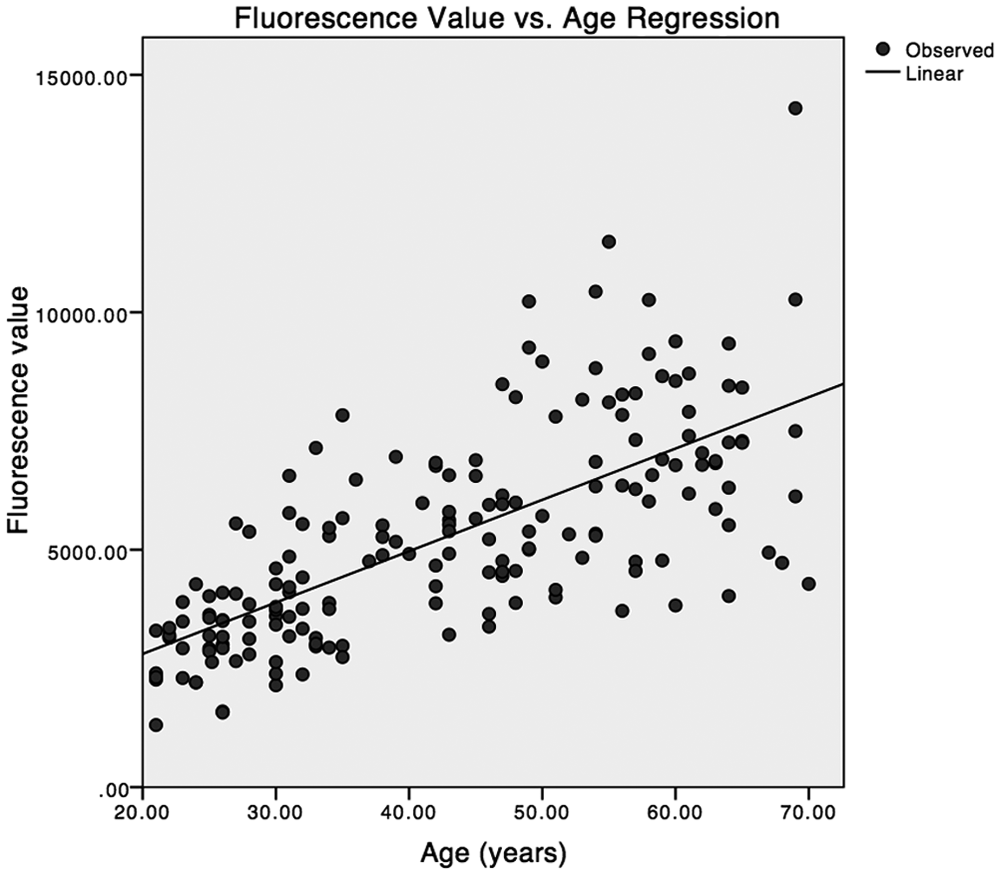
Regression of fluorescence value versus age for 178 normal subjects.
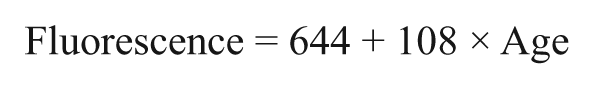
Analysis of variance (ANOVA) showed that for normal subjects a linear regression of fluorescence intensity with subject age is highly statistically significant with R2 = .492 and that a quadratic term did not reach statistical significance. The regression equation is,
The fluorescence values of both normal and diabetic subjects were then corrected for the influence of age by subtracting the mean expected fluorescence for a normal subject of the same age from the mean fluorescence intensity measurement for each subject. This difference is termed the “fluorescence deviation” of the subject.
Fluorescence Deviation
Distributions of the fluorescence deviation for each diabetes classification are shown as boxplots in Figure 2. There is a progression of the median fluorescence deviation (horizontal line in the box) from normal, to prediabetes, diabetes type 2, and diabetes type 1. While there is overlap in the ranges of the classifications, the box (representing the 2 central quartiles) for normal subjects does not overlap the boxes for subjects with diabetes classifications. These results suggest the lens autofluorescence measurements are capable of discrimination between normal and diabetic subjects.
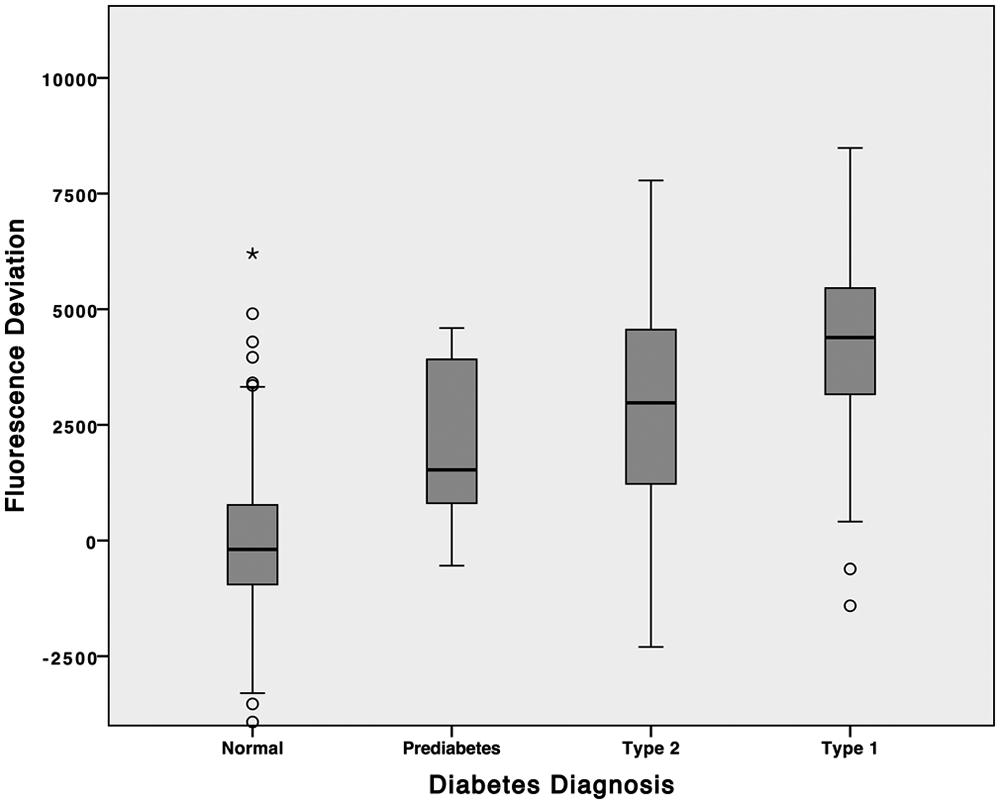
Box plot comparisons of fluorescence deviation distributions.
This discrimination is confirmed by 2-sided independent samples t test that show that the mean fluorescence deviation for each diabetes population is significantly different from that of the normal population (Table 3). ANOVA (not shown) also shows a statistically significant difference between the mean fluorescence deviations of type 1 and type 2 diabetic subjects, but not between type 2 and prediabetic subjects.
Mean Fluorescence Deviation and t Tests for Diabetic and Normal Subjects.
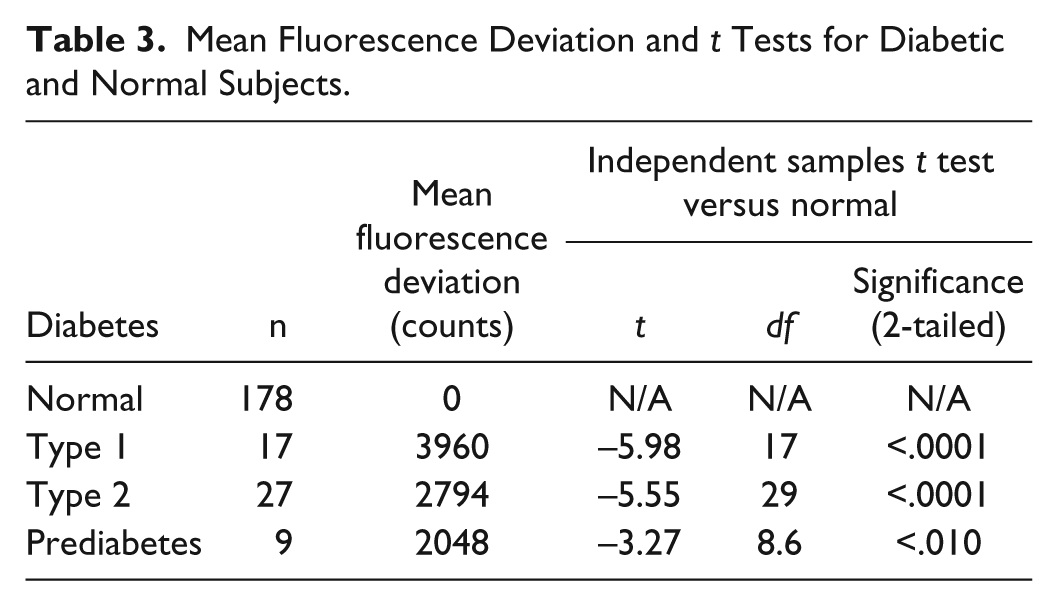
The Eta measure of association is .58, confirming a high degree of predictability of diabetes diagnosis from the fluorescence deviation.
Sensitivity and Specificity for Fluorescence to Distinguish Type 2 Diabetes From Normal
The sensitivity and specificity for a prediction of a type 2 diabetes diagnosis from fluorescence deviation in a mixed population of normal and type 2 subjects can be expressed in a receiver operating characteristics (ROC) curve; subjects with type 1 diabetes or prediabetes were excluded from this calculation. The ROC curve for prediction of type 2 diabetes diagnosis is shown in Figure 3.
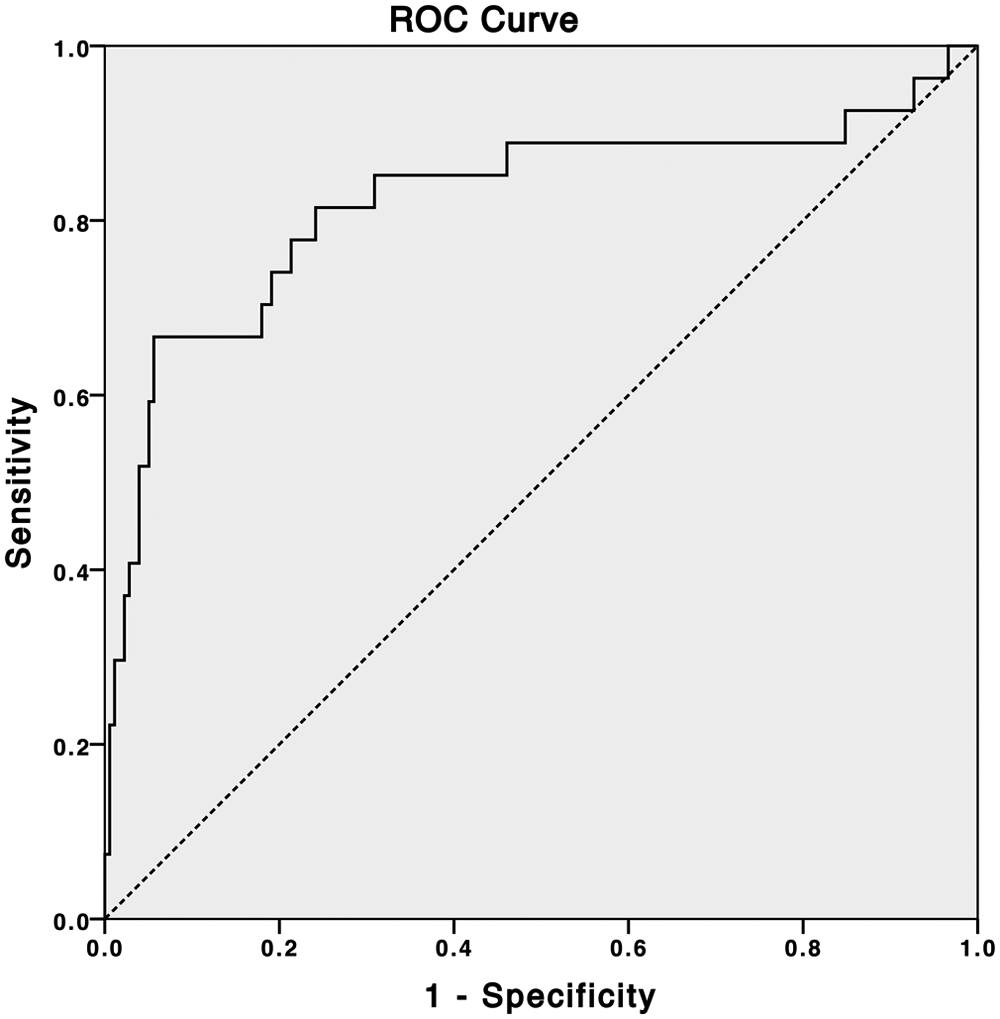
Receiver operating characteristics curve for prediction of type 2 diabetes diagnosis from fluorescence deviation.
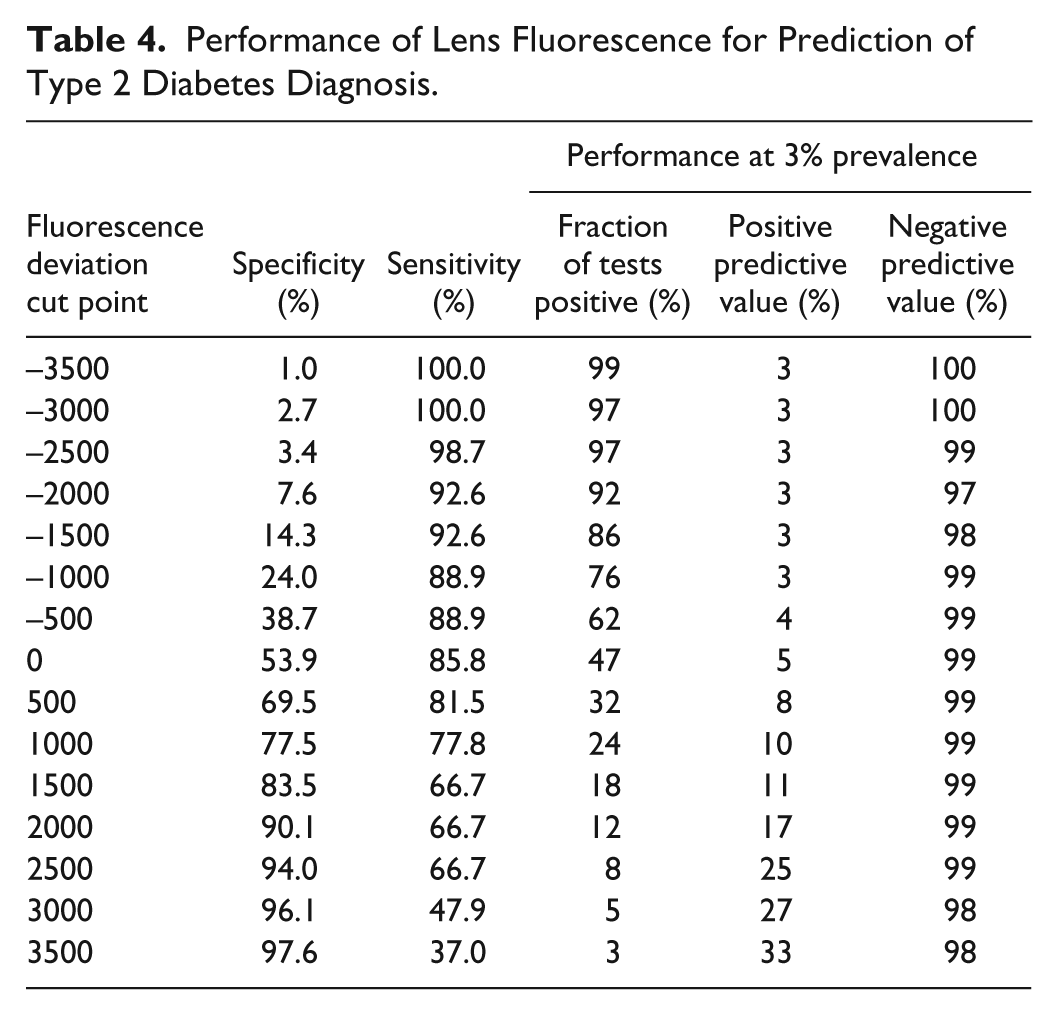
Table 4 shows the sensitivity and specificity values from the ROC curve (Figure 3) at a range of cutoff values for the fluorescence deviation. At a fluorescence deviation of 2500, a sensitivity of 67% at 94% specificity was observed detection of type 2 diabetes. Also shown are positive and negative predictive values calculated for a 3% prevalence of undiagnosed diabetes (see the discussion).
Performance of Lens Fluorescence for Prediction of Type 2 Diabetes Diagnosis.
Discussion
The physiological basis of lens autofluorescence is the accumulation of “advanced glycation end products” (AGEs) in the lens protein as the subject ages. AGEs are a heterogeneous family of yellow-brown and fluorescent proteins that have been modified by glycation: a nonenzymatic reaction of reducing sugars with free amino groups of proteins that is followed by irreversible reactions. 17 In addition to fluorescence, AGEs create protein cross-links. Although most proteins in living systems turn over with sufficient rapidity to avoid significant accumulation of AGEs, some, such as lens crystallins, nerve myelin, and skin collagen, are long-lived, and AGEs accumulate in these proteins over a lifetime.17,18 Because glycation is initiated by free-reducing sugars, diabetic subjects have an accelerated accumulation of AGEs in tissues,19-27 which is postulated to be a key mechanism for the ocular, vascular, and other complications of diabetes.28-31
Use of lens autofluorescence to screen for diabetes was studied by Koefoed Theil et al in 14 patients with newly diagnosed (<6 months) type 2 diabetes and 11 age-matched control subjects. They observed a statistically significant increase in lens autofluorescence in the diabetic patients, and they were able to predict diabetes with 79% sensitivity and 100% specificity. 32 In a subsequent study on 218 subjects with self-reported good health, lens fluorometry, HbA1c, and oral glucose tolerance tests were performed and 12 subjects with prediabetes and 10 with type 2 diabetes were identified. Progressively higher lens autofluorescence was observed in prediabetic and diabetic subjects, but the results were not statistically significant. 33 However, Munch et al 34 found that lens fluorescence was increased by 7.5% in subjects with impaired fasting glucose, by 13.0% in subjects with combined impaired fasting glucose and impaired glucose tolerance, and by 11.8% in subjects with screen-detected diabetes compared to normoglycemic subjects, adjusted for age, sex, and smoking.
Our data showed a high degree of predictability for diabetes diagnoses from the lens autofluorescence measurements, and progressively higher fluorescence deviations for the diagnoses of prediabetes, type 2 diabetes, and type 1 diabetes. This progression is consistent with the physiological mechanisms discussed above since type 1 diabetes typically develops in childhood, type 2 develops in middle age, and prediabetes represents an intermediate status between normal and type 2 diabetes. Thus, subjects with type 1 diabetes typically have a longer duration of the disease and a greater opportunity to accumulate AGEs than subjects with type 2.
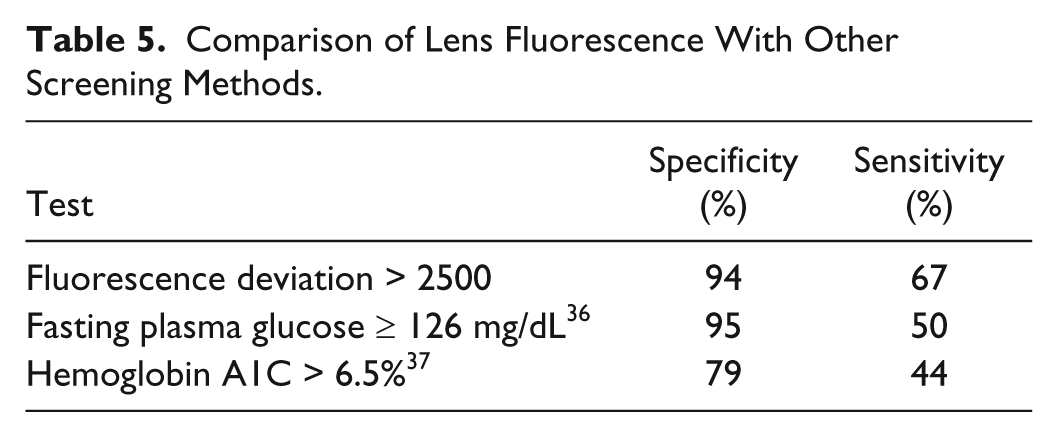
The test currently recommended by the American Diabetes Association (ADA) for screening for undiagnosed diabetes is fasting plasma glucose at a cut point of 126 mg/dL. 35 The sensitivity of this fasting plasma glucose test is about 50% at a specificity of 95% when a 2-hour postload oral glucose tolerance test (OGTT) with a cut point of 200 mg/dL is used as a reference method. 36 Hemoglobin A1C is a test for protein glycation that has recently been endorsed by the ADA for diagnosis of diabetes; 34 the sensitivity and specificity of hemoglobin A1C with a cut point of 6.5% has a sensitivity of about 44% and a specificity of 79% in older populations. 37 Table 5 compares the sensitivity and specificity performance of these established tests for type 2 diabetes with that of the lens autofluorescence test; the lens autofluorescence test achieves equivalent performance at a fluorescence deviation cut point of 2500 (see Table 4).
Comparison of Lens Fluorescence With Other Screening Methods.
As discussed above, both lens autofluorescence and diabetic complications, such as retinopathy, are believed to result from the accumulation of AGEs in tissues. This hypothesis predicts an underlying correlation between lens fluorescence and the development of retinopathy, and Munch et al 13 have observed a strong association between lens autofluorescence and retinopathy. While the cutoff points for glucose threshold and A1C for diabetes diagnosis are based in part on their correlation with retinopathy,35,38 there is a substantial discordance among these diagnostic criteria, 37 and their predictive values for retinopathy are inherently limited because they don’t depend on diabetes duration, which is also strongly correlated with retinopathy. 38 Thus, prevalence of retinopathy at the time of diagnosis of type 2 diabetes is greater than 20% in the United States, and it is estimated that the onset of retinopathy occurs 4 to 7 years before diagnosis. 39 Lens autofluorescence not only has the potential to account for the prediagnostic duration of diabetes, 13 but also could turn out to have advantages in sensitivity for the specific metabolic disorders that cause diabetic complications.
Of course, glycation, whether measured by A1C or by lens autofluorescence, does not provide information on the instant plasma glucose concentrations that, in addition to being the standard criteria for diabetes diagnosis, are critical for monitoring and controlling diabetes by diet and drugs. 40 Thus, glycation data are complimentary to plasma glucose or PreDx™ 41 test data.
Our results may underestimate the potential performance of the lens autofluorescence test because of the methodology of our study: Our normal subjects were self-reported not to have diabetes, however the study protocol did not include the ability verify that they were not diabetic. Prevalence of undiagnosed diabetes in these subjects would contribute a negative bias to the specificity we report. Our sensitivity data may also have a positive or negative bias since a population already under medical care for a diabetes diagnosis and may have a different history of blood glucose levels then the population of undiagnosed diabetic subjects that would be the target for opportunistic screening. We expect to verify the performance and economics of the lens autofluorescence test in controlled population-based studies. Also, we were not able to adjust for the effects of smoking on lens autofluorescence, which may be another source of bias.
The predictive value and economic feasibility of a screening test for type 2 diabetes depends on the prevalence of diabetes. According to the NHANES 1999-2002 population study, the prevalence in the US adult population was 6.5% for diagnosed diabetes and 2.8% for undiagnosed diabetes. 42 Excluding diagnosed diabetics from the population to be screened, the prevalence of undiagnosed diabetes would be 3% in the subjects eligible for screening. Using these sensitivities and specificities and a 3% prevalence, the fraction of tests that will be scored as positive (selected for follow-up), the positive predictive value (PPV), and the negative predictive value (NPV) of the test are shown in Table 4. For example, if on average 100 patients who report that they have not been diagnosed with diabetes were screened by the lens autofluorescence measurement, prevalence data suggest 3 would be expected to have undiagnosed diabetes. If a fluorescence deviation of 2000 were chosen as the threshold, an average of 12 out of 100 subjects would be referred for definitive testing. If all of them receive the gold standard test, 2 would be expected to be confirmed with diabetes; this scenario detects 2 of the 3 cases of type 2 diabetes.
As previously described, 15 the biomicroscope collects both fluorescence and light scattering data to compute a fluorescence ratio. The precision of the biomicroscope was characterized using 3 instruments and 3 operators in studies required for FDA market clearance. Repeatability of 5.8% and reproducibility of 6.4% were measured in the ratio mode; for the results reported in this report, only the fluorescence intensity data from a single instrument were used and repeatability was 7.5%.
Conclusion
An objective of our study was to assess the feasibility of lens fluorescence to screen subjects opportunistically for type 2 diabetes; opportunistic screening exploits a health care encounter that was scheduled for some other purpose to conveniently conduct a test that the subject did not plan for. A lens fluorescence test is rapid (6 seconds), is noninvasive, does not require fasting or any other preparation by the patient, and is suitable for most patients without cataract or lens replacement surgery. Furthermore, sharps and their associated pain, assay materials, biohazard waste, and their management and disposal are eliminated. The statistically significant difference between fluorescence deviations of normal and type 2 diabetes subjects that we observed supports the feasibility of lens autofluorescence to screen for subjects at risk for undiagnosed type 2 diabetes. Lens fluorescence also has a potential to contribute to better understanding of diabetes classification and diagnosis.
We propose that there may be a public health benefit to use lens autofluorescence for opportunistic screening of patients for undiagnosed diabetes. Target subpopulations would include individuals with aversion to blood draw or those who do not frequently go to a primary care provider. High traffic access points such as pharmacies and minute clinics provide opportunities for a noninvasive test. However, we suggest that ophthalmic practices are points of care at which there are unique advantages: Typically, both presbyopia and type 2 diabetes develop in middle age; thus, an ophthalmic practice may have a patient population that is enriched for undiagnosed type 2 diabetes. Also, in the United States and many other countries, many people do not have access to regular preventative medical care, and a visit to an ophthalmic practice may be their first encounter with a provider with a professional concern with complications of untreated diabetes (due to the risk of potentially blinding diabetic retinopathy). This profession is familiar with similar instrumentation and their standard of care guidelines include annual follow-up examinations for patients diagnosed with diabetes.
Footnotes
Abbreviations
ADA, American Diabetes Association; AGE, advanced glycation end products; ANOVA, analysis of variance; LED, light emitting diode; NIST, National Institute of Standards and Technology; NPV, negative predictive value; OGTT, oral glucose tolerance test; PPV, positive predictive value; ROC, receiver operating characteristics.
Declaration of Conflicting Interests
The author(s) declared the following potential conflicts of interest with respect to the research, authorship, and/or publication of this article: FC is a consultant for Freedom Meditech, Inc. JB, KI, and SM are employees of Freedom Meditech, Inc.
Funding
The author(s) disclosed receipt of the following financial support for the research, authorship, and/or publication of this article: This work was funded by Freedom Meditech, Inc.