
Abstract
Objective:
A prototype tear glucose (TG) sensor was tested in New Zealand white rabbits to assess eye irritation, blood glucose (BG) and TG lag time, and correlation with BG.
Methods:
A total of 4 animals were used. Eye irritation was monitored by Lissamine green dye and analyzed using image analysis software. Lag time was correlated with an oral glucose load while recording TG and BG readings. Correlation between TG and BG were plotted against one another to form a correlation diagram, using a Yellow Springs Instrument (YSI) and self-monitoring of blood glucose as the reference measurements. Finally, TG levels were calculated using analytically derived expressions.
Results:
From repeated testing carried over the course of 12 months, little to no eye irritation was detected. TG fluctuations over time visually appeared to trace the same pattern as BG with an average lag times of 13 minutes. TG levels calculated from the device current measurements ranged from 4 to 20 mg/dL and correlated linearly with BG levels of 75-160 mg/dL (TG = 0.1723 BG = 7.9448 mg/dL; R2 = .7544).
Conclusion:
The first steps were taken toward preliminary development of a sensor for self-monitoring of tear glucose (SMTG). No conjunctival irritation in any of the animals was noted. Lag time between TG and BG was found to be noticeable, but a quantitative modeling to correlate lag time in this study is unnecessary. Measured currents from the sensors and the calculated TG showed promising correlation to BG levels. Previous analytical bench marking showed BG and TG levels consistent with other literature.
Background
Diabetes mellitus (DM) affects more than 347 million people worldwide, with negative health side effects most often occurring when patients do not take care of their disease. 1 These millions of diabetes patients rely on self-monitoring of blood glucose (SMBG) using handheld test strips to maintain healthy blood glucose (BG) levels and to prevent the complications caused by uncontrolled hyperglycemia. It is these complications that cause the overwhelming majority of morbidity and mortality associated with DM, making control of blood sugar essential to reducing the risk of complications. 2 Consequently, SMBG has become standard of care in all patients with DM. 3
Most commonly used SMBG technology is invasive, that is, the patient is required to use a lancet to pierce the skin to obtain a sample for direct estimate of BG concentration. The pain and inconvenience associated with current SMBG technology often discourage patients from conducting the needed testing, causing noncompliance. 4 The development of a convenient, noninvasive glucose-monitoring system for daily measurements has the potential to improve the process of diabetes care by encouraging more frequent testing of BG levels. It can also provide an alternative or supplement SMBG for diabetic patients.
Glucose has long been known to be present in tear fluid (TF), making TF a particularly attractive alternative sampling source for glucose detection. 5 While there are still many challenges to overcome, self-monitoring of tear glucose (SMTG) has been heavily studied because of its potential painless and noninvasive approach.6-8 However, collecting enough TF to even obtain a suitable testing volume in a glass capillary can take upward of 5 minutes 1 and can be unpleasant for the patient. Tear glucose level is also significantly lower than the BG level, and a clinical correlation between them has not yet been fully established. We have previously reported on development and design of a sensor that employs use of a soft polyurethane foam plug and casted microfluidic as a noninvasive method of capturing TF.9-10 The design utilized glucose dehydrogenase-flavin adenine dinucleotide (GDH-FAD) along with a ferricyanide redox mediator. 11 Data indicate that GDH-FAD compares favorably to glucose oxidase (GOx) in many sensor-relevant attributes and may enable measurement of glucose concentrations both higher and lower than those measurable by GOx. Initial studies showed GDH-FAD provided signal strength orders of magnitude higher (for the same enzymatic activity level) than GOx. Moreover, other than xylose, the GDH-FAD system is specific for glucose. 11 A correlation between tear glucose (TG) and BG has also been found in our previous work. 10 This article reports on preliminary animal studies utilizing a prototype sensor, performing preliminary assessment to safety, lag time, and correlation of TG and BG.
Methods
Study Design
G*Power 3.1 software was used to calculate the required sample size. 12 The protocol used was the F test linear multiple regression with a fixed model, testing R2 deviation from zero. This protocol requires 4 test parameters: alpha, beta, effect size, and number of predictors. Alpha, or the probability of a Type I error, represents the risk that the trial will mistakenly show that the device is acceptable when it is in fact deficient. Beta, or the probability of a Type II error, represents the risk that the study will fail to detect the usefulness of the device. The effect size is the strength measurement for a relationship between 2 variables. The number of predictor was set at 1 because the glucometer readings are based only on blood or TG levels while all other factors are considered as noise. The null hypothesis was that no correlation between data sets with a probability of alpha and a correlation with a probability of (1-beta). The goal of this statistical design was to find a sample size that rejects the null hypothesis, determining that there is a correlation between the data sets.
Generally speaking, as the result of Type I error, a recall is often deployed to salvage a company’s reputation. Therefore, to estimate the alpha value, a recent recall from Johnson and Johnson that occurred in 2010 was studied. The recall cost the company around $500 million with $3.7 billion in sales,13-14 which was 13.5% of its sales. Compared to current trends in medical device start-ups, a small start-up company with a novel lachryglucometer as its only product might expect to make $300 million in sales. Assuming a linear proportional relationship between a company’s total sales and the cost of a recall for its key product, the cost of a recall for the lachryglucometer is $41 million. After consulting insurance adjusters for this industry, their rate for the lachryglucometer with $41 million worth of product recall liability is $30,000 per year. The quotient of these 2 numbers provides us with our alpha value of 0.000731.
Failing to recognize the value of the device due to a Type II error would mean the loss of all the potential sales of the product, as well as the money already sunk into development. Therefore, to estimate the beta value, after consulting venture capitalists who specialize in commercializing innovations early in the design cycle, a project of this scale would merit $10 million, if the early tests come back positive. This number is partially based on the mutual assessment of a $300 million market for a disruptive, pain-free BG monitoring system. The $10 million cost to access a $300 million market opportunity brings the value of beta to 0.0333.
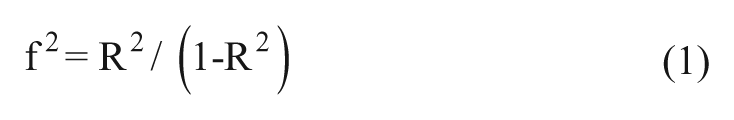
The effect size used by G*Power3.1 is Cohen’s f2. It is simply related to the correlation coefficient, R2, by equation (1).
To determine the ultimate effect size, the correlation coefficient must first be assessed. Since the best practice for evaluating the dependability of a glucometer in the industry is to pair its readings with those of a trusted device, such as a Yellow Springs Instrument (YSI) bench top glucose analyzer, and to superimpose the paired data on a Clarke error grid, 15 with the trusted readings on the x-axis and the test device’s readings on the y-axis. According to ISO standards, glucometers with at least 95% of their readings in the A or B zones of Clarke error grid are considered safe and effective. Using this requirement, the minimum R2 value was determined by trial and error using Microsoft Excel. It was done by generating random data sets with slopes of 1, domains and ranges of 0-200, and correlation coefficients ranging from .532 to .975, and observing what effect sizes were necessary to get the required proportion of the random points into the A and B zones. The result suggested that a R2 of .869 is necessary and the effect size of 6.633 was determined using equation (1). Keep in mind that the R2 value of .869 is only serving as a target R2 in the correlation study of BG and TG. The Clarke error grid is designed to evaluate clinical trials, and in this animal study, it was used only to determine strict parameters for future work. Last, using G*Power 3.1 and the parameters discussed above, an effect size of 11 was obtained.
To avoid an all-in failure, 2 animals were brought in to initiate the study and 2 more were brought in later. The earlier 2 animals went through a 12-month study and the latter 2 animals together with the previous 2 went through a 9-month study. The resulting study can be visualized with a flowchart design (Figure 1) and allowed for the testing of 3 key elements in the TG device development; namely irritation, TG-BG lag time, and TG-BG correlation. The study took place over a series of 4 phases. In phase 1, 2 animals were first trained and then tested for the purposes of eye irritation, basal testing, and preliminary TG-BG correlation. Phase 2 began as 2 more animals were brought into the study and all 4 animals were utilized. The 2 new animals were trained first then tested for eye irritation, basal testing, TG-BG correlation, and TG-BG lag time. As the animals became well trained and sufficient basal data were acquired, phase 3 began and the 4 animals were tested for eye irritation, TG-BG lag time, and TG-BG correlation. Last, similar procedures were performed in phase 4 and data were analyzed, summarized, and discussed for future work.
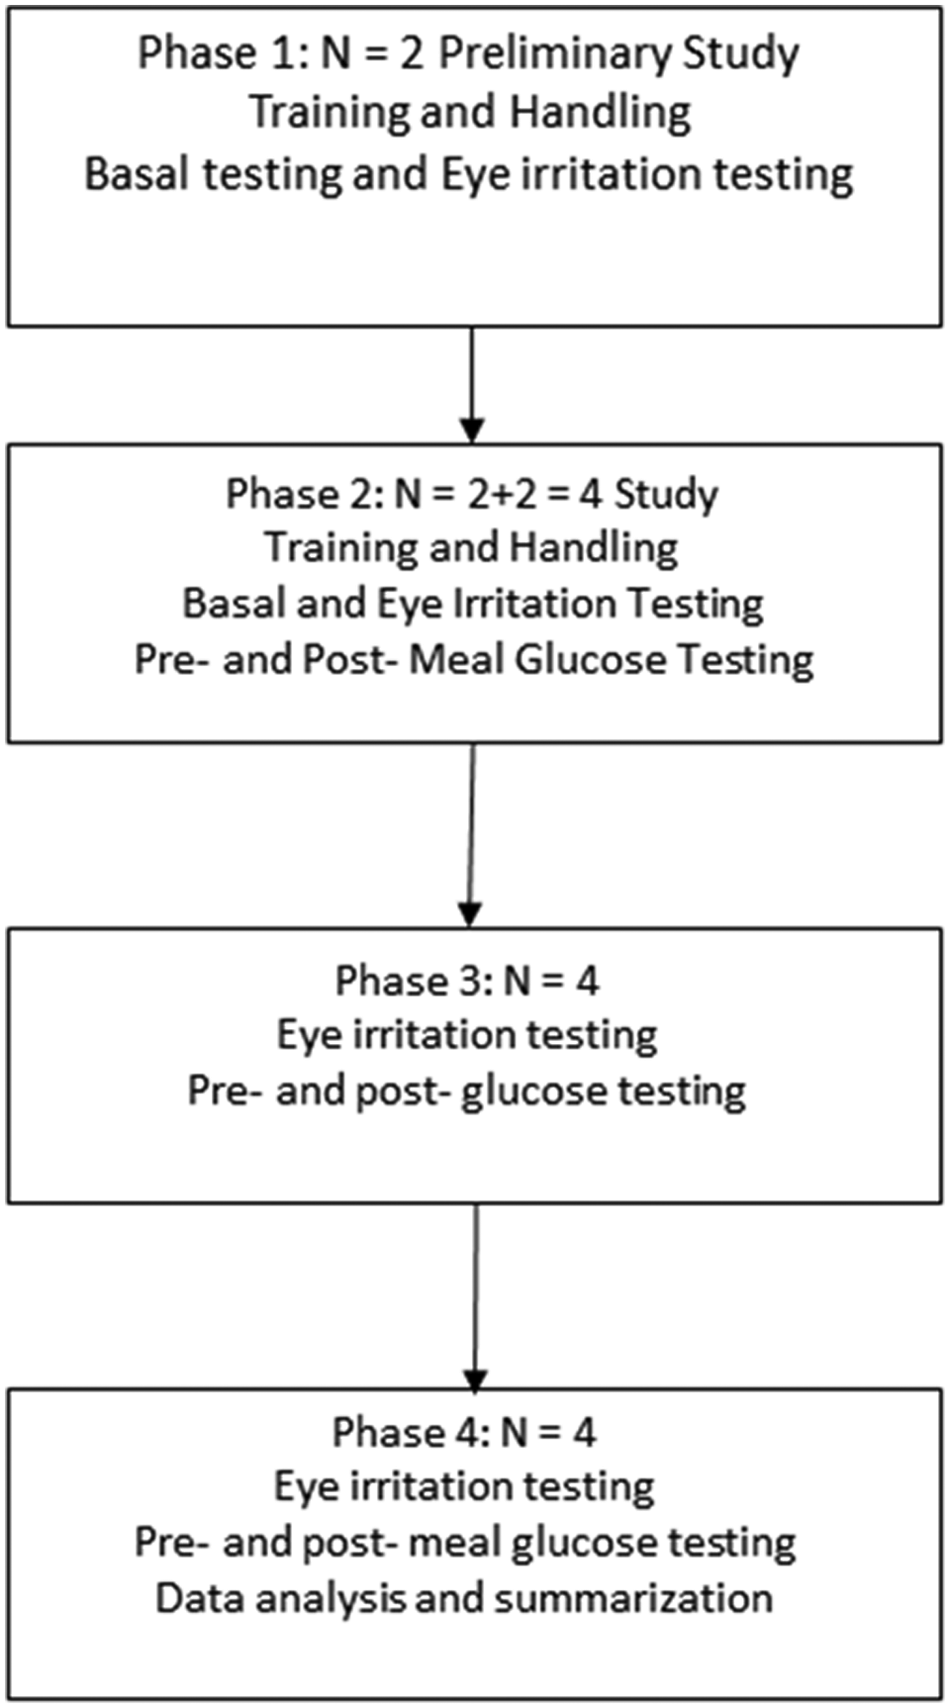
Proposed experimental design incorporating a 4-phase study. All animals went through training and basal testing first before the pre- and postglucose testing. Data collected were then analyzed and summarized at phase 4. The experiment began with 2 rabbits, and 2 more arrived after phase 1.
Animal Care and Husbandry
The study was conducted on 4 female New Zealand white rabbits (O. cuniculus) that were housed in vivarium cages and raised following standard procedures for this species. Institutional Animal Care and Use Committee protocol was followed for the duration of the study to ensure animal safety. During the weeks preceding the start of experimentation, each rabbit was regularly removed from her cage (minimum 2 times per week) and handled in a manner simulating the planned procedures, including touching the eye with a mock device prototype (screen-printed electrode [SPE] with polydimethylsiloxane [PDMS] fluidic and foam plug, without the injected reagents), so that the rabbits would become accustomed to the required touches and movements before actual data collection began. Since the former 2 rabbits were trained in phase 1, only the later 2 rabbits required training before the experimentation in phase 2. The rabbits were fed standard rabbit rations plus Timothy hay daily. During the weeks of data collection, the rabbits were circulated to be studied for 2 days a week and 6-8 times a day at most. The rabbit was also regularly released from her cage at other times during the week for enrichment.
Prior to each study, the rabbit was prepared by shaving 1 ear with an electric hair clipper to remove as much fur as possible on either side of the ear near the vein from which blood was to be drawn. The ear used was alternated between experiments on that same rabbit (eg, the right ear was used 1 week, the left ear the following week). The entire ear was then sterilized by a gauze wipe using chlorhexidine gluconate (Sigma-Aldrich, St. Louis, MO, USA). Topical Emla cream (2.5% lidocaine/prilocaine) was applied a few minutes before the initial blood draw as a local anesthetic. The rabbit was kept tightly bundled in a white towel throughout all procedures. In each experiment, blood was collected by either drawing from a needle and syringe or by inserting a catheter into the vein, which was taped in place for the duration of that day’s experiment (approximately 2 hours). Whenever a catheter was removed following an experiment, pressure was applied to the ear for at least 5 minutes to prevent later bleeding.
All tear sample collection was done using the right eye, leaving the left eye as a control to check for any irritation caused by the repeated measurements on the right eye. After each experiment, Lissamine green ophthalmic strips were wetted with saline drops and applied to each eye. The dye would concentrate in any scratches or other irritated spots on the ocular surface. Both eyes were then photographed with a digital camera for software analysis to assess any potential irritation. All procedures were preapproved by the Institutional Animal Care and Use Committee.
Sensor Composition and Manufacturing
All reagents were obtained from Sigma (St. Louis, MO, USA), unless otherwise noted. Glucose dehydrogenase-flavin adenine dinucleotide (GDH-FAD) with activity of 183 U/mg was generously donated by Amano Inc (Japan).
Prototype glucose test sensors were custom-made individually by gluing microfluidic sampling chambers made from Sylgard 184 PDMS elastomer (Ellsworth Adhesives, Germantown, WI, USA) onto Zensor™ SPEs with carbon-ink working and counter and Ag/AgCl reference (CH Instruments, Austin, TX, USA). The assembled prototypes were stored empty until just prior to use, at which time they were injected with the electrochemical reagents and a small polyurethane foam cylinder was added to the sampling tip on each PDMS chamber to enable tear collection.
The fluidic components for the sensors were prepared by casting the PDMS mixture in an acrylic/aluminum 2-piece mold on a hot plate at 195°C followed by cooling in a freezer at −20°C, to produce shaped PDMS pieces identical to those described by La Belle et al. 10 The PDMS was mixed in a 9:1 ratio of base to curing agent by weight. The cured fluidic pieces were cleaned with a Kimwipe dampened with isopropanol and air-dried. A thin layer of uncured PDMS mixture was then applied to the bottom of the cured PDMS fluidic piece, which was then placed onto a Zensor SPE, carefully aligning the circular chamber over the top of the electrode area bounded by the counter electrode of the SPE to create a channel for the tear sample to flow from the collecting point into a reaction chamber just above the electrodes. Each such assembly was baked in an oven at 60°C for 3-4 hours to cure the thin PDMS layer and secure the fluidic piece to the SPE base. The completed test strips were then injected by syringe just prior to use with a reagent solution consisting of 100 mM ferricyanide and 1 mg/mL GDH-FAD in phosphate buffered saline (PBS).
Cylindrical foam plugs of 0.125 inches in diameter were punched out of commercial cosmetic polyurethane foam (Target Corp, Minneapolis, MN, USA) and cut with a razor blade to a height of approximately 0.07 inches as closely as could be approximated by hand. For each test sensor, 1 such foam plug was placed in the sample-gathering chamber at the tip of the PDMS fluidic piece just after injection.
Fully prepared sensors consisting of reagent-filled fluidic/SPE structures topped with foam plugs were stored in an aluminum foil-covered petri dish and used promptly within 2 hours following reagent injection. Weights were recorded for each sensor before and after reagent injection, and then again after foam plug addition and 1 final time just after tear sample collection, to determine the amount of reagent and sample gathered as well as the size of the foam plug used on that sensor. These weights were used to screen out the most anomalous measurements and adjust the others to correct for differing reagent and sample volumes across measurements over the course of the study.
Eye Safety
According to a previous study, 16 Lissamine green dye staining is an effective way to estimate ocular cell death or irreversible injury. Therefore, Lissamine green dye was used to assess eye safety. Throughout the whole study, images were taken of the rabbits’ eyes with applied Lissamine green dye at the end of each experiment day. The images were analyzed using the red channel of a histogram in Photoshop. Since the green-blue channel was equivalent to the color of the Lissamine green dye, the red channel was selected to exhibit more significant changes in eye color. Comparisons were made between sites of application of the TG sensor and control sites on the left and right eye using the red histogram channel. As seen in Figure 2, each rabbit eye photo was cropped to have a similar eye size and adjusted to the same pixel size of 1000 × 800 pixels. A sample area on each eye was a 100 × 100 pixel marquee circle. From each sample area, the standard deviation in the red channel from the histogram (due to its greater changes than mean) was recorded for the nasal quadrant in the right eye, where the TG sensor was applied. The result was then compared to the standard deviation of a portion of the right eye that was not touched by a sensor. Finally, both of these measurements were compared to the standard deviation recorded from a sample area on the left eye (control), which was never touched by a sensor. The standard deviation of Lissamine green dye was used as a negative control to observe eye irritation and damage.
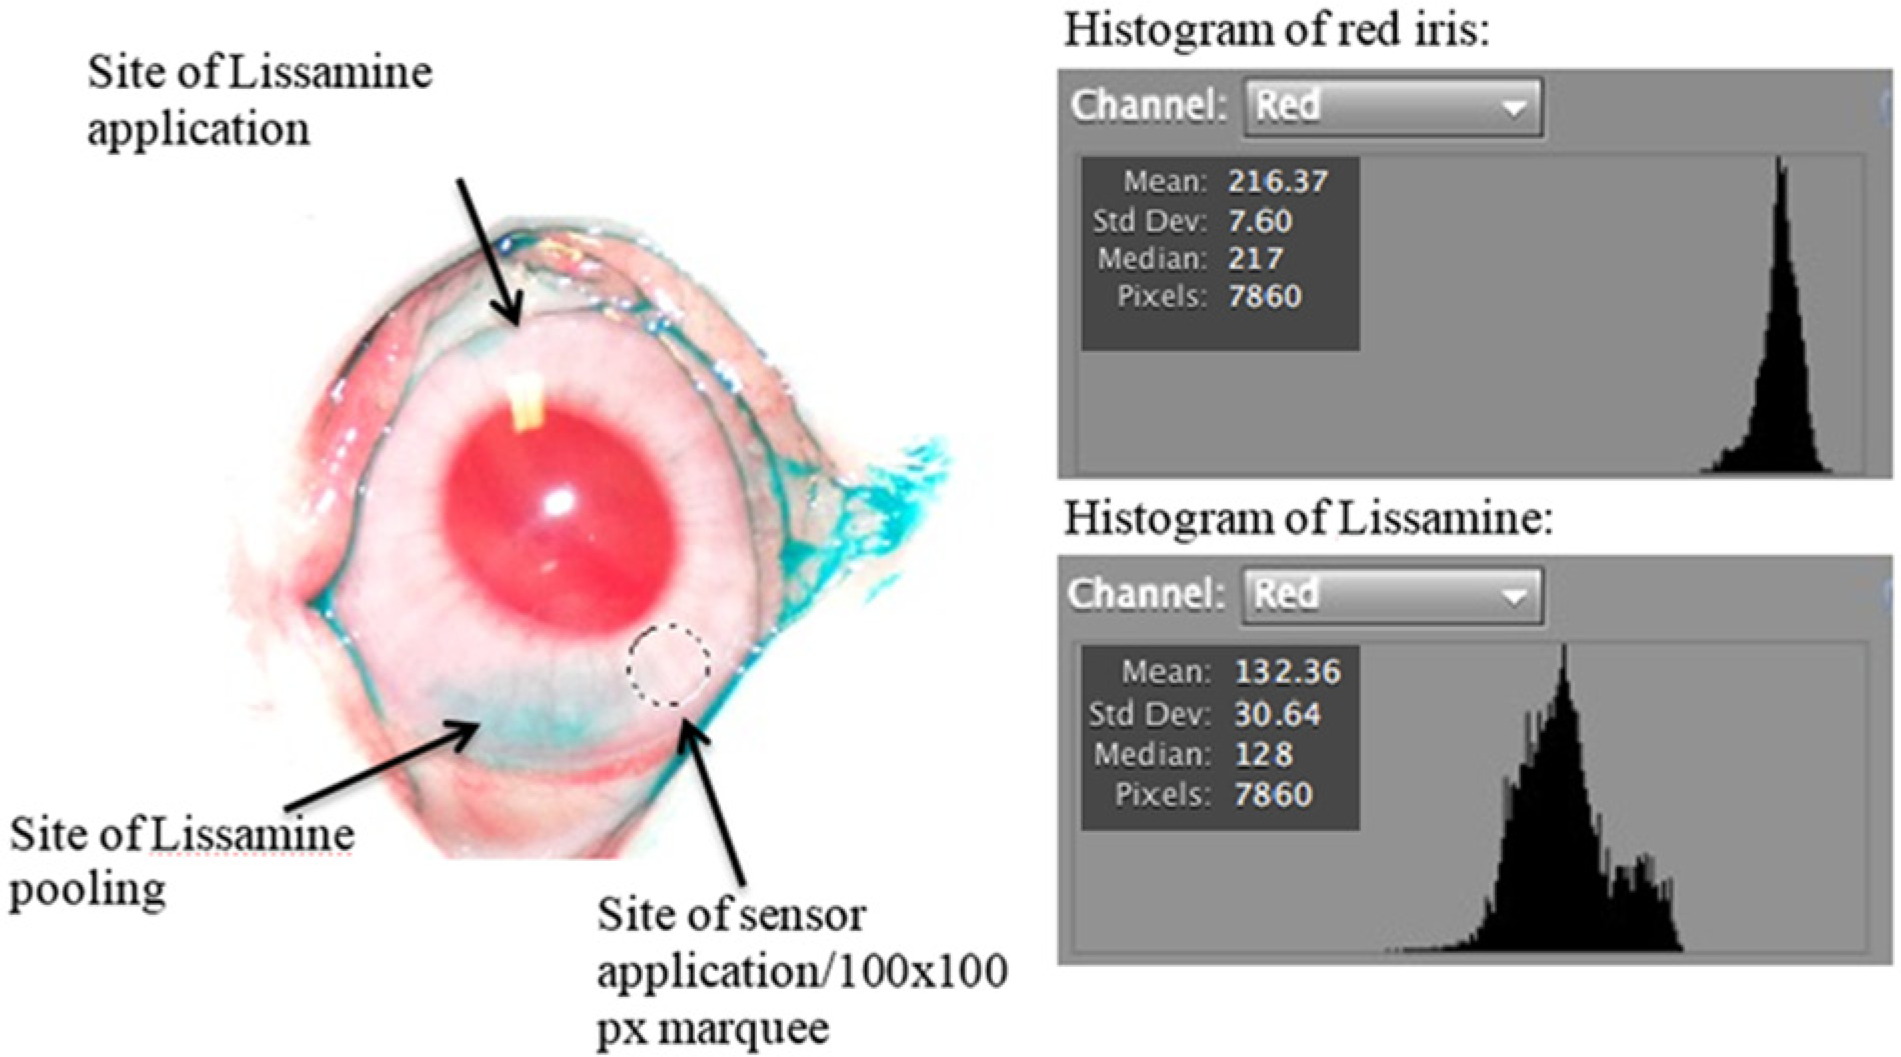
Example of rabbit eye after Lissamine green dye has been applied. Red channel was used to assess potential damage to the eye. Shown in the figure is what is perceived to be an area of Lissamine dye pooling, the site where the tear sensor was applied, and the site of Lissamine application. Also shown are the histograms and the standard deviation of the red iris and Lissamine, showing clear differences between an area of eye with no Lissamine and an area of eye with Lissamine. If the area is suspected to be damaged, an increase in standard deviation will be observed.
TG-BG Lag Time
For each TG measurement, a tear sample was collected directly using the prototype sensors by lightly touching the foam plug of the sensor to the conjunctiva of the rabbit’s right eye in the nasal quadrant, avoiding the iris and third eyelid as best possible. The sensor was held for approximately 10 seconds to allow the foam soak up TF. The sensor was then (after weighing on an analytical balance to ensure a minimal 0.0005 g increase) pumped with 10 hard finger presses on the top of the reagent-filled chamber to send the reagent liquid up to the foam holding the tear sample, allowing the TF to into the reagent. Immediately after pumping, the 3 SPE leads on the sensor were then connected to a CHI 1230 Electrochemical Workstation (CH Instruments, Austin, TX, USA) and an amperometric i-t curve was recorded at an applied voltage of +0.35 V. Based on previous studies,9-11 the current measurement at 10 seconds reflects TG levels (95% response time), and was taken as the “sensor signal” to be correlated with BG measurements.
For each BG measurement, a blood sample of approximately 0.5 mL was either drawn with a needle and syringe or allowed to drip out from a heparin-flushed catheter, and placed in a Microtainer® vial precoated with sodium fluoride and EDTA (Becton Dickinson, Franklin Lakes, NJ, USA), then quickly rotated so as to mix the blood sample with the NaF/EDTA preservatives. In the case of sampling from a catheter, to ensure the “freshness” of the blood sample, the first couple drops of blood were discarded before letting the next several drops flow into the Microtainer® vial. The glucose level in the sample was then measured 5 minutes after collection using a YSI 2300 Stat Plus™ Glucose & Lactate Analyzer (YSI Inc, Yellow Springs, OH, USA), to decrease the variation in time from sample collection to measurement over the course of the study. It was tested previously that the NaF/EDTA preservatives can effectively prevent the glycolysis and keep the glucose level constant for a sufficient period of time.
To measure the initial glucose level before the glucose challenge, an initial TG measurement was made immediately after the first blood draw. The TG measurement is in accordance with the TG measurement procedure described above. A stopwatch was initiated at the first needle stick of the first blood draw, which was considered to be t = 0 and was followed as quickly as possible by a corresponding TG measurement using the TG sensor. The YSI 2300 measurement of the first blood sample was taken at t = 5 minutes in accordance with the BG measurement procedure described above.
After the initial baseline measurements, the rabbit was fed 0.656 mL of corn syrup per kilogram of body weight (DACT, Arizona State University, Tempe, AZ, USA) to induce an increase in BG levels. Observations in the animal such as a stress response were recorded to account for any initial glucose spikes. Ten minutes after the sugar challenge, 1 blood sample was drawn with 1 tear sample taken immediately after the blood sample. BG and TG measurements were performed according to the procedures described above. From this point on, the sampling and glucose measuring procedures were then repeated approximately on a 15-20 minutes interval over a 2-hr experiment, resulting in 6-8 TG and BG measurements. The times at which samples were taken and measurements made were recorded for each data point. The 10 second amperometry currents measured from each tear sensor and the YSI 2300 BG readings were both plotted on the same time axis and interpolated with a cubic spline trace. The 2 curves were vertically scaled so as to overlap on the same graph and visually observed for patterns.
TG-YSI Correlation
Using the amperometric-glucose correlation found in previous study, 11 the current signals obtained from TG sensor were converted to glucose concentration by the best-fit regression line in equation (2).
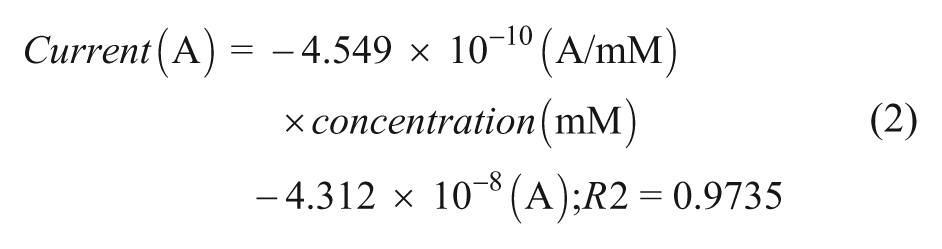
Corresponding points were then plotted against the YSI BG readings, forming a correlation diagram. These points were not adjusted to lag time. The goal is to test and see, even with the presence of lag time, if there can still be a sufficient correlation between TG and BG.
Results
Eye Safety
The average of standard deviations of the histograms for the nasal right eye quadrant (test site), right eye control, and left eye control were averaged and compared to the standard deviation Lissamine. As seen in Figure 3, the standard deviations obtained on test sites were significantly lower than that of the Lissamine, suggesting no Lissamine presence. The standard deviation on test site is also found relatively equal to that of the right eye control and left eye control, suggesting no Lissamine dye stain, and thus no irreversible cell injuries were found.
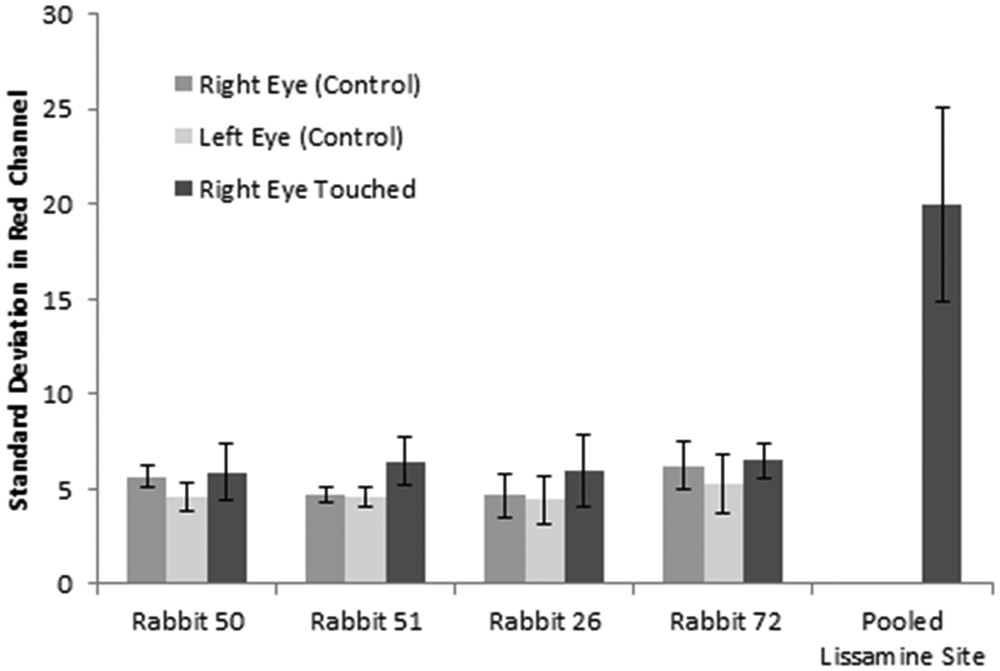
Compiled data from the eye safety testing with Lissamine green. The bars represent the 95% confidence interval for each measurement, with the bars showing the averaged standard deviations for the right eye touched (site of sensor application and tear sampling—nasal or temporal), right eye control (area of the right eye not touched by touched by the sensor), and left eye control (no tear sampling) and the area of the eye where all the dye pooled was used as a control (for maximal color channel intensity measurements) from all phases. Samples sizes were n = 16, n = 12, n = 8, n = 9, and n = 6, respectively. Compared to the right eye and left eye control, no significant increase in the standard deviations of the right eye touched was observed. The standard deviation of the pooled Lissamine site served as a negative control.
TG-BG Lag Time
Using the amperometric-glucose relationship found in previous study, 11 the current measurements were converted to glucose levels, then plotted with the YSI BG measurements with respect to time. A time-based response for a single animal is presented (Figure 4). Data show baseline and postglucose load values obtained from TG sensor and YSI. BG and TG levels tracked one another with a noticeable time delay. Initially BG rose quickly within 10 minutes of glucose load. After 15 minutes, a high BG reading was measured and TG followed 5 minutes later. Studies were conducted on rabbits until the BG started to decline back down to baseline levels so we could watch how the TG responded. Various lag times across different subjects were identified. Initially, a range of lag time was observed with a few experiments and some faulty data points. Faulty data points occurred due to personnel mishandling, manufacturer errors, and test subject misbehavior. However, with all the studies done, and faulty data points removed, further analysis of all pre- and postglucose experiments (a total of 25 experiments) indicated an average lag time of 13 minutes between BG and TG.
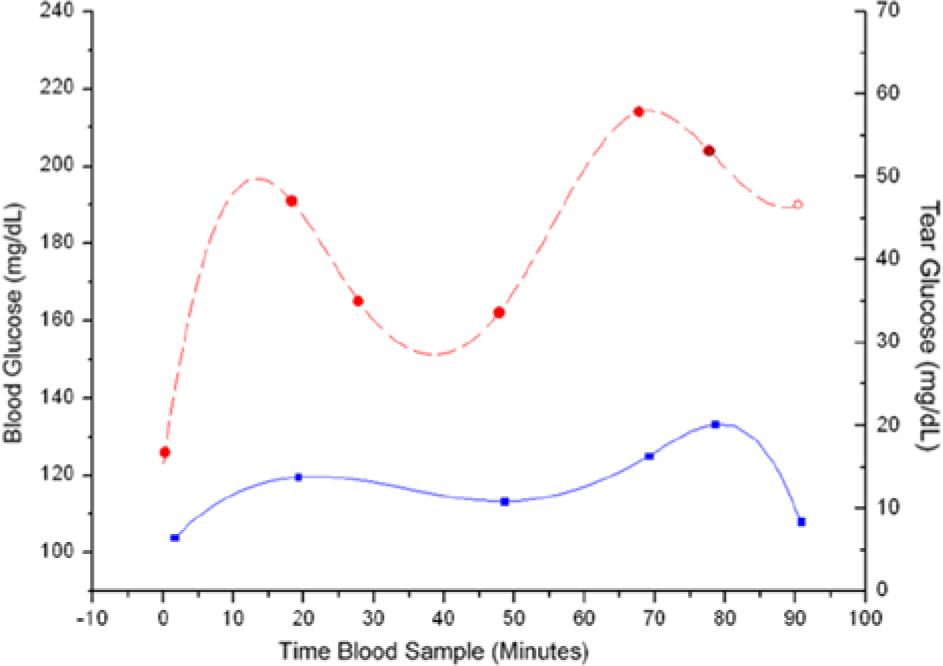
Time-based response for a single animal. Data show baseline and postglucose load values obtained from Yellow Springs Instrument (YSI) measured blood glucose (BG; dashed red line) and tear glucose (TG) level (solid blue line) obtained from the sensor. This plot shows a relative uniformity between BG and TG curves. Current values obtained from tear samples were converted to mg/dL using a previous conversion algorithm.2,11 The initial spikes seen in the blood glucose values are presumed to be an initial stress response in the animal after being fed via syringe. The average YSI response shows the gradual response we typically saw during the study, with all of the YSI values from the study averaged together.
TG-YSI Correlation
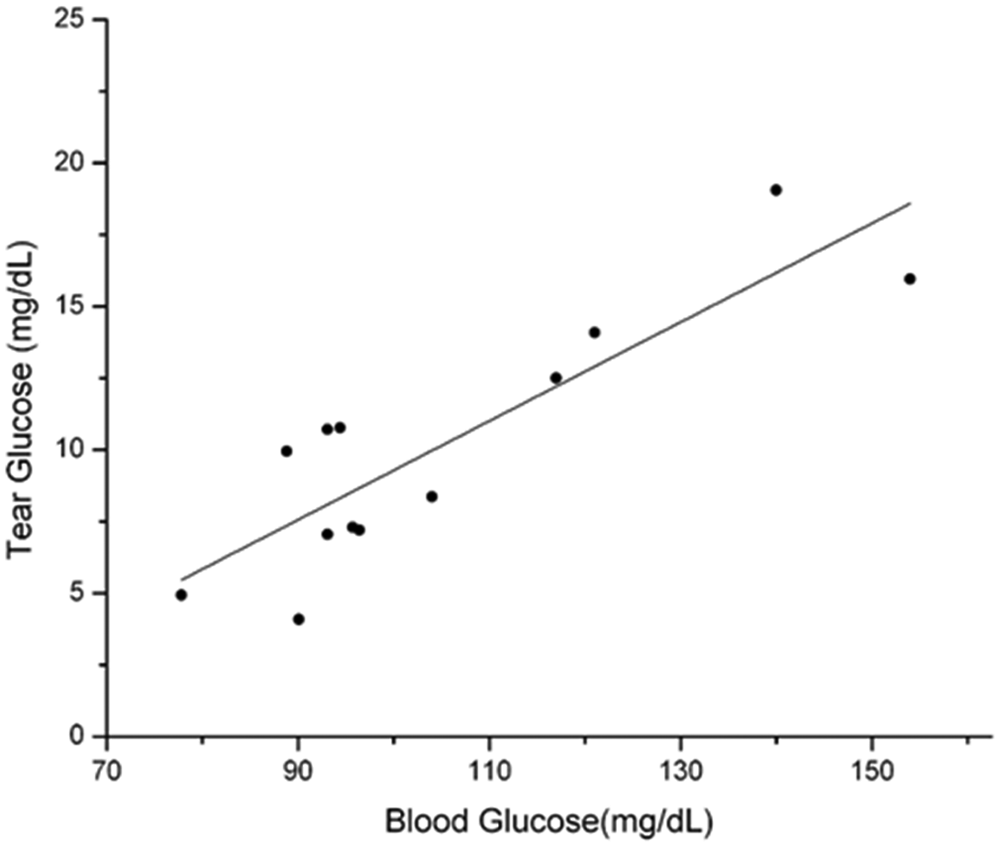
Using the equations previously developed, 11 TG current levels were converted to TG (mg/dL) and plotted against the measured YSI BG levels and a TG:BG correlation lot was made. Due to some personal handling error, manufacturing error, and sensor failure, some outlining data points were eliminated from the analysis. In addition, throughout the yearlong study, the protocol was modified several times to yield better results. However, after eliminating faulty data points, the resulting correlation, R2 = .7544 (Figure 5), still did not meet the minimum R2 value of .869 demanded by the G*Power 3 and statistical design of the experiment. A degree of linearity of these very preliminary data show TG = 0.1723, BG = 7.9448 in mg/dL. The resulting calculated TG levels, ranging from 4 to 20 mg/dL (corresponding to BG levels of 75-160 mg/dL), are consistent with TG levels reported elsewhere.6,17 Thus, a good fit is obtained with a minimum number of animals used, but future effort to increase the R2 value is necessary.
Discussion
Through the Lissamine green dye test, the preliminary safety factor of the device was assessed. Due to the lack of Lissamine green dye staining on test area where TG sensor was applied, results suggested that the device would not cause irreversible damage to ocular cells. However, eye irritation is caused by more than just physical damage. Elderly patients and patients with dry eye symptoms can be easily annoyed by having a device touching their eyes. Taking away TF from patients with bad tear film quality can also cause eye irritation. Perhaps the TG sensor design can be improved to utilize less and consistent volume of TF yet still yield accurate results.
Preliminary work demonstrates the feasibility of the SMTG concept with the current sensor design. The first steps of successfully demonstrating a correlation between TG and BG have been made using a New Zealand white rabbit animal model. Initial safety, BG to TG lag time, TG and BG correlation, as well as actual TG levels presented in mg/dL were described. Lag times were found to vary significantly between rabbits, and it is unclear whether the variances are due to manufacturing errors or physiological processes. Although after removing all the faulty data points at the end of the animal study an average lag time of 13 minutes was obtained, it is still a significant issue and a focus for future study. Readings of TG were shown to be within measured literature values6-8,17 (5-20 mg/dL in tears for 75-150 mg/dL in blood). The repeated use of the device on multiple animals resulted in no visual or densiometrically measured values of irritation or damage over the entire course of the study.
No diabetes technology is appropriate for all patients. For instance, not every patient is an appropriate candidate for an insulin pump, and not every patient desires a continuous glucose-monitoring system. The same would be true for a TG sensor. It would not be applicable to patients with dry eyes, or maybe not in individuals with limited dexterity. However, a TG sensor may be readily accepted by parents of pediatric patients, or otherwise healthy patients with diabetes who need or desire to perform frequent daily glucose monitoring. Acceptability among patients must await a commercially available sensor that can undergo clinical trials.
Problems associated with the sensor were identified and would be addressed in the next proposed design. The capture method, although nonirritating, still makes it difficult to obtain consistent volumes of TF off the eye every time. There were problems with finding the ideal method of calculating volumes and dilution factor, and that this is an intrinsic problem associated with a liquid reagent-based sensor. The sensors were also fabricated by multiple people, which resulted in variations in sensor fabrication that may have affected some results. Many of these issues were addressed in further bench testing to confirm where the errors may have come from.
Although the study did not provide perfectly ideal data, promising initial feasibility of a tear-based glucose sensor was still demonstrated. The study allowed the team to recognize aspects of the sensor requiring redesign, and create future sensor prototypes that will address the inconsistencies associated with the current sensor. Specifically, a more ergonomic design is required in the sampler, and dry reagents must be used. Along the critical pathway, initial bench-top feasibility was made, followed by this pivotal study in animals, leading the way for improvements. The team is currently working on the newest prototype, which introduces capillary action rather than suction into the device and utilizes dry reagent. Future animal studies will focus on determining a more accurate lag time measurement and correcting errors that were found in the first study. In addition, comparisons will need to be done in the correlation of TG and BG between eyes. All of the problems associated with the sensor during the animal study should be corrected in the next version, allowing a promising potential for a future animal study and new tear-glucose sensing device.
Footnotes
Acknowledgements
Enzyme samples were donated generously by Amano Inc. The authors would like to thank Mr Kenyon McAferty for his help in designing a statistically sound animal study. Without your help, this would have not be possible; good luck on your endeavors. They would also like to give thanks for the tremendous support and feedback from Nikki Corday and Dr Ron King at BioAccel. And special thanks to Tim, Terri, and Dr J. Tetens as well for their help and support. Finally, thanks to Scooter, Grumpy, Bulgy, and Peanut, our test subjects (aka 50, 51, 26, and 72), who have all found great new homes.
Abbreviations
BG, blood glucose; DM, diabetes mellitus; GDH, glucose dehydrogenase; GDH-FAD, glucose dehydrogenase with flavin adenine dinucleotide cofactor; GOx, glucose oxidase; PBS, phosphate buffered saline; SMBG, self-monitoring of blood glucose; TF, tear fluid; TG, tear glucose; YSI, Yellow Springs Instrument.
Declaration of Conflicting Interests
The author(s) declared the following potential conflicts of interest with respect to the research, authorship, and/or publication of this article: JTL has filed a US patent relating to this research.
Funding
The author(s) disclosed receipt of the following financial support for the research, authorship, and/or publication of this article: This work was partially supported by ASU Fulton Undergraduate Research Initiatives program, Barrett, The Honors College, and seed funding from the Biodesign Institute at Arizona State University, Tempe, as well as a grant from BioAccel LLC.