
Abstract
Background:
We performed a blood glucose meter hematocrit (HCT) interference test with lower sample manipulation requirements by using blood samples from patients with different blood glucose (BG) levels.
Methods:
Blood from five patients with different BG levels (2.8, 5.6, 8.3, 13.9, 19.4 mmol/liter) was manipulated to contain five different HCT concentrations (35/40/45/50/55%). Each sample was measured three times in parallel with 14 BG testing devices (reference method: YSI 2300 STAT Plus™ Glucose Analyzer). The largest mean deviations in both directions from the reference method (normalized to 100% at 45% HCT) were added as a measure for hematocrit interference factor (HIF). A HIF >10% was considered to represent clinically relevant HCT interference.
Results:
Few devices showed no clinically relevant HCT interference at high/low BG levels: BGStar® (7.2%, 7.3%), iBGStar® (9.0%, 8.6%), Contour® (10.0%, 4.6%), OneTouch® Verio™ 2 (10.0%, 5.2%), and GlucoMen® LX (7.2%, 5.1%). Other devices showed interference at one or both glucose ranges: ACCU-CHEK® Aviva (12.6%, 10.7%), Aviva Nano (7.2%, 10.5%), Breeze2 (3.6%, 30.2%), GlucoCard G+ (12.6%, 7.0%), OneTouch® Ultra®2 (12.6%, 25.6%), FreeStyle Freedom Lite® (9.0%, 11.0%), Precision Xceed (16.2%, 15.3%), and MediTouch® (19.8%, 28.0%). The deviations in all devices were less pronounced in the HCT range of 35–50%.
Conclusions:
The results of this trial with less sample manipulation (HCT only) confirmed previous examinations with HCT and glucose manipulation. The same devices showed HCT stability as previously observed. Artificial sample manipulation may be less crucial than expected when evaluating HCT interference.
Introduction
Blood glucose (BG) meter accuracy can be affected by the underlying measurement technology, environmental factors, patient proficiency factors, and interfering substances. 1 Hematocrit (HCT) has long been known to interfere with many glucose measurement technologies.2,3 Therefore, glucose meters are calibrated to provide accurate readings within a normal physiological range of values, typically 30–50%.
Lower than normal HCT values (<30 to <35%) result in overestimation of laboratory glucose levels when glucose strip methods are used, whereas HCT values higher than normal (>45%) result in underestimates of laboratory values.4–8 Various hypotheses have been proposed to explain the impact of abnormal HCT levels on glucose testing: altered viscosity of the blood, prevention of plasma from reaching the reaction surface of the test strip, change in diffusion kinetics, and/or increased packed red cell volume and displacement of plasma volume leading to insufficient plasma volume in the measurement chamber for accurate testing. 9
In recent laboratory investigations, we have been able to demonstrate that some of the modern glucose measurement technologies are stable against HCT interference, while others are not.10–12 Technical solutions to correct for possible HCT interference include the parallel measurement of HCT with a subsequent correction algorithm as employed by point-of-care devices and handheld patient meters employing the same technology.10,11 Another solution is the application of a physical and mathematical algorithm derived from a dynamic electrochemistry approach as employed by BGStar® and iBGStar® (Sanofi, Frankfurt, Germany). Dynamic electrochemistry involves making multiple measurements at different conditions (e.g., by varying frequencies and voltage) and readjusting the input stimulation signal in response to how the electron transfer kinetics at the electrode and the related chemistry is progressing. This dynamic adjustment results in a much richer output signal that forms the basis for a “fingerprint” that the meter's algorithms can analyze to develop correction factors to minimize distortion caused by interfering factors.12,13 All our investigations, however, were performed in artificial laboratory settings with manipulated venous samples to achieve different BG and HCT ranges. While sample specimen and environmental factors were controlled in our experiments for all devices, other factors, such as the complexity of chemical reactions, the involvement of different co-enzymes, and additional unknown strip components may have further influenced the results. The more manipulations performed, the higher the likelihood that artificially introduced factors will affect the results (e.g., oxygen pressure in the sample) and influence readings.
In this present investigation, we tried to reduce laboratory sample manipulation requirements by drawing blood samples from patients with different BG concentrations as induced by a clinical accuracy study protocol. We used this opportunity to perform another HCT interference study requiring only manipulation of the HCT value in the drawn blood sample.
Materials and Methods
This HCT interference protocol was performed as a substudy of an International Organization for Standardization (ISO) conform clinical system accuracy study protocol in accordance with local ethical and regulatory requirements. In the clinical trial, glucose and insulin interventions were used to achieve the different BG ranges as requested by ISO 15197 for clinical accuracy testing. 14 The results of this accuracy study are published elsewhere. 15 The responsible ethical review board approved the clinical accuracy study and the HCT interference sub-study and the participants gave written informed consent prior to any study procedure. Patients were required to be between 18 and 65 years of age, had to be healthy or have type 1 or type 2 diabetes mellitus. Criteria for exclusion included any serious concomitant disease, uptake of drugs known to interfere with capillary BG readings, drug or alcohol abuse, and any condition precluding successful compliance with study requirements as assessed by the investigator.
The primary objective of the HCT interference evaluation was to demonstrate that the BGStar and iBGStar devices meet the HCT interference requirements as set forth in the Dutch TNO 2001Quality Guideline. 16 This guideline allows a maximum deviation of ±10% for hyperglycemic values (>120 mg/dl, 6.5 mmol/liter) and ±18 mg/dl (1.0 mmol/liter) for hypoglycemic and normoglycemic (leg;120 mg/dl, 6.5mmol/liter) values obtained from venous whole blood samples compared to a venous plasma reference method at HCT levels from 35 to 55% when tested at 5% increments. The secondary objectives were to demonstrate the absence of HCT interference in terms of mean deviation at a broader HCT range (25–65%) and at five different venous BG concentrations (50–60 mg/dl, 100–120 mg/dl, 150–180 mg/dl, 250–280 mg/dl, 320–350 mg/dl) in comparison with 11 competitive BG meter devices.
The devices included in this investigation were: BGStar and iBGStar (Sanofi, Frankfurt, Germany), ACCU-CHEK® Aviva and Aviva Nano (Roche Diagnostics, Indianapolis, IN), Contour® and Breeze2 (Bayer Healthcare, Tarrytown, NY), OneTouch® Ultra®2 and OneTouch® Verio™ 2 (Lifescan, Milpitas, CA), FreeStyle Freedom Lite® and Precision Xceed (Abbott Medisense, Alameda, CA), GlucoMen® LX and GlucoCard G+ (Menarini, Florence, Italy) and MediTouch® (Medisana, Dusseldorf, Germany).
Venous heparinized whole blood samples were obtained from five patients with the following BG concentrations: 50 mg/dl (2.8 mmol/liter), 100 mg/dl (5.6 mmol/liter), 149 mg/dl (8.3 mmol/liter), 250 mg/dl (13.9 mmol/liter), and 349 mg/dl (19.8 mmol/liter). In order to achieve the planned HCT ranges of 25%, 30%, 35%, 40%, 45%, 50%, 55%, 60%, and 65%, part of the samples was gently centrifuged (3 min, 300xg) and the respective HCT value was established by careful addition of plasma or the cell fraction derived from the same sample. After gentle suspension of the blood sample, HCT and oxygen pressure were determined using the ABL80 FLEX CO-OX point-of-care device (Drott, Wiener Neudorf, Austria). If the oxygen pressure of an individual sample was outside of the physiological range (80–100%), the sample was discarded and preparation was repeated. Otherwise, parallel measurements were immediately performed with all tested devices within 15–20 min and the reference method (YSI 2300 STAT Plus Glucose Analyzer, Life Sciences/Kreienbaum, Langenfeld, Germany, glucose oxidase method) test was performed before and after the device testing. Device measurements were performed in triplicate with two devices and two different strip lots per meter type obtained through regular local distribution channels. Total laboratory hands-on time per sample was less than 45 min.
Statistical Analysis
Data from each meter was tabulated. Mean values and standard deviations (SDs) for each meter type/sample combination were calculated. The mean glucose value with the HCT of 45% was set to be 100% in order to determine the bias (% deviation) at the different HCT and glucose levels. Results were analyzed to assess compliance with the TNO 2001 Quality Guideline [deviation <±10 % for values >120 mg/dl, (6.5 mmol/liter) and <±18 mg/dl (1.0 mmol/liter) for values ≤120 mg/dl]. The means of these deviations were used for calculating the mean absolute relative deviation (MARD) for each meter at the five glucose concentrations. A MARD <15% for the individual glucose level and a MARD over the entire glucose ranges <10% was defined as indicative for no clinically relevant influence of HCT on the BG readings. The data was calculated for each meter and individual glucose concentration. In addition, the mean deviation over the entire glucose range was determined for each meter type. Comparisons between mean values were calculated by means of the two-sided Student's t-test. A p-value <0.05 was considered statistically significant.
Results
The blood samples were drawn from five subjects [four male, one female, age (mean ± SD): 61 ± 5 yrs., one with type 1 diabetes, four with type 2 diabetes]. Following careful manipulation of the HCT concentrations with confirmation of the HCT and oxygen pressure acceptance criteria, all measurements were carried out by an appropriate number of laboratory staff members in parallel for each meter within 20 min.
The mean deviations observed for the combined samples at high and at low glucose concentrations and at HCT ranges 35–55% as defined by the TNO Quality Guideline are provided in
Mean deviations of BG meter readings vs the reference method (YSI Stat Plus Glucose Analyzer) in the HCT range from 35% to 55% for values <6.5 mmol/liter (117 mg/dl) or ≥6.5 mmol/liter
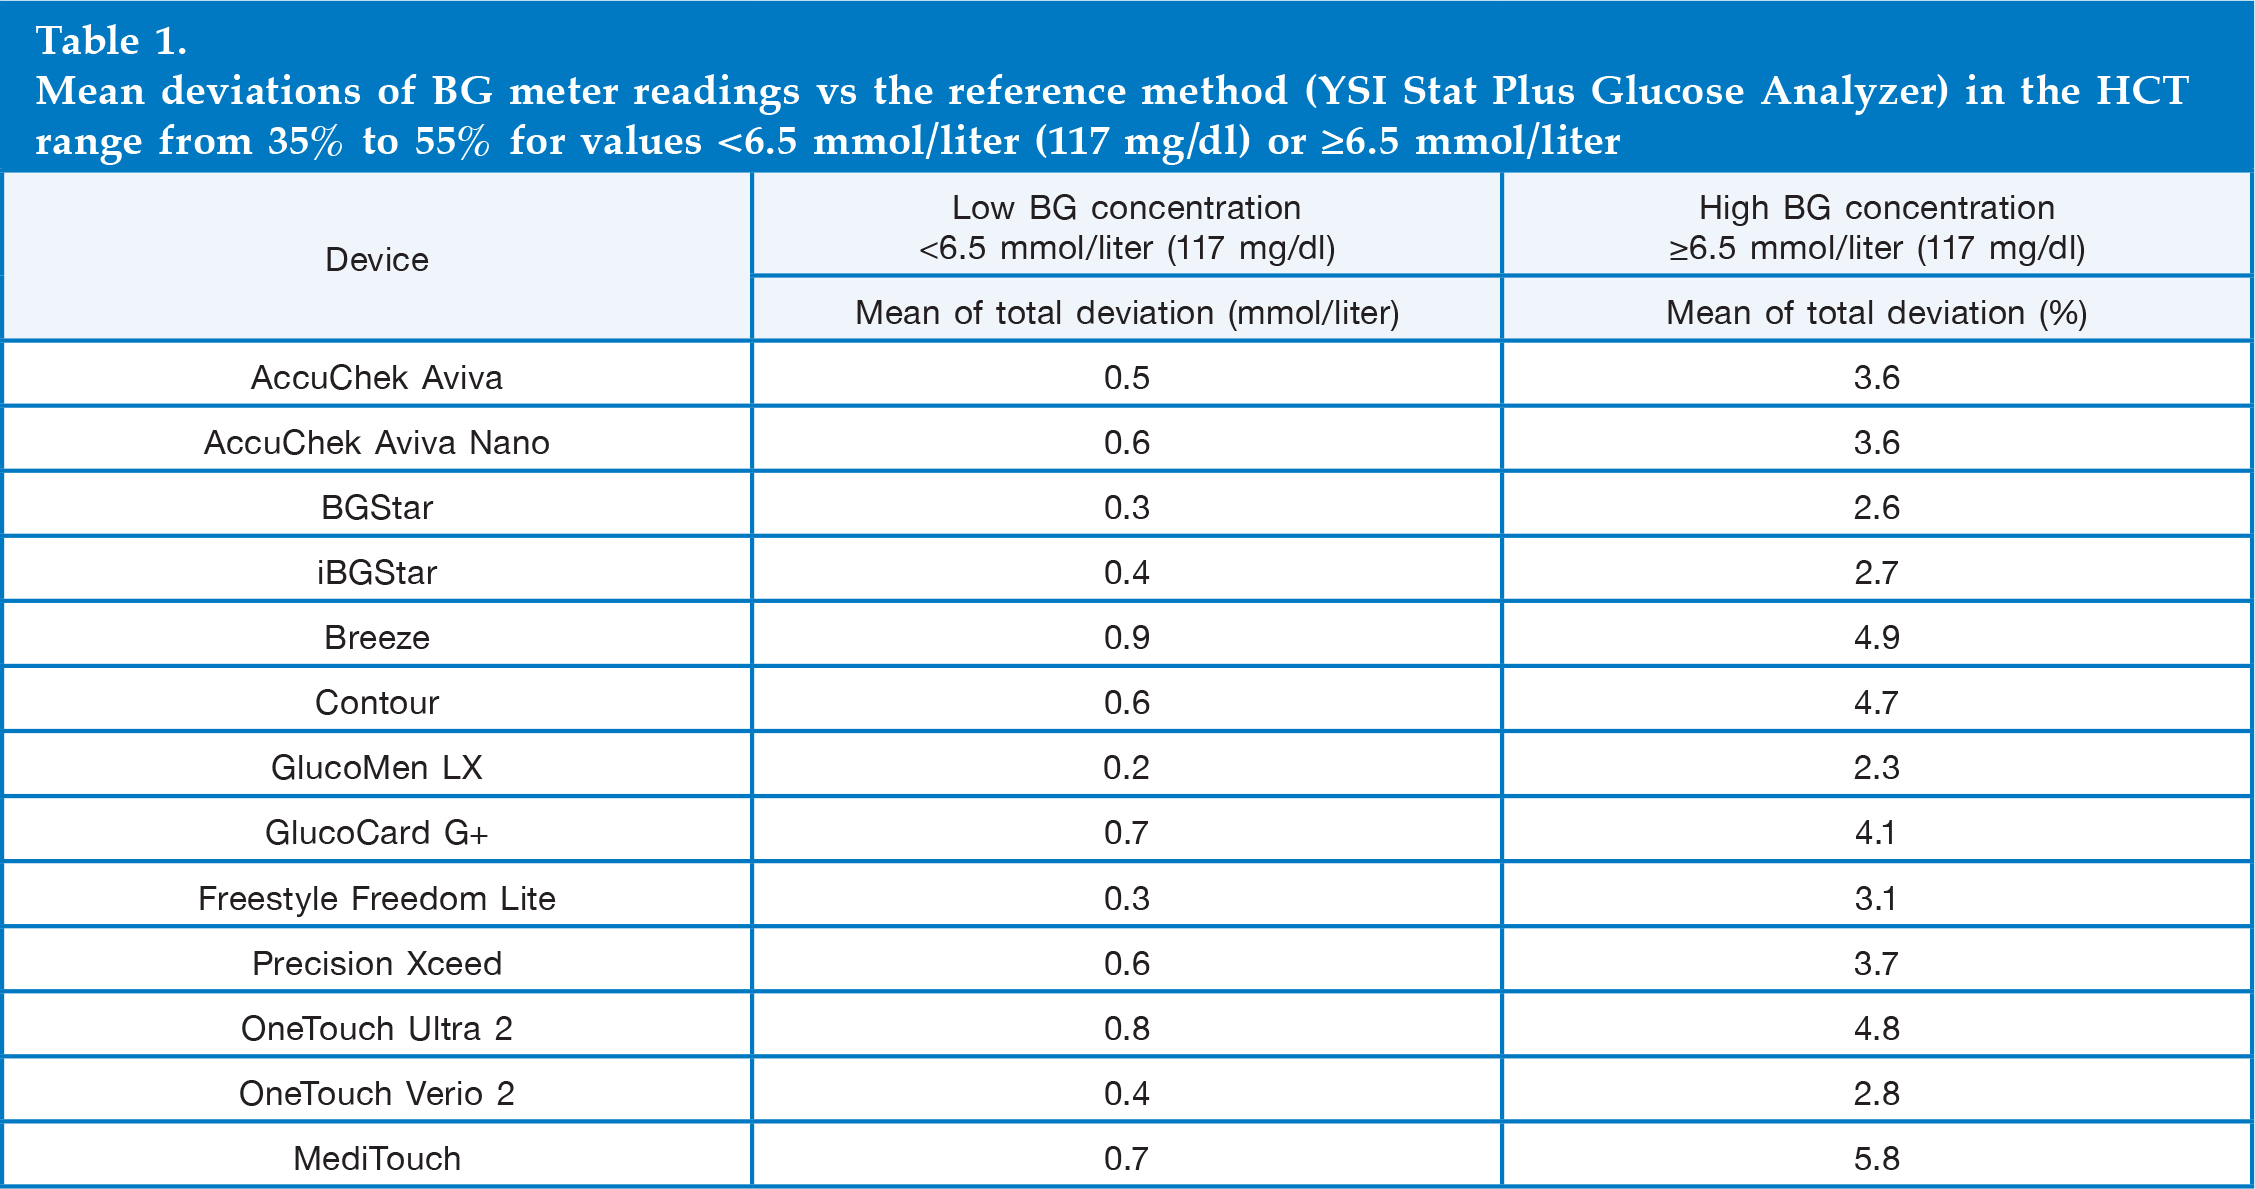
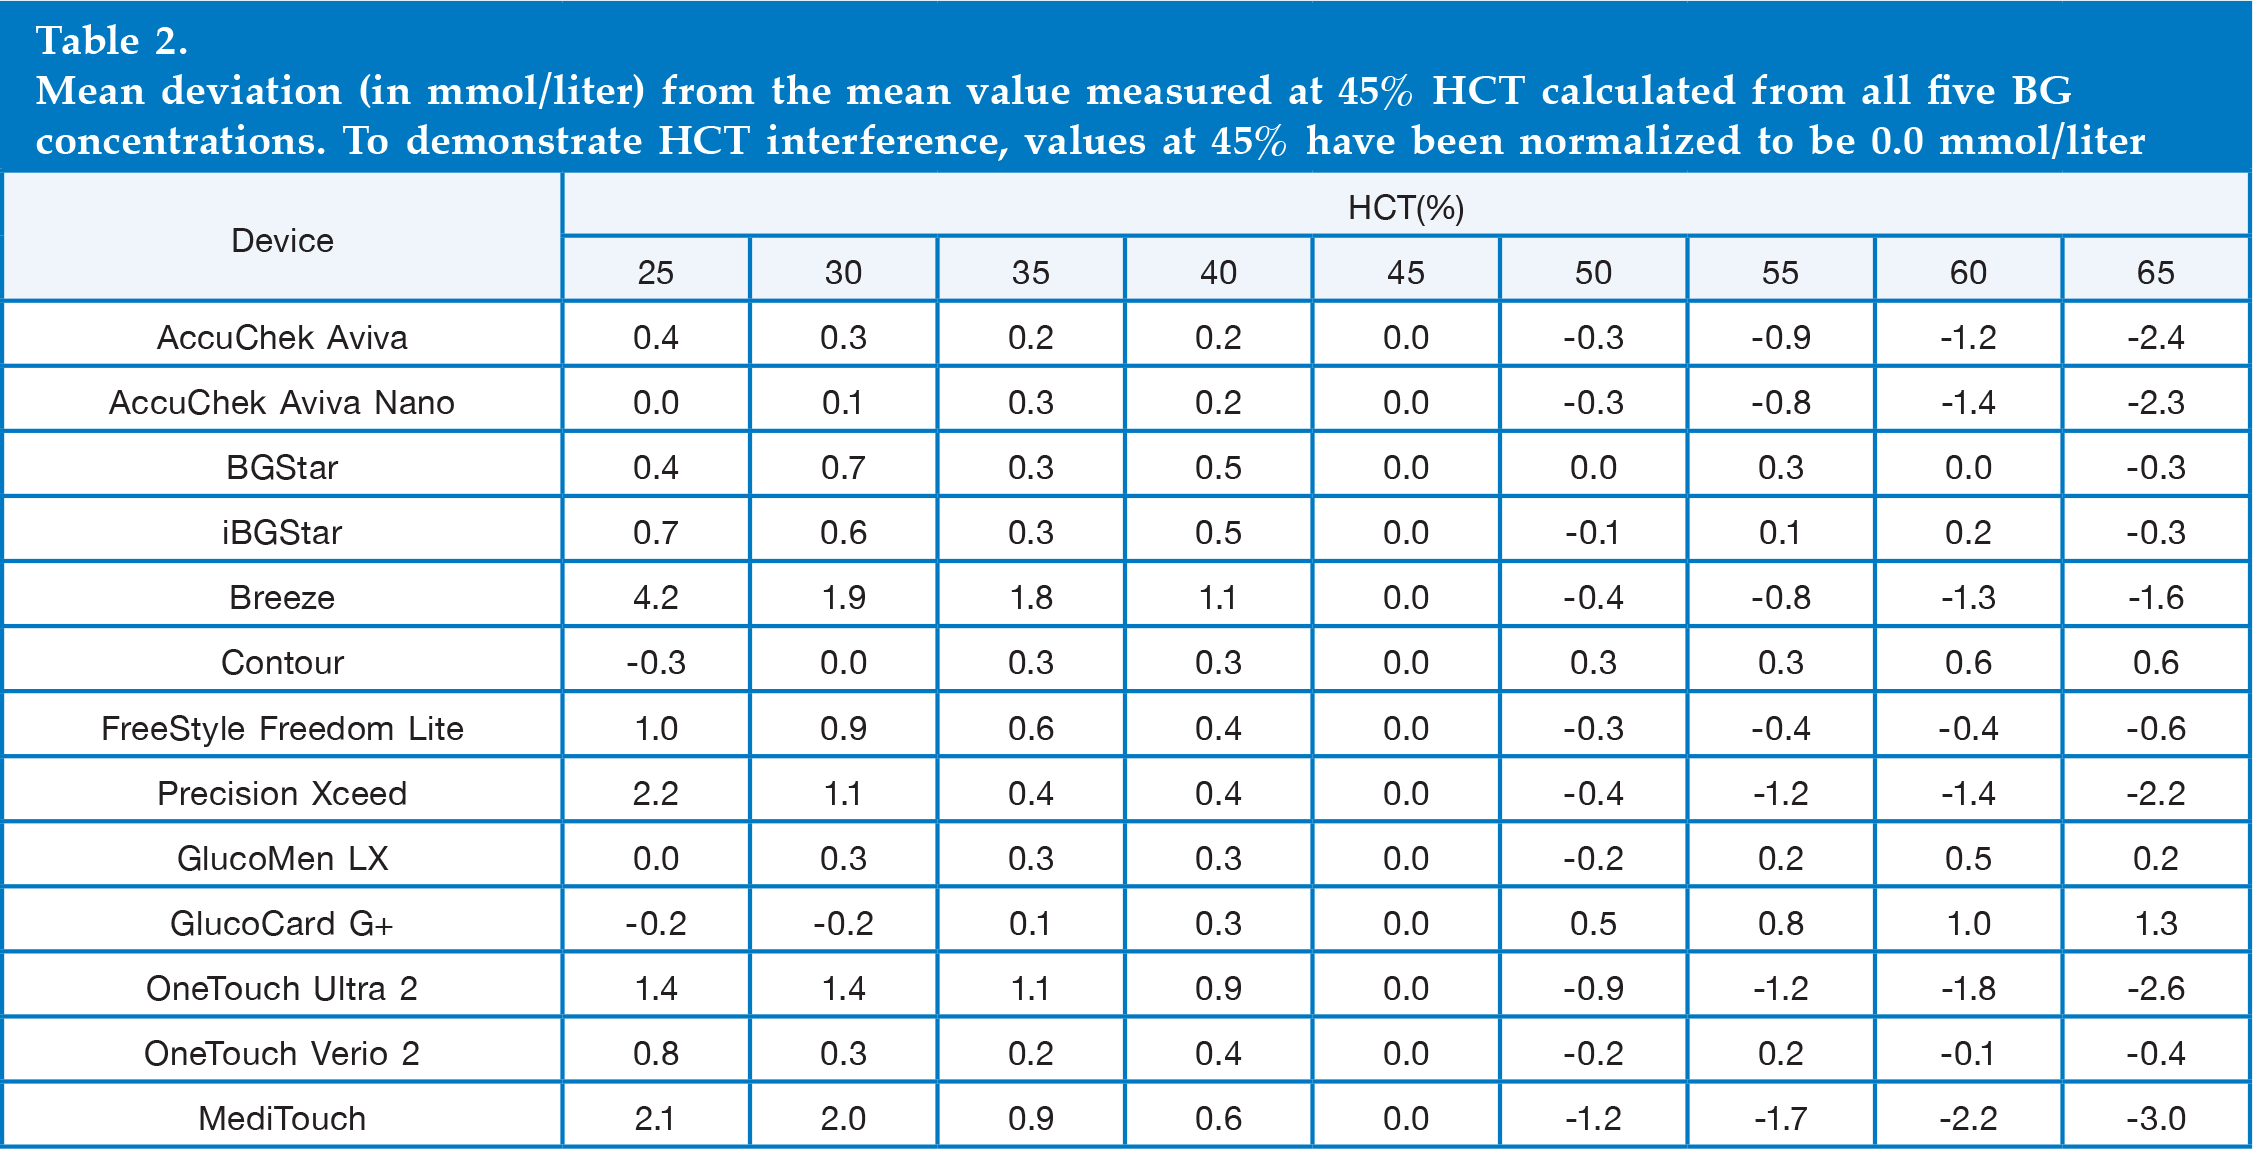
Mean deviation (in mmol/liter) from the mean value measured at 45% HCT calculated from all five BG concentrations. To demonstrate HCT interference, values at 45% have been normalized to be 0.0 mmol/liter
The mean absolute deviations in mg/dl for the combined BG samples <6.5 mmol/liter (117 mg/dl) are provided in
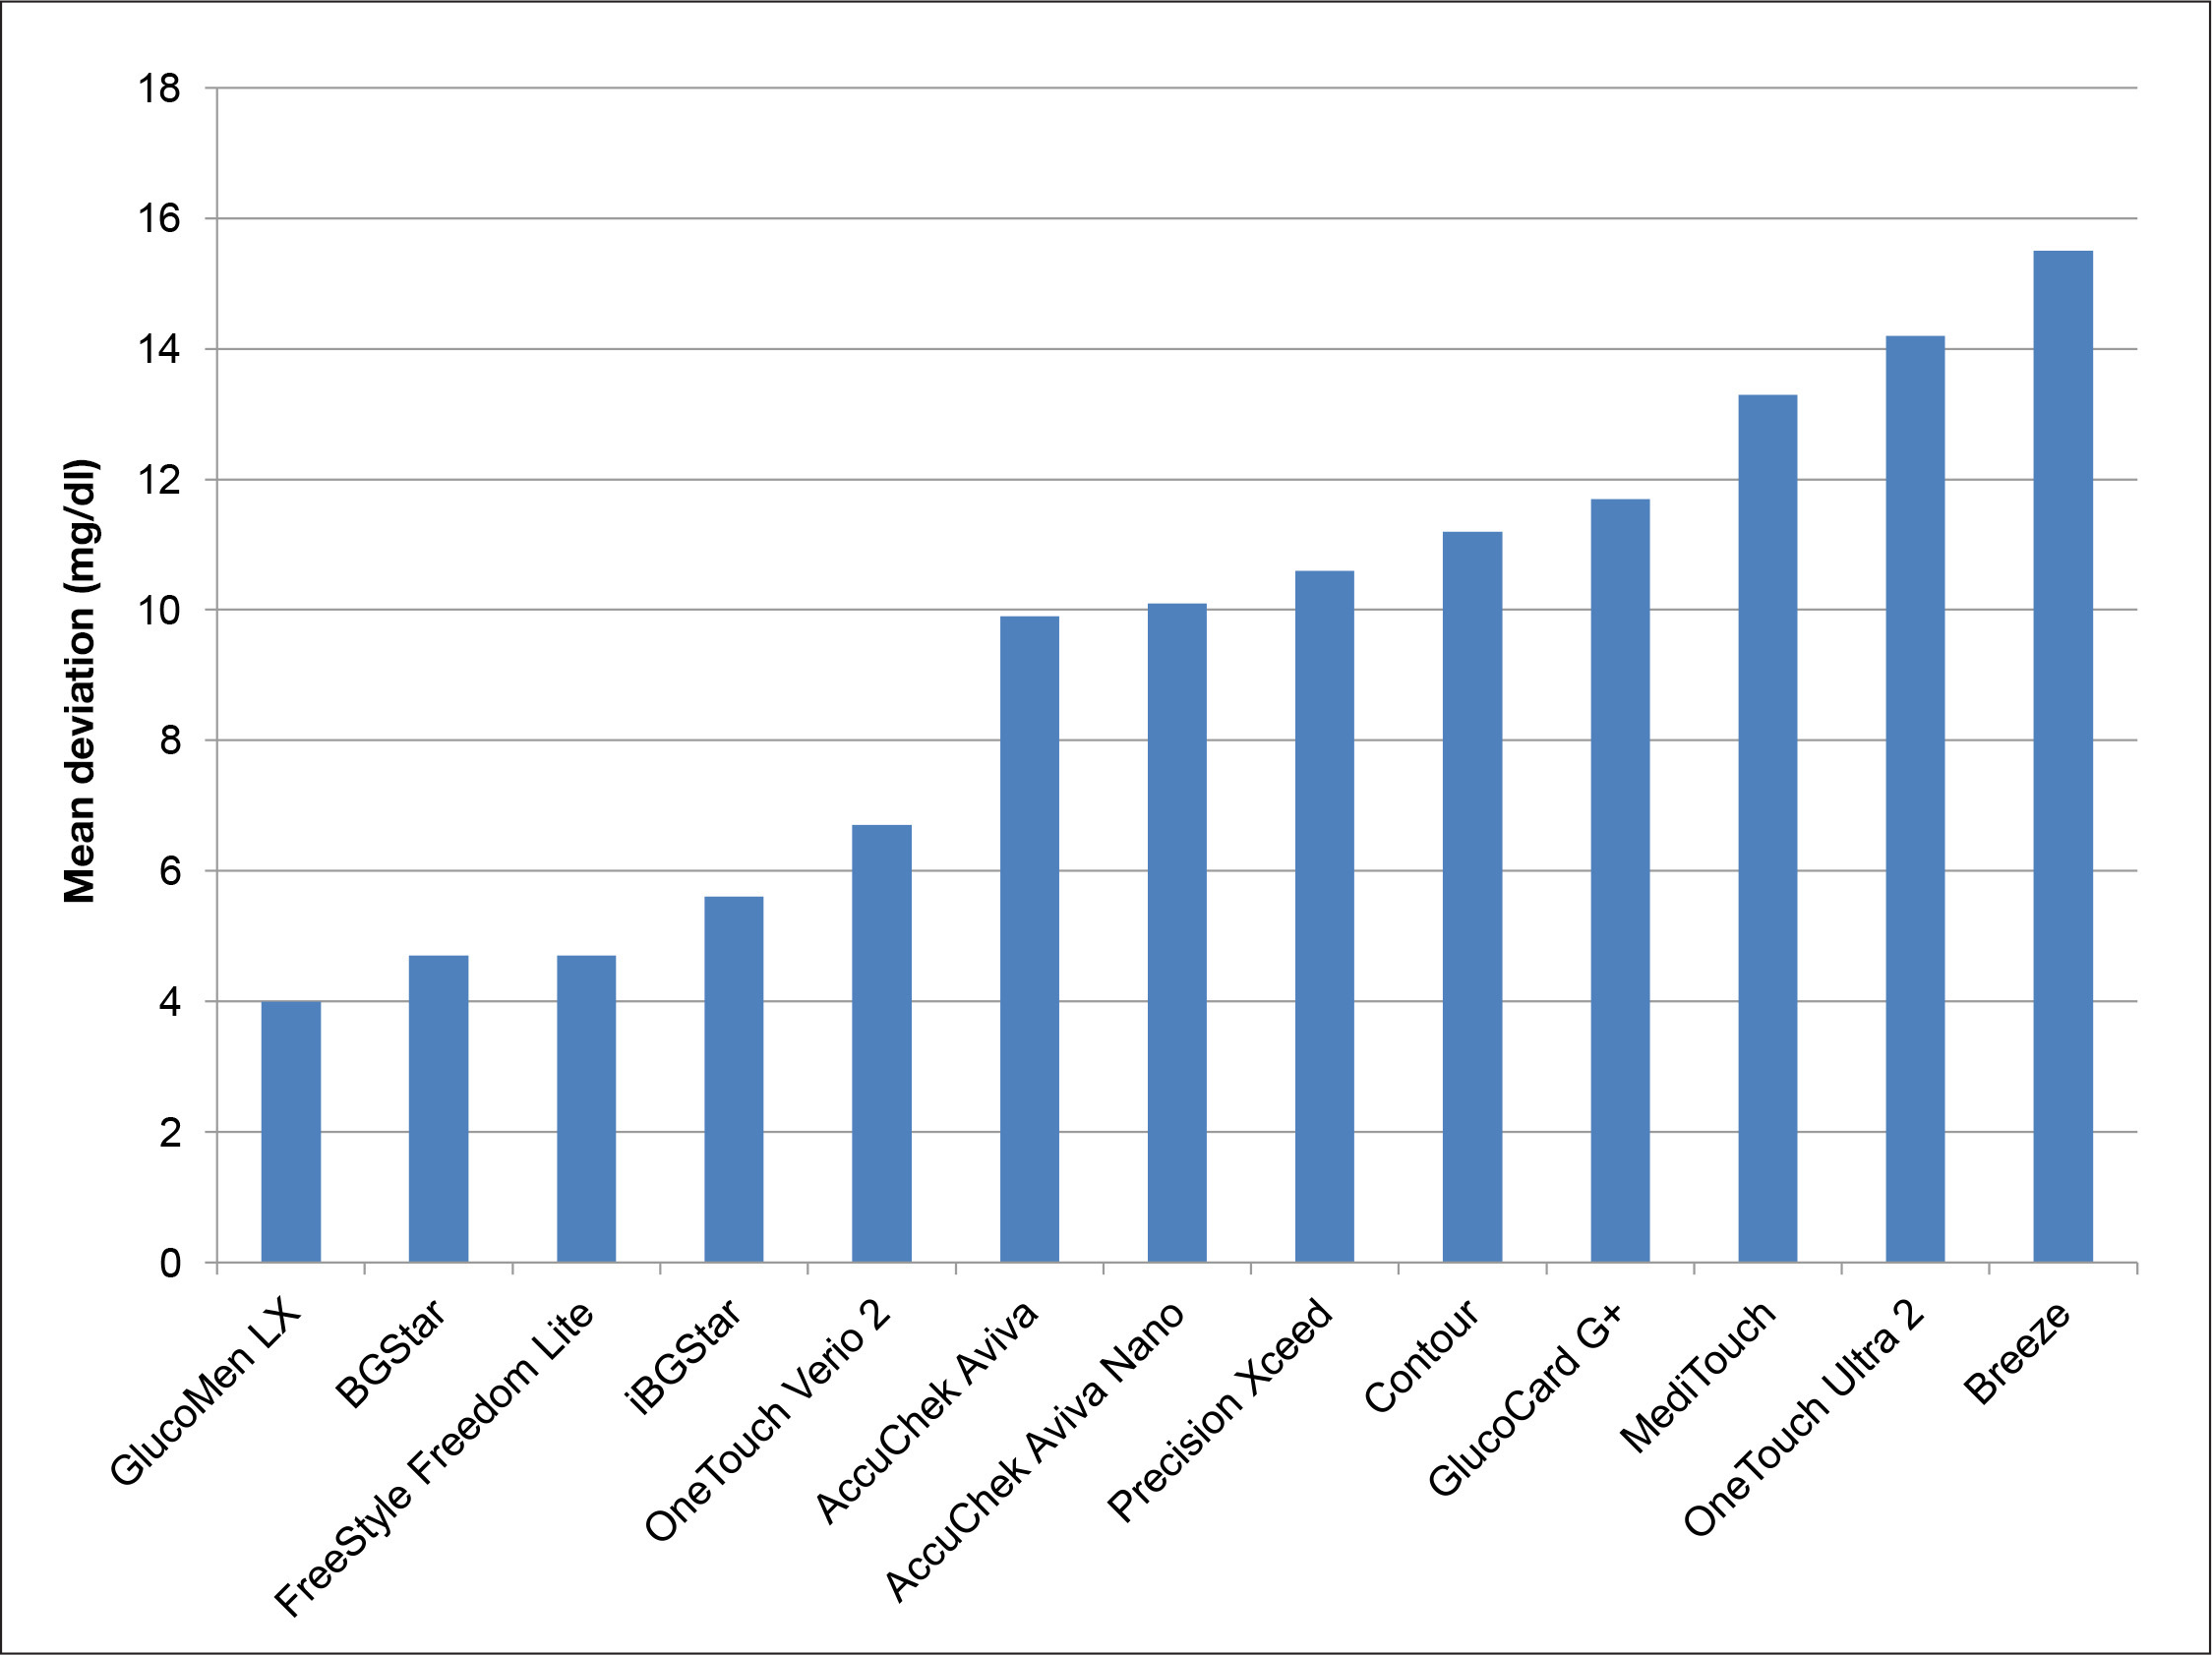
Mean absolute deviation (in mg/dl) of the different BG meters from the reference method (YSI Stat 2300 Glucose Analyzer) in the samples with BG concentrations <6.5 mmol/liter (117 mg/dl) and with a HCT of 45%.
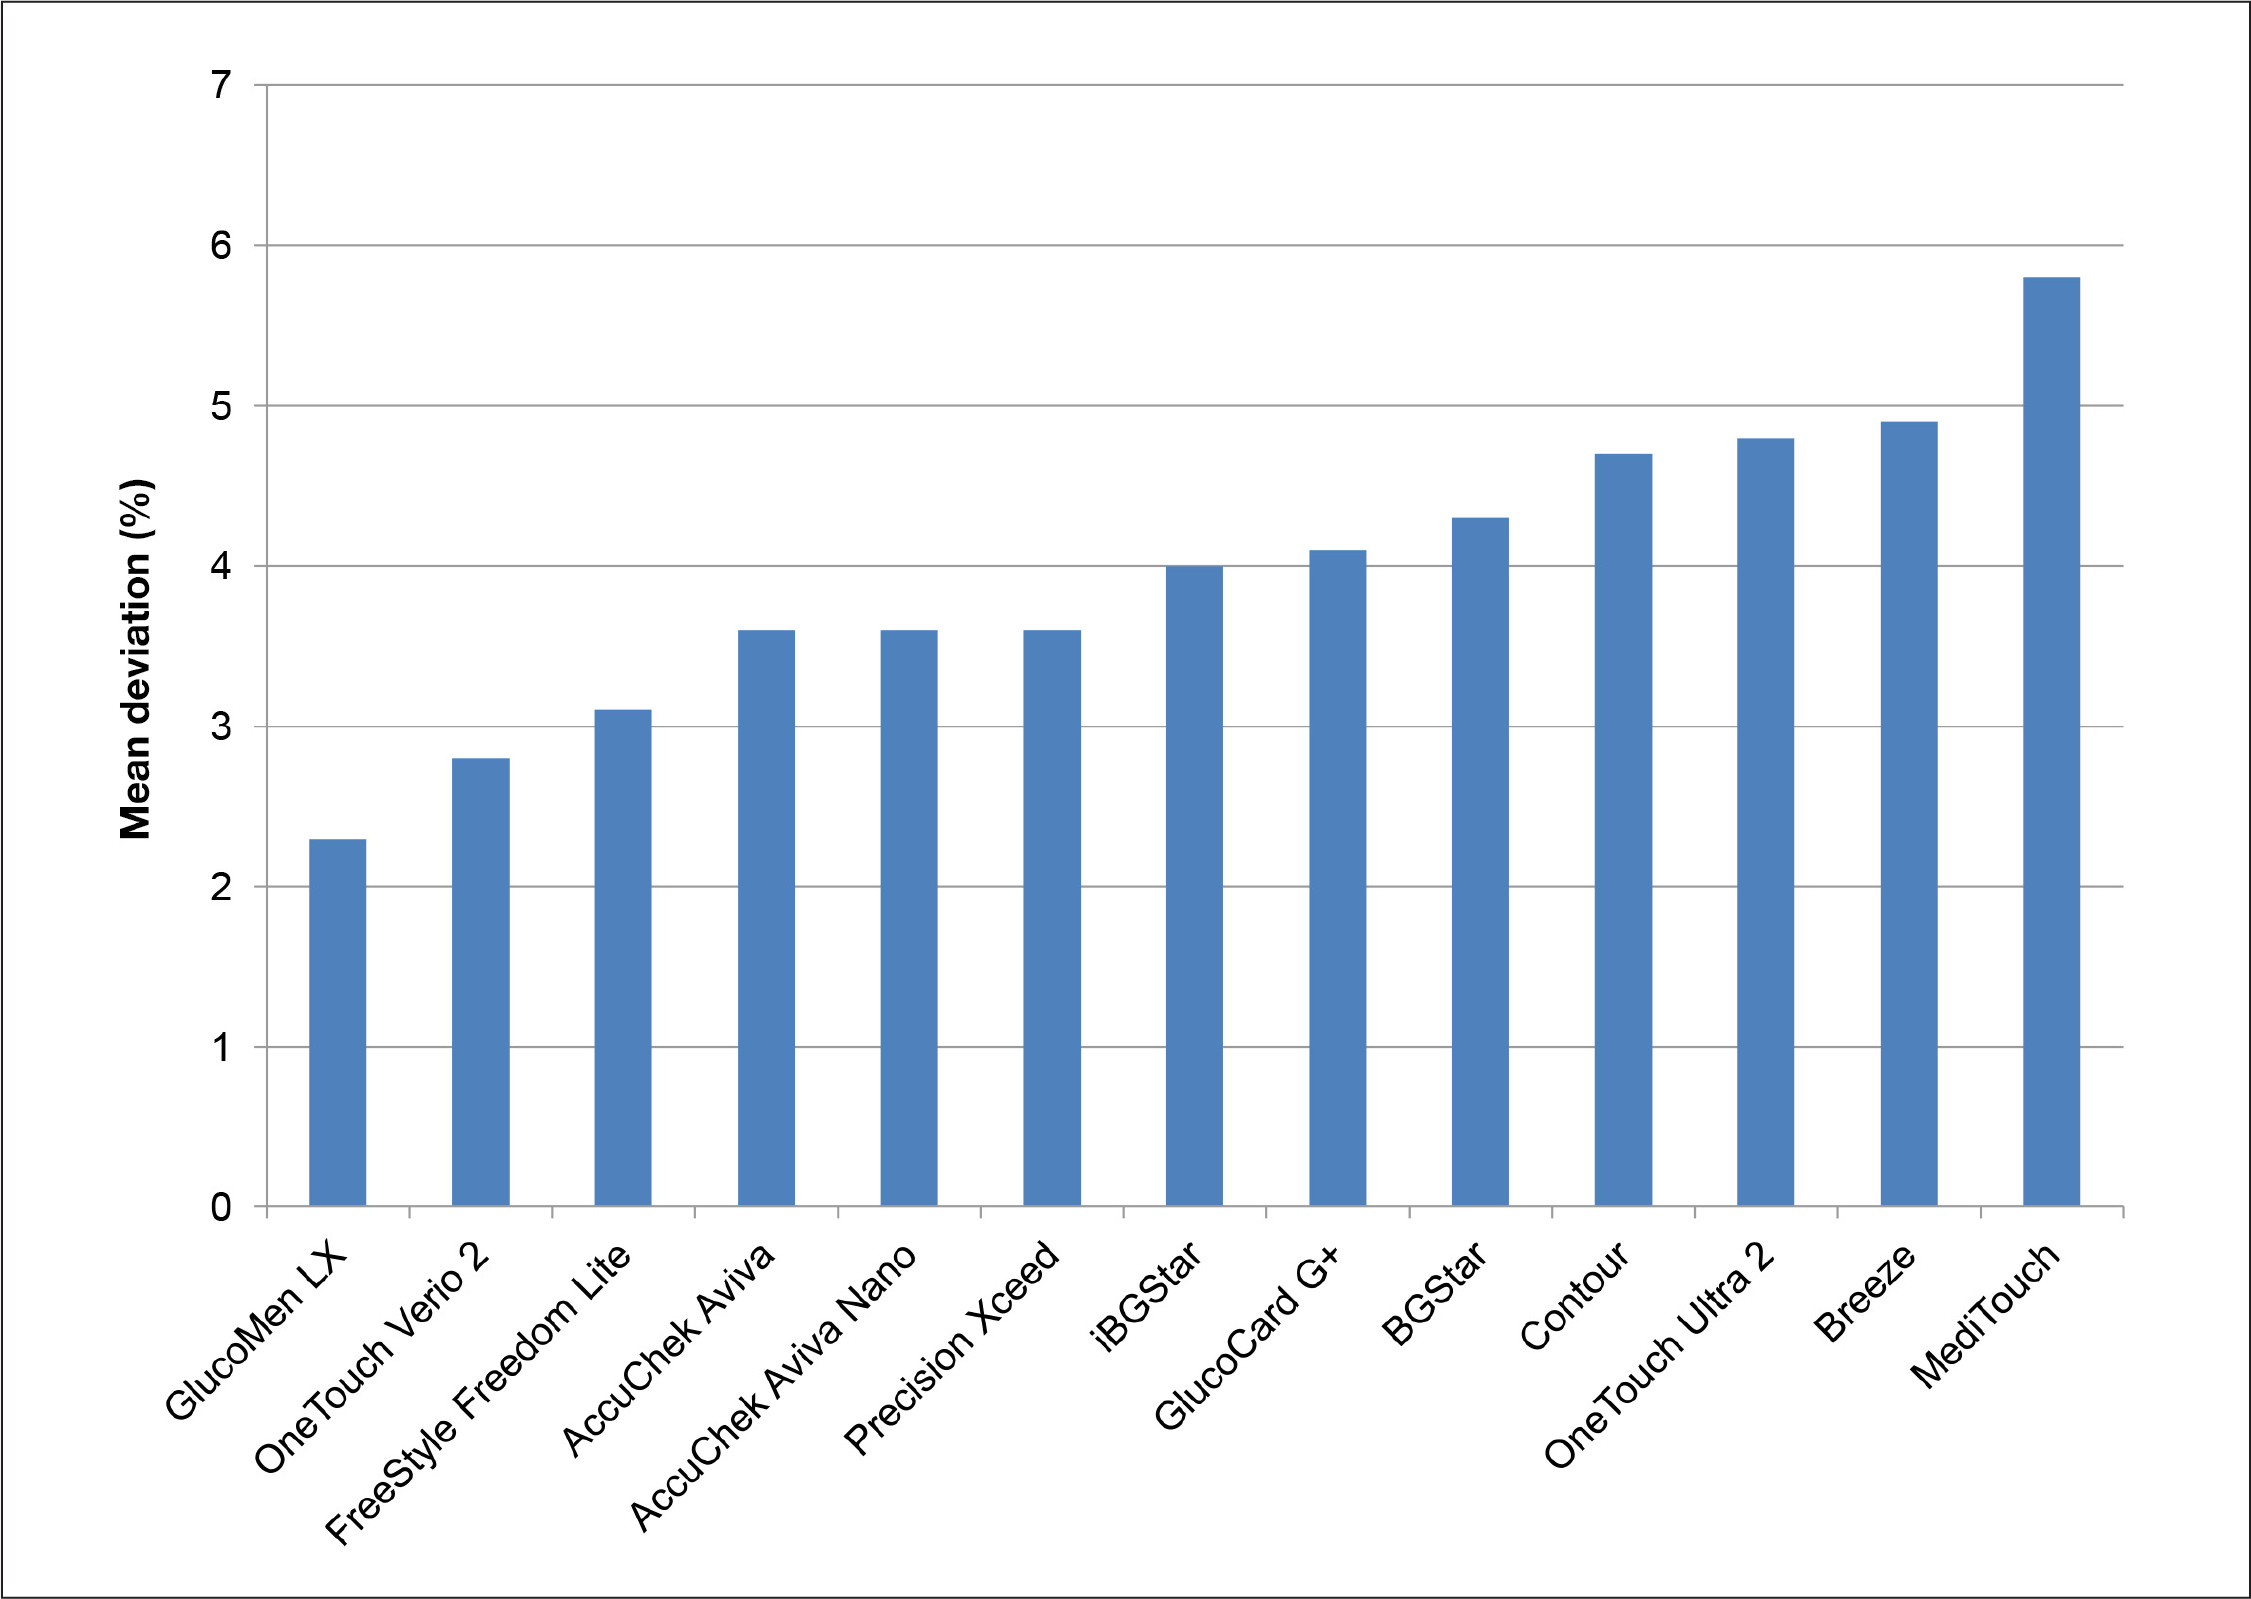
Mean absolute relative deviation (in %) of the different BG meters from the reference method (YSI Stat 2300 Glucose Analyzer) in the samples with BG concentrations >6.5 mmol/liter (117 mg/dl) and with a HCT of 45%.
A better benchmark comparison to determine HCT interference is the calculation of the hematocrit interference factor (HIF). It is calculated by adding the highest observed mean deviation over the entire glucose range above the 45% result to the highest absolute deviation below the 45% result, as described previously.10,12 The result and ranking of the devices based on this parameter is provided in
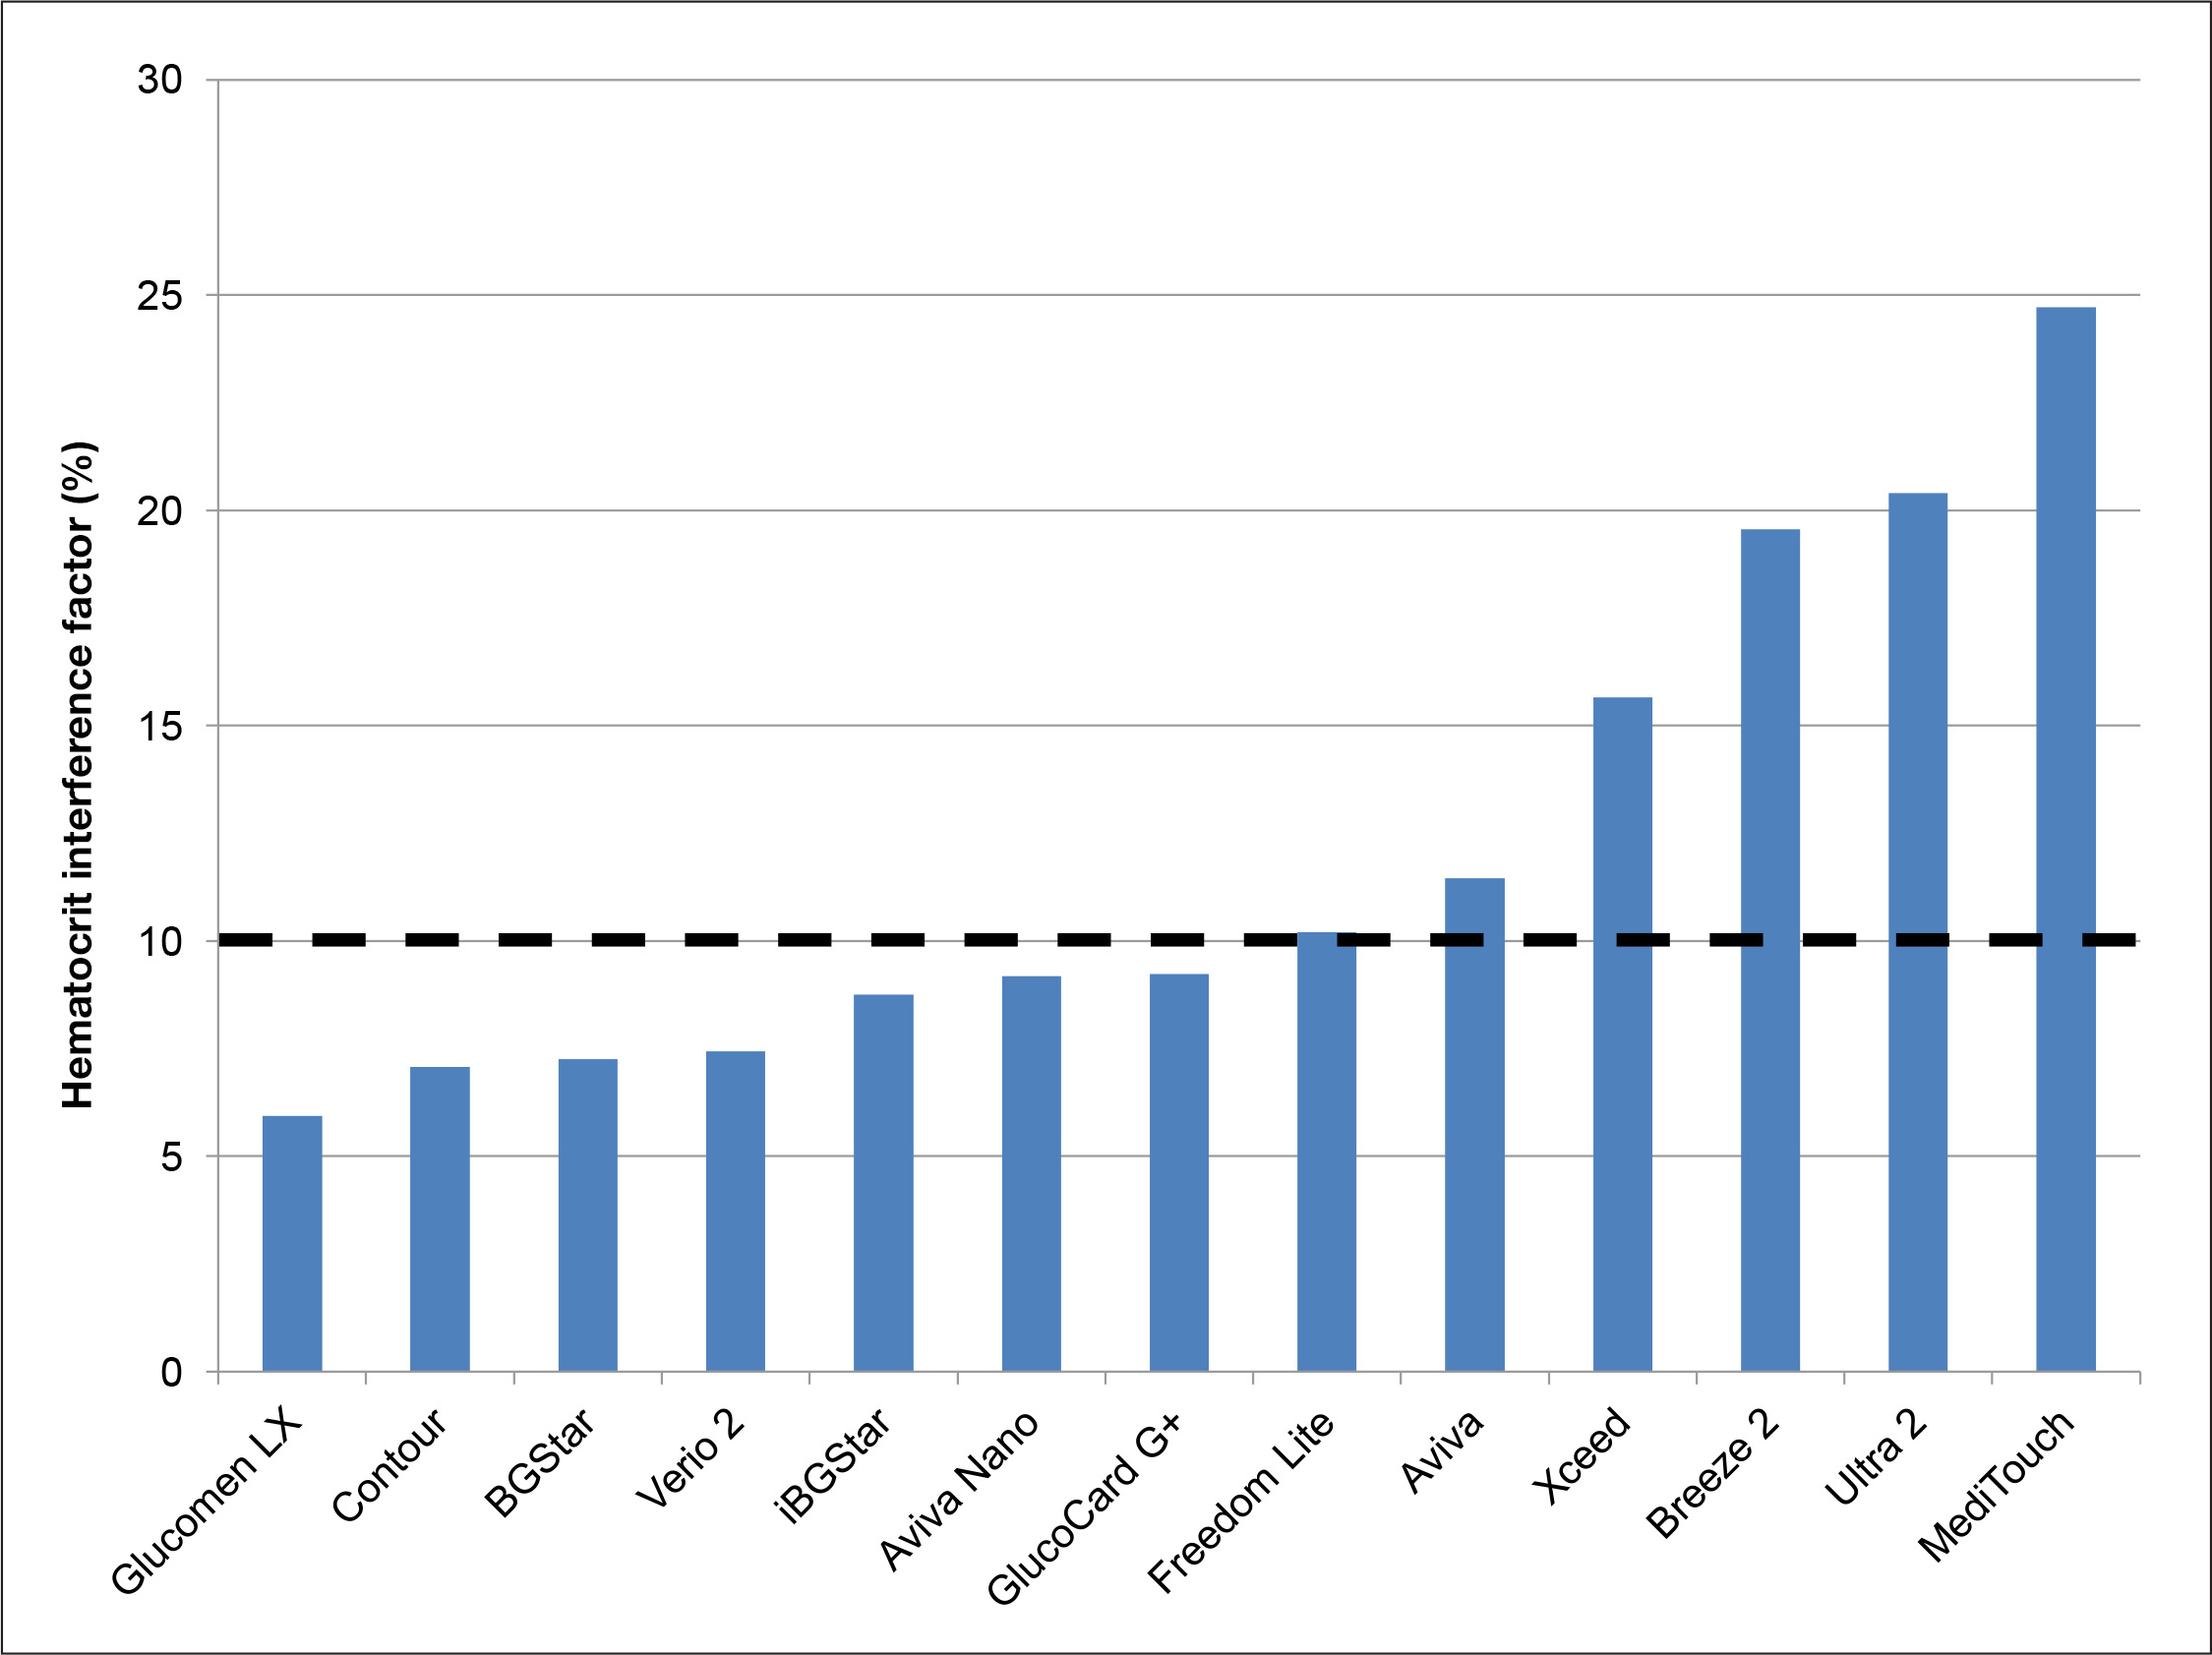
The HIF (addition of the highest observed mean deviation over the entire glucose range above the 45% result to the highest absolute deviation below the 45% result) of the tested devices as calculated from the entire HCT range. Devices with an HIF <10% are considered to be stable against HCT interference.
Discussion
Interfering substances are known to influence the quality of BG meters for patient self-measurement. One known interfering substance is blood viscosity as determined by the HCT value,18–20 which can be eliminated by direct HCT measurement and appropriate correction of the obtained signal11,21 or by application of a mathematical correction for HCT interference by means of assessment of the different kinetics involved in the different confounding signals under different measurement conditions as employed by dynamic electrochemistry.13,22 Prevalence of HCT variation is usually underestimated by physicians and diabetes nurse educators and is subject to seasonal variation. 18
Deviation from normal HCT levels can be induced by lifestyle interventions (e.g., smoking, prolonged exercise), by environmental conditions (e.g., high elevations, seasonal variation), demographic conditions (e.g., age), and disease and drug related conditions (e.g., hematological disorders, hypermenorrhea, pregnancy, or renal disease).19,20 Hematocrit values, which are sampled at yearly peaks and through time points, with intervals of up to 6 months, may have 15% relative change (95% level), which indicates the potential within-subject variability in a normal healthy adult (e.g., a change from 0.42 to 0.48). 18
The practical relevance of HCT interference has been investigated only in high-risk populations (e.g., intensive care unit or neonatal patients), but information from community-based studies is lacking. 21 Recently, a first thorough investigation of the HCT distribution in an urban community has been published demonstrating a range 30–50% in a healthy reference population, (20–60% in community patients, 10–70% in hospital patients, and 15–40% in intensive care patients). 22 In older patients also suffering from various additional chronic diseases, these variations can be much more pronounced and may have an impact on the patient's prognosis. 23 Therefore, HCT interference on BG meter results may represent a potential risk factor for diabetes patients whose well-being may be endangered by wrong insulin doses resulting from inaccurate BG readings.
Using artificially produced samples in a laboratory setting, we have been able to demonstrate that devices employing dynamic electrochemistry are unaffected by HCT variation.10,12 Laboratory tests with devices employing dynamic electrochemistry, however, require an extremely careful handling of the sample. The composition of whole blood samples deteriorates with aggressive centrifugation or vigorous shaking of samples as requested by many laboratory protocols applied during sample preparation for proficiency testing of BG meters. Artificially increasing oxygen pressure in the blood has an impact on the BGStar and iBGStar readings and needs to be completely avoided. When testing for HCT interference, however, a sample needs to be manipulated twice. First, a certain BG range needs to be established through addition of glucose or glucose consumption by the blood cells in the sample. Second, the desired HCT ranges have to be introduced through addition of cell free plasma or a cell suspension derived from the same blood sample.
In our present study, we aimed to reduce sample variability. Glucose manipulation was avoided by drawing blood with different glucose levels as induced by intravenous glucose or intravenous insulin treatment in a clinical experiment. All experiments were performed with a sufficient number of investigators to ensure that each meter/strip combination was done without delay (within 20 min after oxygen testing) and in parallel for all device/strip lot combinations.
The five BG samples were very carefully manipulated with respect to the HCT ranges and a physiological oxygen pressure was confirmed prior to the measurements. With this approach, we have been able to confirm the stability of BGStar and iBGStar against HCT interference. Our results for the other meters are generally in line with our results from previous investigations. We also confirmed HCT stability for Contour, OneTouch Verio 2, and GlucoCard G+. In addition, GlucoMen LX and AccuChek Aviva Nano showed much better performance than observed in the previous laboratory setting. These findings can be explained by technology improvements, which have been introduced by manufacturers in the time period between the previous and the current investigations. Sensitivity to HCT was again confirmed for the other devices. Given the overall comparability of the results of the pure laboratory approach with the present clinical-laboratory approach of sample preparation, it can be expected that HCT interference evaluations with samples derived entirely from artificial laboratory manipulations when performed by an experienced scientist may be a suitable way to test BG meter technologies.
In conclusion, in this study with a hybrid clinical and laboratory approach for preparation of the test samples, the results from previous laboratory trials confirm that dynamic electrochemistry is an effective way to stabilize BG readings against HCT interference.
Footnotes
Abbreviations:
This study was supported by a grant from Sanofi, Paris, France.
Acknowledgements:
The authors would like to thank the collaborators and patients of IKFE Clinic and IKFE Research Laboratory, who participated with great motivation in the performance of the measurements.
Andreas Pfützner, Thomas Forst, and Petra B. Musholt have received research grants, travel support, and speaker fees from SANOFI. Frank Flacke and Jochen Sieber are employees of SANOFI.