
Abstract
Background:
An important task in diabetes management is detection of hypoglycemia. Professional continuous glucose monitoring (CGM), which produces a glucose reading every 5 min, is a powerful tool for retrospective identification of unrecognized hypoglycemia. Unfortunately, CGM devices tend to be inaccurate, especially in the hypoglycemic range, which limits their applicability for hypoglycemia detection. The objective of this study was to develop an automated pattern recognition algorithm to detect hypoglycemic events in retrospective, professional CGM.
Method:
Continuous glucose monitoring and plasma glucose (PG) readings were obtained from 17 data sets of 10 type 1 diabetes patients undergoing insulin-induced hypoglycemia. The CGM readings were automatically classified into a hypoglycemic group and a nonhypoglycemic group on the basis of different features from CGM readings and insulin injection. The classification was evaluated by comparing the automated classification with PG using sample-based and event-based sensitivity and specificity measures.
Results:
With an event-based sensitivity of 100%, the algorithm produced only one false hypoglycemia detection. The sample-based sensitivity and specificity levels were 78% and 96%, respectively.
Conclusions:
The automated pattern recognition algorithm provides a new approach for detecting unrecognized hypoglycemic events in professional CGM data. The tool may assist physicians and diabetologists in conducting a more thorough evaluation of the diabetes patient's glycemic control and in initiating necessary measures for improving glycemic control.
Introduction
The Diabetes Control and Complication Trial demonstrated that intensive insulin therapy delays the onset and slows the progression of late-diabetic complications in patients with type 1 diabetes. 1 This finding was subsequently confirmed by the UK Prospective Diabetes Study Group. 2 Unfortunately, intensive insulin therapy results in a 2–3–fold increase in the prevalence of hypoglycemia. Hypoglycemia is a potentially fatal event, and people with type 1 diabetes describe severe hypoglycemia as the most frightening and feared event in their lives. 3 Identification of unrecognized hypoglycemia, therefore, is an important goal of optimal diabetes therapy, and retrospective analysis of blood glucose (BG) readings is essential to this process.4–6 Self-monitoring of blood glucose (SMBG) with traditional finger stick methods has long been the only way to assess glycemic patterns in practice. New continuous glucose monitoring (CGM) technology, which measures interstitial glucose (IG) and produces a reading typically every 5 min, offers a much higher temporal resolution. Continuous glucose monitoring is a powerful tool for identifying unrecognized hypoglycemia,7–9 and a regular SMBG regimen identifies only two-thirds of the number of hypoglycemic events indicated by CGM. 10
Continuous glucose monitoring was first introduced to the patient as a professional device: the patient wears the device for 72 h, after which a clinician analyzes the data to identify and adjust the insulin regimen responsible for hypoglycemia. 4 Over time, personal CGM has been introduced: the patient wears the device permanently as part of routine self-care and analyzes the data himself/herself. However, dissemination of personal CGM as a powerful self-care tool has been hampered due to the high cost, usability problems, training requirements, discrepancies with SMBG readings, and lack of insurance reimbursement.11,12 In a statement from 2010, the American Association of Clinical Endocrinologists 12 stressed the importance of professional CGM for a broad range of patients with diabetes. Furthermore, initiatives such as the new product by Medtronic, iPro™ 2 Professional CGM, approved on November 22, 2011, by the Food and Drug Administration, make it easier and faster for health care professionals to use professional CGM to evaluate their patients' glycemic control in order to optimize diabetes management.
Unfortunately, CGM devices are inaccurate, especially in the hypoglycemic range.13,14 Consequently, CGM shows a substantial rate of false negatives (FNs) compared with SMBG. 15 Although CGM offers a higher temporal resolution, its inaccuracy limits its applicability as a simple detector of hypoglycemic events. Therefore, various CGM recalibration algorithms have been developed. State-of-the-art recalibration algorithms are typically based on simplified linear regression models, which cannot perfectly depict the true complicated dynamics between IG and plasma glucpse.16–20 Sensor accuracy appears to be heavily influenced by the choice of recalibration procedure. 21 Black box pattern recognition classifiers for hypoglycemia detection prevent the shortcomings caused by unrealistic dynamics simplification, as they need not consider the complex IG-BG dynamics. Furthermore, the concept of pattern recognition can be appended to the existing recalibration algorithms, and pattern recognition tools have been used with success in other chronic diseases to detect events.22,23 Optimization of hypoglycemia detection in professional CGM is necessary when the clinician strives to identify and adjust insulin regimen responsible for hypoglycemia.
The aim of this study, therefore, was to develop a proof-of-concept pattern classification algorithm for retrospective hypoglycemia detection in professional CGM data.
Methods
Subjects and Data
The study population consisted of 10 subjects (all male, age 44 ± 15 years) with type 1 diabetes recruited from the Steno Diabetes Center, Denmark. Each subject was studied in two sessions at least 30 days apart. During both sessions, hypoglycemia was induced 2 h after the start of the session with a subcutaneous injection of insulin Aspart (NovoRapid, Novo Nordisk A/S, Denmark). The target plasma glucose (PG) nadir was 2.5 mmol/liter, and the insulin dose was estimated by an experienced diabetologist based on the PG concentration of the subject and the normal daily dose of insulin. The subjects wore a CGM device (Guardian RT®, Minimed Inc., USA) but were not given access to CGM readings. They attended the clinic 1 day prior to the session and were instructed by an experienced nurse in the use of the CGM device and how to calibrate it at least three times daily. During the session, the CGM device was calibrated by a nurse as indicated by the device. During each session, capillary blood samples were drawn every 10 min (or more frequently) in the period from insulin injection, during PG nadir, and to a PG rise above 70 mg/dl; otherwise, approximately every 30–60 min. The blood samples were analyzed with a HemoCue Glucose 201+ glucose analyzer (HemoCue®, Ängleholm, Sweden). The demographic characteristics of the subjects can be seen in
Characteristics of the Subjects Used in the Study a
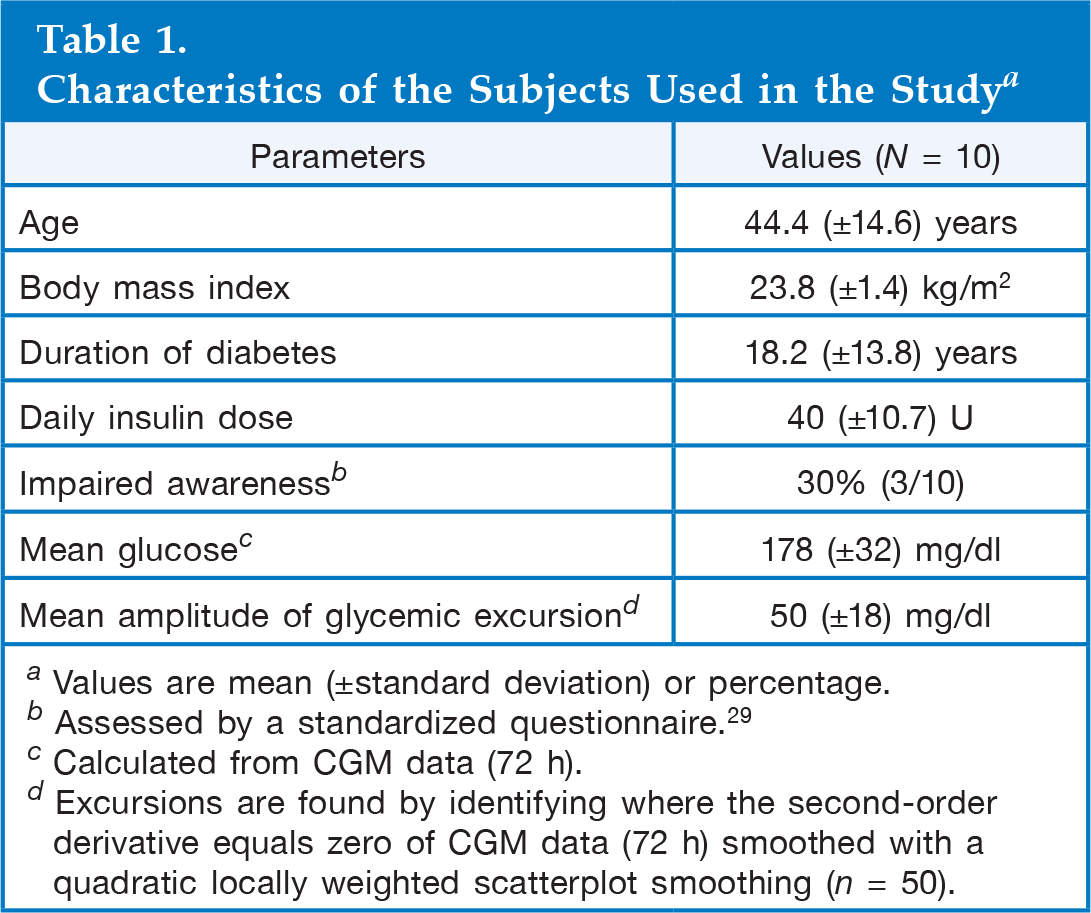
Values are mean (±standard deviation) or percentage.
Assessed by a standardized questionnaire. 29
Calculated from CGM data (72 h).
Excursions are found by identifying where the second-order derivative equals zero of CGM data (72 h) smoothed with a quadratic locally weighted scatterplot smoothing (n = 50).
Data sets from three of the 20 sessions were excluded because of CGM data dropouts of more than 15 min duration, leaving a total of 17 includable sessions from 10 subjects. Continuous glucose monitoring data were reconstructed using spline interpolation in dropouts shorter than 15 min. For classification evaluation purposes, a corresponding PG value for each CGM reading was generated by resampling PG, using spline interpolation at an interval of 5 min.
A “hypoglycemic event” was defined when at least one PG reading was ≤70 mg/dl.24–28 A following period of minimum 30 min with no PG readings below 70 mg/dl was defined as the end of the event.
Pattern Recognition Approach
Each CGM reading can be classified as belonging to one of two classes: hypoglycemia (PG ≤ 70 mg/dl) or nonhypoglycemia (PG > 70 mg/dl). This binary classification needs different characteristics (features), such as the slope of CGM readings the previous hour, to classify the CGM reading. Each classification can be evaluated and optimized by the value of the concurrent PG sample.
A number of features for discriminating between hypoglycemia and nonhypoglycemia were considered based on physiological characteristics and previous experience.
22
Some features were suggested in several time intervals around the CGM readings to be classified. The features are listed in
Features Tested for Their Ability to Discriminate between Hypoglycemia and Nonhypoglycemia a
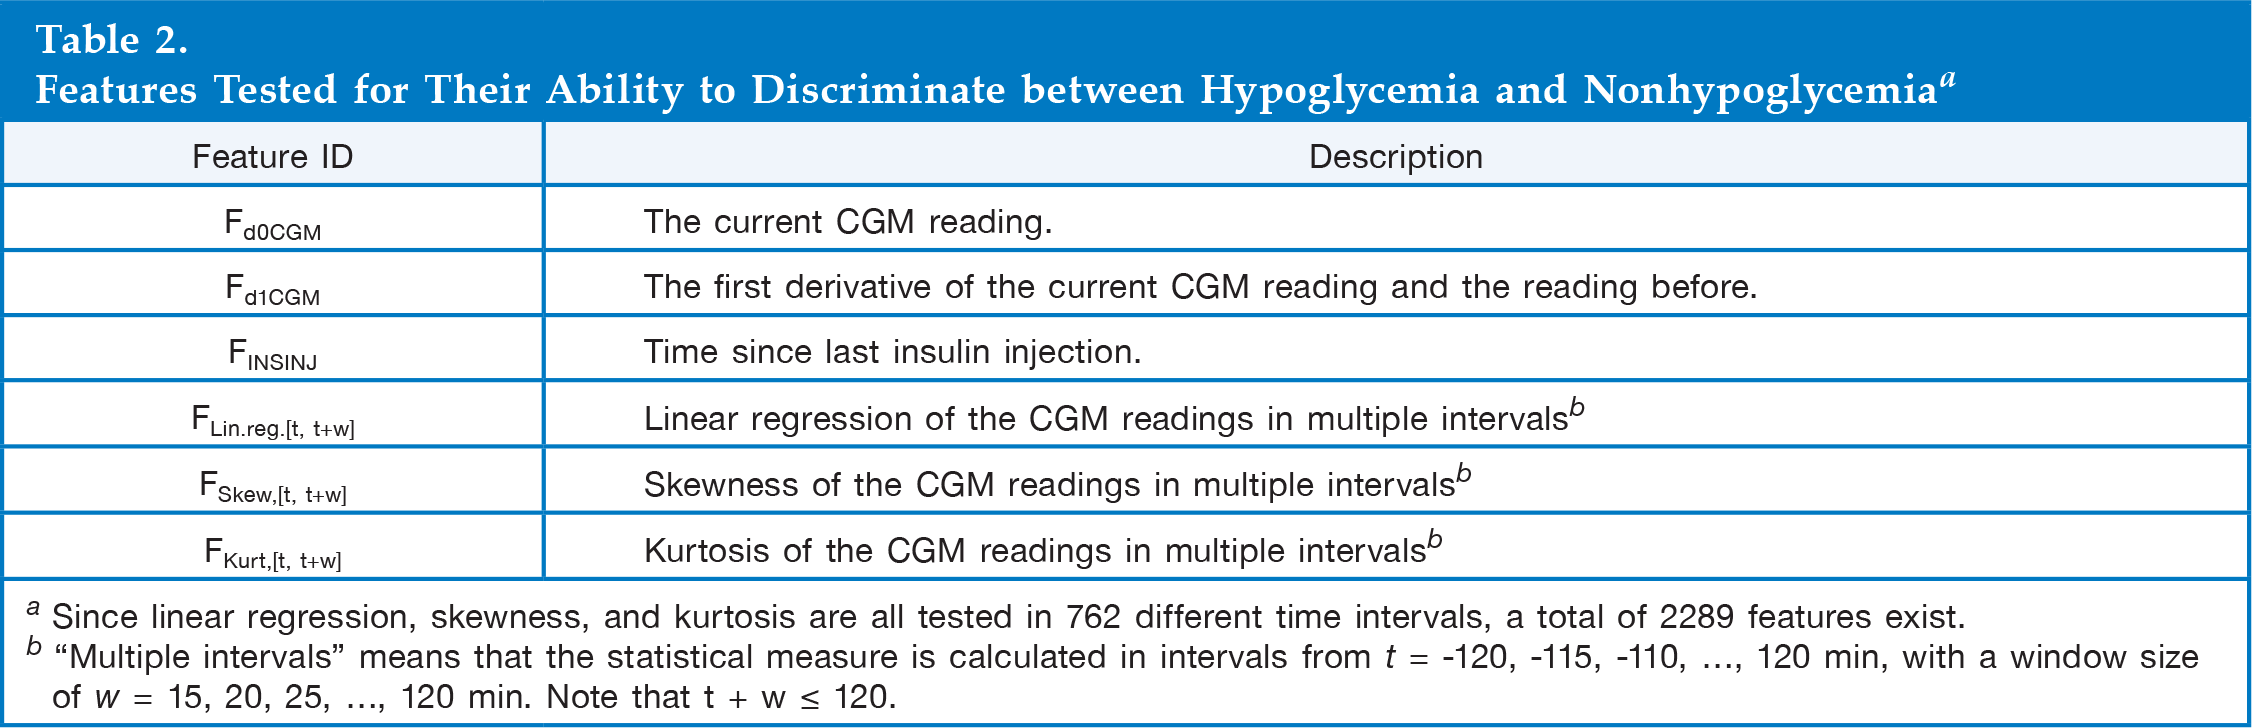
Since linear regression, skewness, and kurtosis are all tested in 762 different time intervals, a total of 2289 features exist.
“Multiple intervals” means that the statistical measure is calculated in intervals from t = −120, −115, −110, …, 120 min, with a window size of w = 15, 20, 25, …, 120 min. Note that t + w ≤ 120.
The fast SEPCOR algorithm 30 was used to make a rough feature elimination. In similar applications, SEPCOR has been used with success.22,30 A more delicate elimination of the remaining features was performed using the Forward Selection method. 31
The support vector machine method was used for pattern classification. 32 The algorithm was implemented in MATLAB® (R2011b, MA, USA), using the built-in support vector machine software. To avoid overfitting, leave-one-subject-out cross validation was applied during training. 33
Measures of Performance
The algorithm's ability to classify CGM readings correctly was evaluated with sample-based sensitivity and specificity measures derived from the following definitions: true positive (TP), CGM readings classified correctly as hypoglycemic; FN, CGM readings classified incorrectly as nonhypoglycemic; true negative (TN), CGM readings classified correctly as nonhypoglycemic; and false positive (FP), CGM readings classified incorrectly as hypoglycemic. Sensitivity and specificity were calculated for each subject in the leave-one-subject-out cross validation, and the mean of the sensitivity and specificity was used as the total sensitivity and specificity measures. A receiver operating characteristic (ROC) curve was calculated for each feature combination, and the area under the curve (AUC) was used as the total performance measure.
The performance of CGM alone (without a pattern recognition algorithm) compared with SMBG was evaluated by calculating sample-based sensitivity and specificity.
Measures of Usefulness
The algorithm's ability to detect hypoglycemic events was evaluated using event-based sensitivity and specificity. An event-based TP was defined as a minimum of four consecutive CGM readings classified as hypoglycemic, 34 where one or more of the readings had a concurrent capillary PG reading in hypoglycemia. An event-based FP was defined as none of the readings having a concurrent PG reading in hypoglycemia. An event-based FN was defined as no CGM readings classified as hypoglycemic during the hypoglycemic event. It was not possible to define an event-based TN, because it is impossible to interpret time without hypoglycemia as event-free. Instead of an event-based specificity, the number of FPs in the total sampling period is given. An additional measure for the degree of usefulness was to relate the result of the event-based sensitivity and FP with the difference between the PG and the CGM reading at the PG nadir. To characterize this difference in the data set, standard deviation and maximum and minimum difference across the hypoglycemic events were calculated.
The ability of the CGM device alone to detect hypoglycemic events was evaluated by defining a true detected hypoglycemic event as at least one CGM reading ≤70 mg/dl during the hypoglycemic event, eliminating issues induced by blood-to-interstitial fluid delay in glucose concentration. 12
Results
There were a total of 19 hypoglycemic events in the 17 data sets. Characteristics of the 19 hypoglycemic events can be seen in
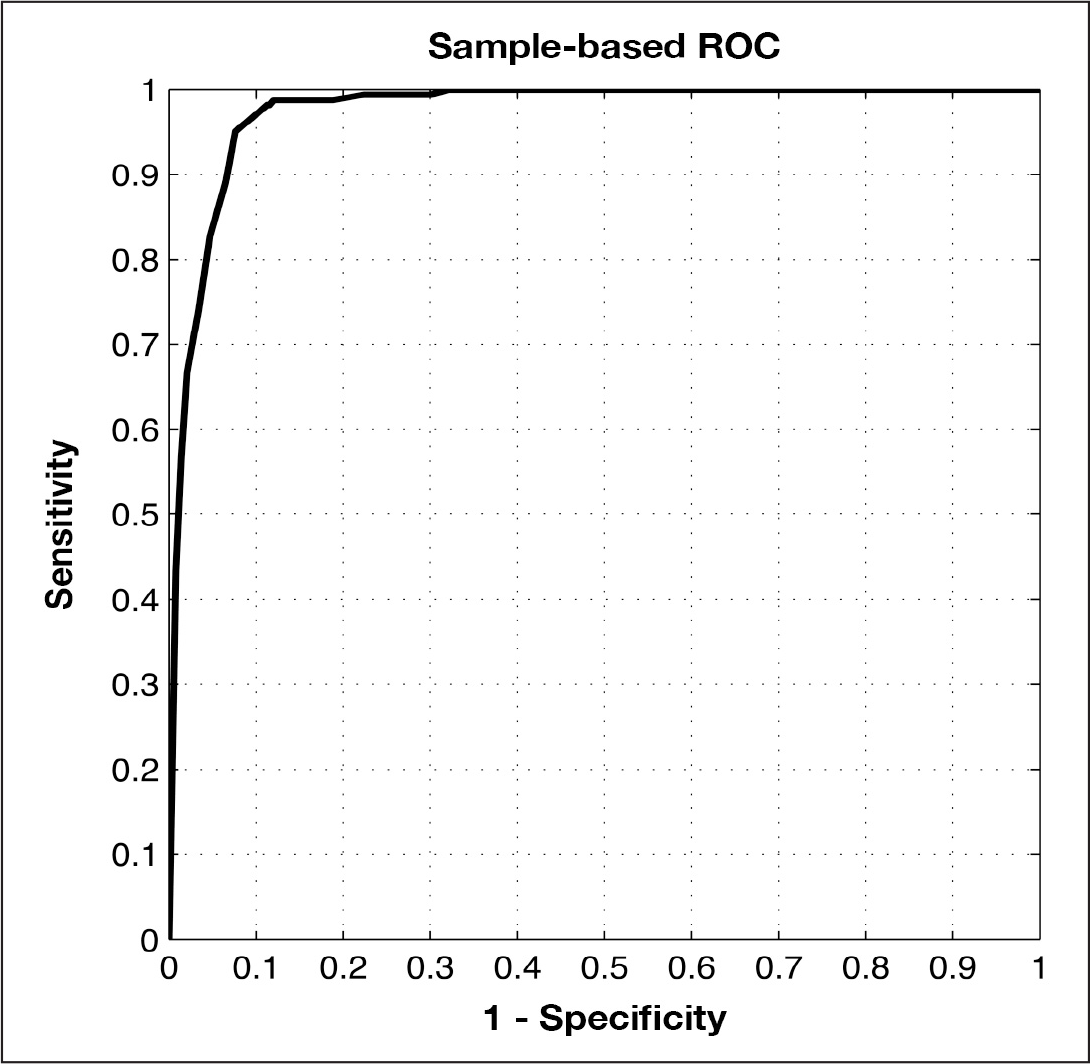
The graph illustrates the ROC curve with the largest AUC from the forward selection.
Characteristics of the Hypoglycemic Events in the Study a
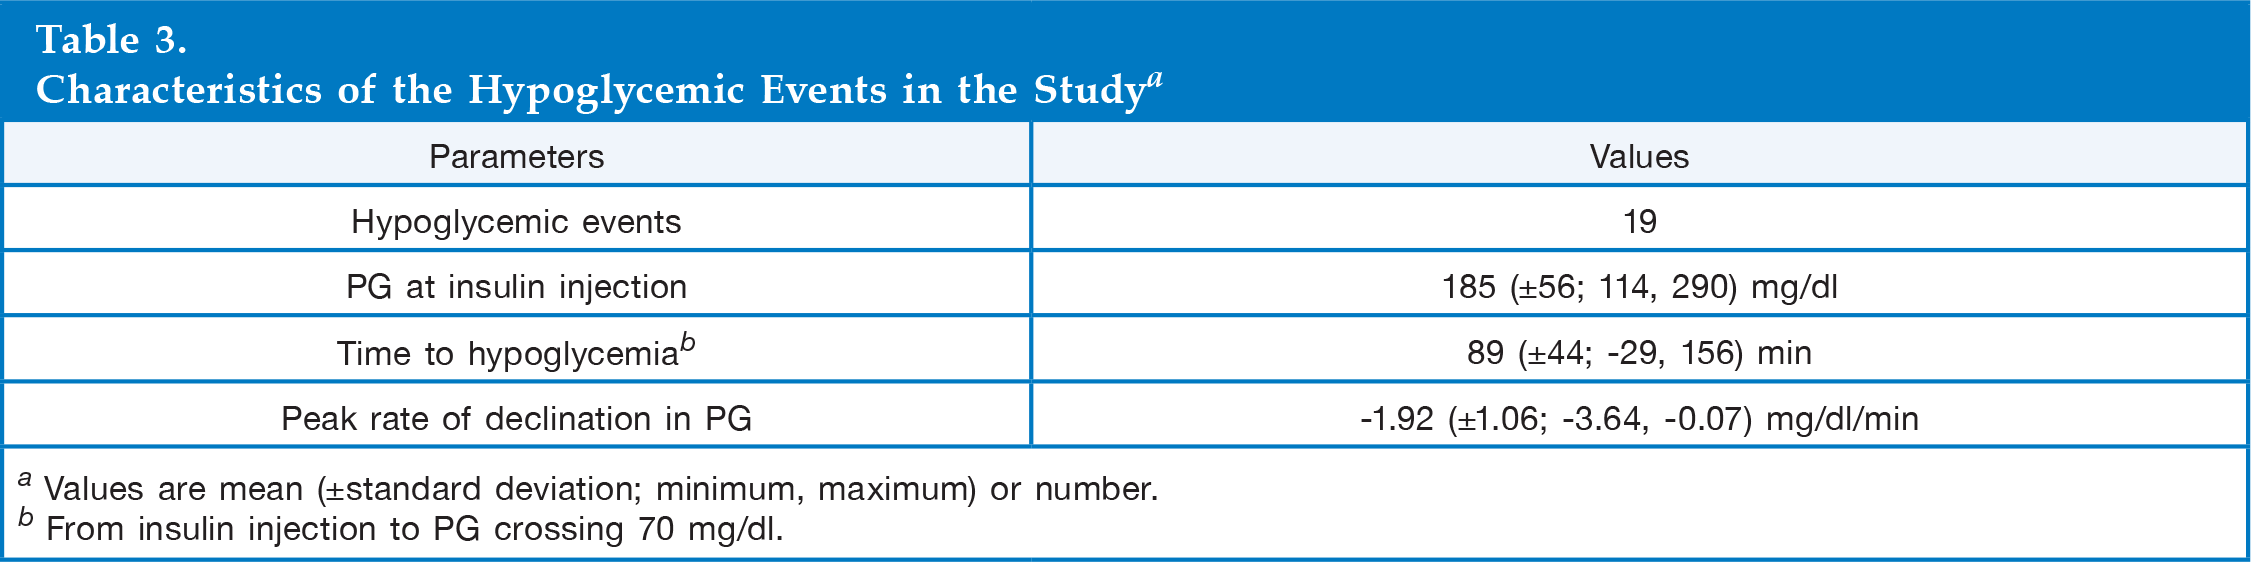
Values are mean (±standard deviation; minimum, maximum) or number.
From insulin injection to PG crossing 70 mg/dl.
The algorithm was configured differently by weighing the importance of each class. The weighting was done by setting the weighting parameters (W1 and W2) in the support vector machine function. The different configurations yielded the detections shown in
Classification Results of the Hypoglycemia Detection Algorithm Obtained by Weighing Sample-Based Sensitivity and Specificity a
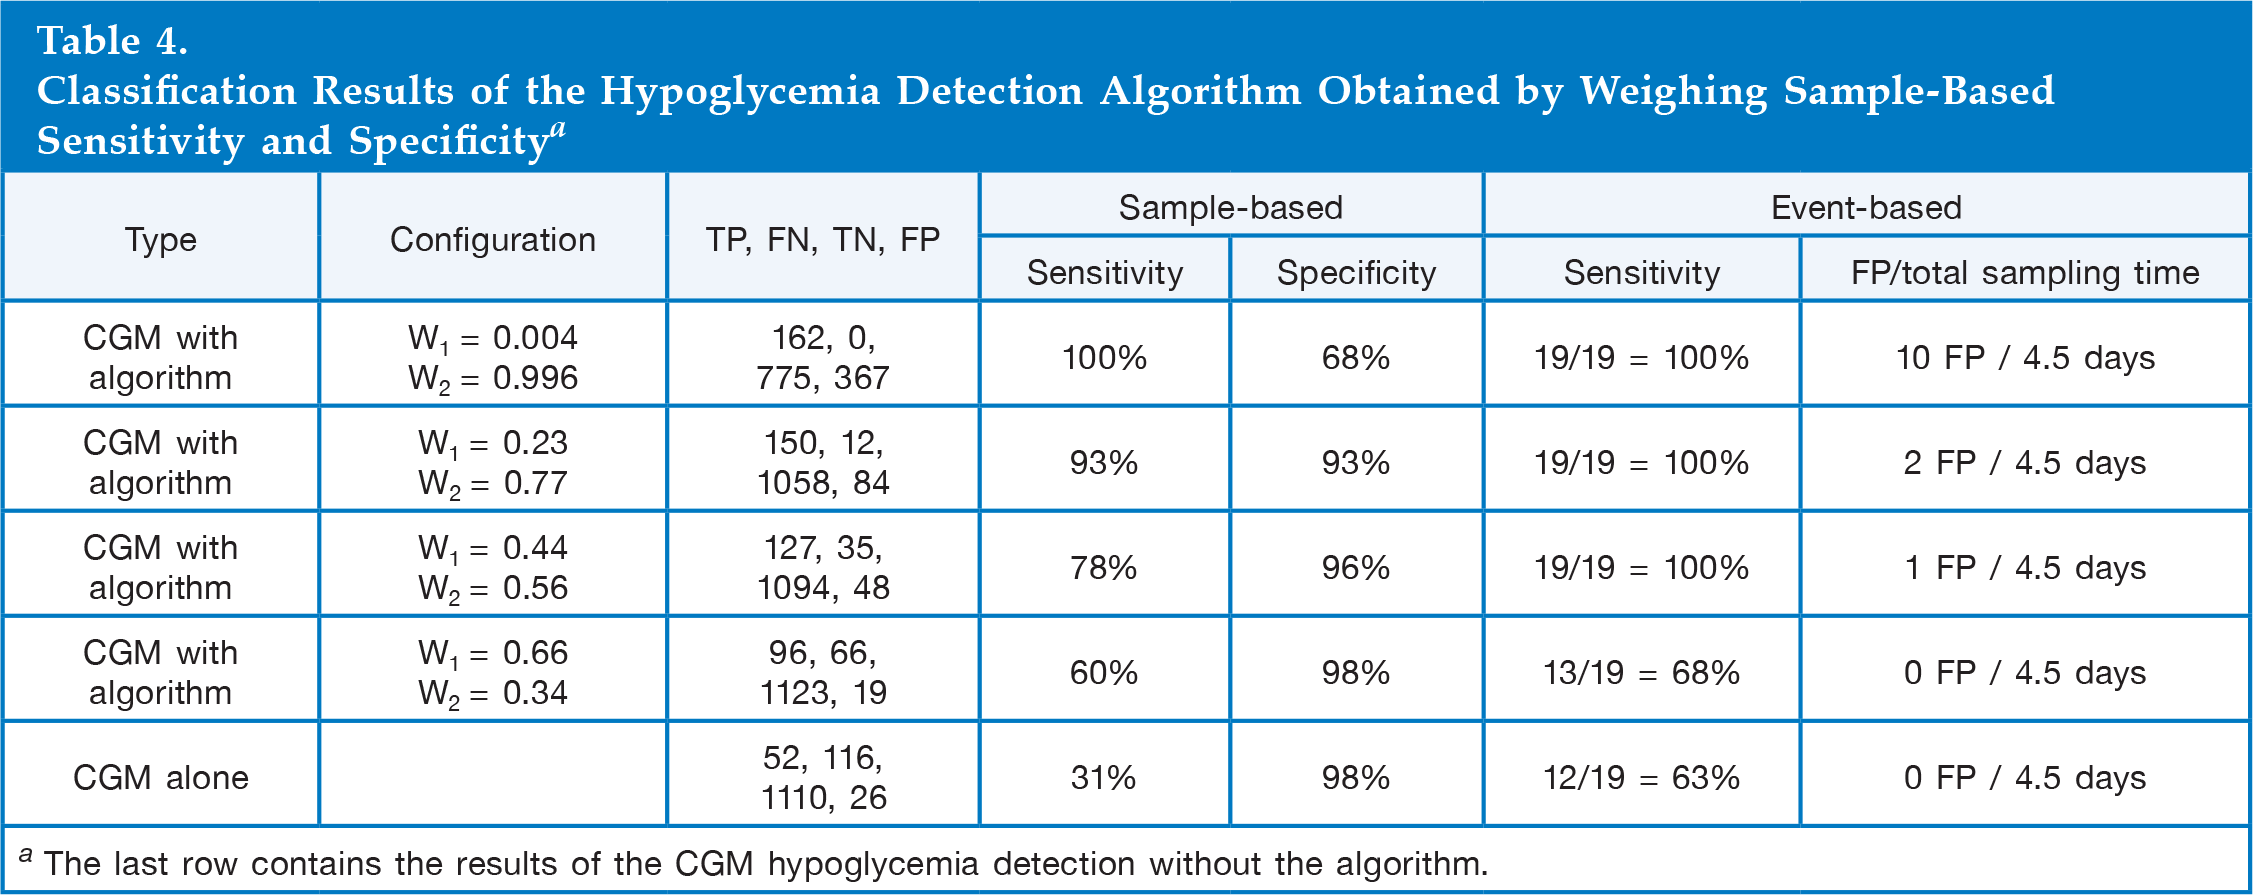
The last row contains the results of the CGM hypoglycemia detection without the algorithm.
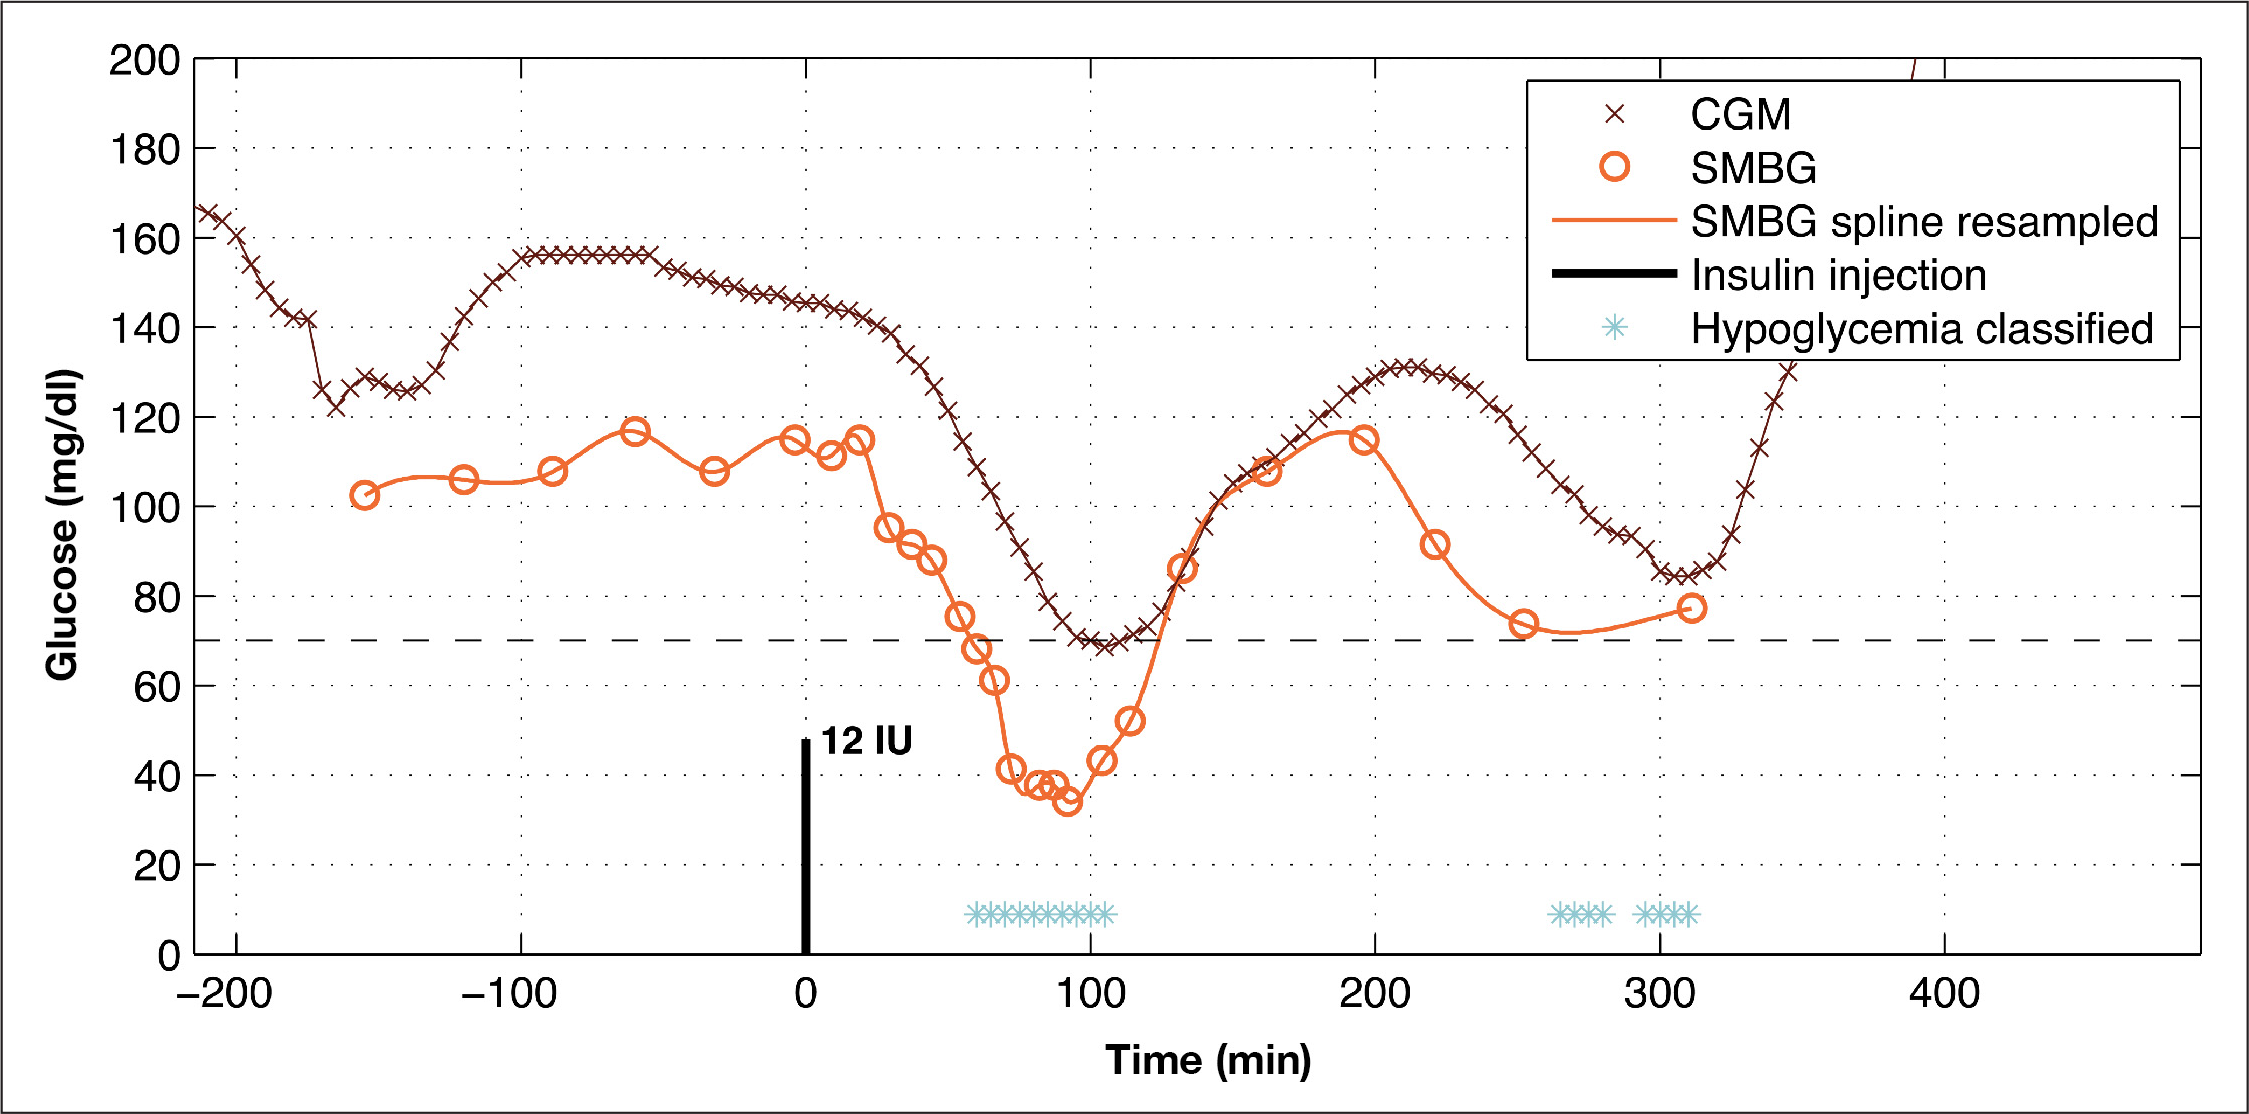
The subject experiences one instance of hypoglycemia during this session. The algorithm detects this event, but it also detects an event around 280 min after insulin injection, which is not confirmed by the PG readings.
Discussion
The pattern classification algorithm outlined in this article provides a means of detecting hypoglycemic events in data collected from professional CGM. The algorithm performs a continuous binary classification of each CGM reading by assessing characteristics of the CGM values and insulin injections.
Pattern classification is an emerging strategy for hypoglycemia detection improvement.23,28,35 While it is important to choose the most informative features and the best classification method, the efficacy is governed by other factors, e.g., calibration procedures, and patient characteristics such as hypoglycemia unawareness and autonomic neuropathy affect CGM data constitution and time in hypoglycemia.36,37 The best features did not include the first derivative (Fd1CGM), which, from a theoretical point of view, is surprising. However, the first derivative is sensitive to noise due to the estimation method used, and for this reason, the feature contributes little to class discrimination. More sophisticated first derivative estimators like Savitzky-Golay smoothing filters could be applied, but they extract information from the signal based on regression, which is already part of FLin.reg..
The sample-based hypoglycemia detection sensitivity and specificity levels of the CGM device reported in this study were 31% and 98%, respectively. Much higher sensitivities have been reported, ranging from 38% to 67%, whereas similar specificities are reported.21,38,39 One explanation for the incongruence could be the characteristics of the data used: the hypoglycemic events in the present study were induced by subcutaneous insulin injection and may not be representative of spontaneous hypoglycemia, while researchers in other studies have analyzed spontaneous hypoglycemic events. Spontaneous hypoglycemic events may exhibit less pronounced rates of decline in the IG compared with induced events. 40 This makes the time in the hypoglycemic range longer, thus facilitating CGM detection. The generalizability of the present study is thus limited because professional CGM should be performed on days that are representative of “typical” days. 41 The result of low sensitivity and high specificity may be an underestimation of the number of detected hypoglycemic events by the CGM device. Another limitation is the use of time since last insulin injection as a feature. Due to the clinical setup, a hypoglycemic excursion is expected after insulin injection, which might not be the case for spontaneous hypoglycemia. As a result, rate of change in PG and insulin may be falsely correlated.
These limitations entail new design considerations if the algorithm were to be validated on real-life patient data. Time since insulin injection could still be a feature, but maybe a more deliberate feature could be insulin-on-board. From the insulin type, bolus size, and time, insulin-on-board could be simulated by the well-reputed model by Berger and Rodbard 42 and simultaneous injections added by superposition. The effect of carbohydrate intake could be part of the algorithm as well. Many equations exist to calculate carbohydrate content of different meals, and several models exist to describe the gut-to-blood absorption. When these features, together with the former features, are extracted from a new, larger data set, the feature elimination has to be performed again to include characteristics of spontaneous hypoglycemic events. The other steps for evaluating the algorithm are the same as in this study.
The algorithm presented leads to a substantial improvement in sensitivity compared with the sensitivity of the CGM readings alone. The sensitivity improvement reported here is higher than the improvements reported in a study by Keenan and coauthors 38 (47% versus 27%), with a similar decrease in specificity (2%). This apparently better result, however, could be explained by the lower initial sensitivity of the CGM device. If the algorithm in this study had been tested on data from a CGM device of higher sensitivity, the improvement might have been less marked.
Event-based evaluation of hypoglycemia detection algorithms is not widely used. This may distort and hamper the results, because from a methodological point of view, the optimal sample-based sensitivity and specificity may not be the most useful in practice. This is clearly the case in the present study, as the most useful configuration of the algorithm was a configuration leading to an event-based sensitivity of 100% and one FP, whereas the event-based sensitivity was 100% and three FPs for the configuration using equal sample-based sensitivity and specificity.
An event-based sensitivity of 100% and one FP must be considered a significant improvement compared with the alternative, which, in the current data material, is a CGM hypoglycemia detection rate of 63% with zero FPs. Furthermore, the algorithm is robust to varying CGM accuracy: the incongruence between CGM and hypoglycemia SMBG values varies significantly with minimum difference of 4 mg/dl and maximum difference of 81 mg/dl. These promising results suggest that black box pattern recognition classifiers indeed may overcome the complex IG-BG dynamics modeling challenges in state-of-the-art recalibration algorithms. State-of-the-art recalibration algorithms and black box pattern recognition classifiers used in cascade may be an even more powerful constellation.
The event-based detection rate is obviously affected by the same factors as the sample-based detection rate. Hence, a general improvement of this size must not be anticipated in other populations and setups. Regarding the FP of the algorithm, a possible explanation for the error might be the infrequent BG readings. The two original BG readings (250 and 310 min after insulin injection in
In the present study, we apply a detection rule for converting sample-based, binary classified CGM readings to a detection tool for hypoglycemic events, and we compare the detection rate of the algorithm with the detection rate derived from conversion of CGM readings. Though such rule-based conversion of classified CGM readings is objective and in accordance with the manual interpretation processes applied by clinicians when interpreting CGM data, it remains a simplified and generalized approach to the art of medicine. This simplification should be considered, especially in light of the intended use of the algorithm, namely, to assist physicians and diabetologists in their retrospective analysis of CGM data.
Conclusion
The algorithm presented in this study provides a unique approach for optimizing hypoglycemia detection in professional CGM alone or following recalibration algorithms. By assessing several characteristics in the CGM signal and insulin injection, it is possible to detect all hypoglycemic events in people with type 1 diabetes, even though the correlation between BG and subcutaneous glucose may vary significantly. With this tool, the expert and the patient would be able to identify, for example, a postprandial hypoglycemic event caused by excessive insulin administration that had gone previously unrecognized with CGM alone and thereafter adjust the insulin or food intake to avoid similar situations. However, the algorithm needs to be tested on data from diabetes patients in natural settings before the potential therapeutic benefit can be determined.
Footnotes
Abbreviations:
This study was supported by Novo Nordisk A/S.