
Abstract
Fluorescence technique is one of the major solutions for achieving the continuous and noninvasive glucose sensor for diabetes. In this article, a highly sensitive nanostructured sensor is developed to detect extremely small amounts of aqueous glucose by applying fluorescence energy transfer (FRET). A one-pot method is applied to produce the dextran-fluorescein isothiocyanate (FITC)-conjugating mesoporous silica nanoparticles (MSNs), which afterward interact with the tetramethylrhodamine isothiocyanate (TRITC)-labeled concanavalin A (Con A) to form the FRET nanoparticles (FITC-dextran-Con A-TRITC@MSNs). The nanostructured glucose sensor is then formed via the self-assembly of the FRET nanoparticles on a transparent, flexible, and biocompatible substrate, e.g., poly(dimethylsiloxane). Our results indicate the diameter of the MSNs is 60 ± 5 nm. The difference in the images before and after adding 20 μl of glucose (0.10 mmol/liter) on the FRET sensor can be detected in less than 2 min by the laser confocal laser scanning microscope. The correlation between the ratio of fluorescence intensity, I(donor)/I(acceptor), of the FRET sensor and the concentration of aqueous glucose in the range of 0.04–4 mmol/liter has been investigated; a linear relationship is found. Furthermore, the durability of the nanostructured FRET sensor is evaluated for 5 days. In addition, the recorded images can be converted to digital images by obtaining the pixels from the resulting matrix using Matlab image processing functions. We have also studied the in vitro cytotoxicity of the device. The nanostructured FRET sensor may provide an alternative method to help patients manage the disease continuously.
Introduction
Diabetes is one of the leading causes of death in the world. 1 This chronic disease can result in circulatory problems and may lead to kidney failure, heart disease, gangrene, and blindness. 2 Routinely monitoring glucose level in body fluids, such as blood, urine, and cerebrospinal fluid, is vital for diagnosing and improving the therapeutic treatment of diabetes. The most widespread device used for monitoring glucose is the blood glucose biosensor.3–5 However, it is inconvenient for patients to prick their fingers several times a day for blood sugar monitoring. Complications due to improper self-management are often reported and bring extra burden to the health care system and global economy. For this reason, efforts have been made to develop noninvasive and continuous glucose sensors. Different techniques have been used for continuous glucose monitoring that do not measure blood glucose directly but may rely instead on measuring glucose levels in other biological fluids, such as interstitial tissue, saliva, urine, and tears. 6
Tear fluid is more accessible than other body fluids, e.g., interstitial fluid, and is more continuously obtainable and less susceptible to dilution than urine. Studies on the correlation of tear glucose and blood glucose have been reported since the 1980s. 7 Sen and Sarin 8 studied over 200 cases, and their statistic results showed that blood glucose is approximately two times higher in diabetes patients (∼11 mmol/liter) compared with nondiabetics (∼5 mmol/liter), whereas tear glucose levels are ∼5 times higher in diabetes patients than in the general population. 9 It was also noted that the mean values of tear glucose for diabetes patients and nondiabetics are 0.35 ± 0.04 mmol/liter and 0.16 ± 0.03 mmol/liter, respectively.8,10,11 The discrepancy may be caused by the different detection systems and sample collectors. Thus, a highly sensitive glucose sensor is normally required for detecting glucose in tears.
Concanavalin A (Con A), a protein, has a strong affinity with glucose and is also able to bind to polysaccharide, such as dextran. 12 Applying a fluorescence technique to detect the competitive reaction between glucose and dextran to Con A results in accurate measures.13,14 Fluorescence energy transfer (FRET) between two specific fluorescent molecules has been applied in different biosensors or bioimaging since it was discovered in the 1950s.15,16 It is caused by the photon–electron interaction and depends on the distance between the fluorescent donor (D) and acceptor (A). The excited electron in donor fluorophore can transfer its excitation energy to a nearby acceptor chromophore without radiation. To detect the glucose reacting with Con A, different organic dyes and quantum dots have been applied in FRET pairs to form fluorophore (D)–protein (Con A)–fluorophore (A). Once the glucose conjugates to the protein (Con A), a double module can be used to characterize the dependence of both flourescent intensity (I) and wavelength (λ) as the function of the concentration of glucose. The pair can be rhodamine and fluorescein isothiocyanate (FITC) or Cy3 and Cy5. 17
However, the instability of proteins limits their application in continuous measures, which makes it a challenge to monitor glucose at lower concentrations using a protein sensor. With the development of nanomaterials, protein is immobilized on or within nanostructures, including nanoparticles, nanorods, and nanostructured thin films. Studies have demonstrated that nanostructured materials are able to enhance the stability of proteins and achieve a large amount of proteins at nanoscale. 18 Here we apply mesoporous silica nanoparticles (MSNs) to conjugate Con A labeled with a FRET pair, e.g., tetramethylrhodamine isothiocyanate (TRITC) and FITC (FITC–dextran).
There are three major reasons that make MSNs ideal materials for a FRET carrier. First, the large porous properties of MSNs allow loading a large amount of organic molecules, which lead to a high ratio of fluorescent-dye-to-protein, up to 1400-fold.19,20 This has the potential to impart a high degree of sensitivity to fluorescence sensors. In addition, our previous studies indicate that MSNs can significantly protect the organic dye/proteins from photobleaching or decomposing.21,22 Due to the large surface area, nanostructures can act as an analyte, e.g., glucose, reservoir, which is helpful for uniform immobilization and high loading of glucose.
Experimental Detail
Materials
Fluorescein isothiocyanate–dextran [molecular weight (MW) 9 kDa,150 kDa, and 2 MDa] was purchased from Sigma-Aldrich, St. Louis, MO. Tetramethylrhodamine isothiocyanate (Molecular Probes) labeled with succinyl–Con A was purchased from E. Y. Laboratories Inc. (San Mateo, CA). Glucose, from Sigma-Aldrich, was dissolved in distilled deionized water at neutral pH.
Conjugation of Fluorescence Energy Transfer Pair in Mesoporous Silica Nanoparticles
A total of 9.3 mg of FITC–dextran was mixed with 15 μl of 8-aminopyrene-1,3,6-trisulfonate (APTS) in 2.5 ml of ethanol under dry nitrogen atmosphere. After 2 h, 350 μl of tetraethoxysilane was added in the mixture, which was stirred for 5 h under the nitrogen atmosphere. The APTS–FITC–dextran conjugate solution was protected from light during the reaction to prevent photobleaching of FITC. Surfactant solution was prepared separately by dissolving 0.177 g hexacetyltrimethyl ammonium bromide in 85 ml distilled water at 80 °C. A total of 1.5 ml of ammonium hydroxide was added as catalyst to hydrolysis and condensation of the silica polymerization. Afterward, the cationic surfactant solution was mixed with APTS–FITC–dextran. The solution was stirred at 80 °C for 24 h. The pH of the reaction mixture was adjusted to ∼9. The nanoparticles were separated through centrifuging at 5000 rpm for 10 min. The product was washed by water/acetone/ethanol three times. The reaction mixture pH was adjusted to 9. The nanoparticles were separated from the reaction mixture by centrifugation at 5000 rpm for 10 min. The product was washed by water/acetone/ethanol (1:1:1) three times. Following that, dried 2.0 mg of FITC–dextran-loaded MSNs were mixed with TRITC–Con A in phosphate-buffered saline (0.5 mg/m) and then shaken in darkness for 24 h. The final product was vacuum-dried in powder.
Immobilization of Mesoporous Silica Nanoparticle–Fluorescein Isothiocyanate–Dextran– Concanavalin A–Tetramethylrhodamine Isothiocyanate on Poly(dimethylsiloxane)
Poly(dimethylsiloxane) (PDMS) was used as a substrate. The base PDMS (Sylgard 184 silicone elastomer, Dow Corning) was mixed with the curing agent in a 10:1 ratio. The mixture was degassed and spin coated on a modified silicon wafer followed with curing for 4 h at 80 °C. After cooling, the PDMS substrate was easily peeled off and cut. In our study, the thickness of the PDMS substrate was 120 μm. The PDMS substrate was pretreated with an air plasma for 10 s and then quickly immersed in a solution of (3-aminopropyl)-triethoxysilane (10%) for 2 h to functionalize the surface with positive charges. Meanwhile, sulfonated polystyrene (SPS) (sodium form, MW = 70,000 g/mol) and poly(diallyldimethyl ammonium chloride) (PDAC) (MW = 200,000 g/mol, 0.01 M based on repeat unit) were mixed in deionized water (>18 M/cm, Millipore Milli-Q, Billerica, MA). The FITC–dextran–Con A–TRITC@MSNs was suspended in PDAC/SPS. Ten bilayers of PDAC/SPS with nanoparticles were then assembled on this PDMS substrate, prepared with 200 μm thickness to promote nanoparticle adhesion. Subsequently, 1–3 bilayers of PDAC/FITC-dextran-Con A-TRITC@MSNs were deposited onto the adhesion layers.
Characterization of Fluorescence Energy Transfer Sensor
Scanning electron microscopy (SEM) and transmission electron microscopy (TEM) were used to characterize the MSNs, and the immobilized FITC–dextran–Con A–TRITC@MSN on PDMS. A Zeiss laser confocal scanning microscopy (LCSM) was run under the laser excitation wavelength (λex) at 490 nm. The maximum fluorescence intensities, I(D) and I(A), are centered at the emission wavelength (λem) at 520 nm to donor and 570 nm to acceptor, respectively.
The correlation between fluorescence properties and the concentration of aqueous glucose was studied by a spectrofluorometer (QuantaMaster™30, PTI, Birmingham, NJ). The nanostructured FRET sensor was stabilized on a sample holder for thin film measurement. With λex = 490 nm, the emission scan range was run from 485 to 610 nm with 0.2 step size. The ratio of the maximum fluorescence intensities, I(D) and I(A), at the two fluorescence emission wavelengths (λem) was 520 ± 5 and 570 ± 5 nm, respectively, as the function of the concentration of aqueous glucose from 0.04–4 mmol/liter in 20 μl were measured. Such measures were repeated for 5 days: fluorescence signals of the device, FITC–dextran–Con A–TRITC@MSNs on the PDMS, were measured twice a day (at 9:00 am and 5:00 pm, respectively) for 5 days, with corresponding glucose concentrations 0.04–4 mmol/liter to evaluate the durability of the sensor for possible continuous glucose monitoring.
Image Signal Process
The recorded images by a portable fluorescence microscope (Zarbeco, LLC) were converted to the readable signal through Matlab's imaging process. The method is described as follows.
First, images of the FRET sensor corresponding to the different concentrations of aqueous glucose were taken by a portable fluorescence microscopy (40X, pixels 640 × 480) with λex = 490 nm. The external environment was kept the same during the measures. The intensity and color of the recorded pixels on the images only depend on the concentration of glucose. Images were then loaded into signal processing software by using the imread function with red, green, blue (RGB) matrix. The image file was input into an m–n–3 data array that defines RGB color components for each individual pixel. Next, the image was converted into the im2double function. In this imaging conversion process, the background of image matrix was removed from the FRET sensor image to obtain the pixels from the resulting matrix.
Cytotoxicity of the Nanostructured Fluorescence Energy Transfer Sensor
The biocompatibilities of porous silica nanoparticles, PDMS (i.e., the substrate for the optical sensor chip), and nanostructured optical sensor-laden hydrogels have been studied by using human umbilical vein endothelial cells (HUVEC) as previously reported.23,24 In addition, we have studied the cytotoxicity of our synthesized nancomposited lens materials. A total of 10,000 HUVEC cells were seeded into a 96-cell culture plate and incubated in a 5% CO2 incubator overnight. Samples, including hydrogel p inorganic nanostructure-coated silicones, were chopped into small pieces and incubated with the cells for 24 h. The percentage of live and dead cells was accessed by using MultiTox-Fluor Multiplex Cytotoxicity Assay Kit (Promega, CA). Briefly, the reagent was added to a 96-well plate and incubated at 37 °C for 30 min, and the resulting fluorescence signals were measured at an excitation of 400 nm and an emission of 505 nm for live cells then at an excitation of 485 nm and an emission of 520 nm for dead cells.
Results and Discussion
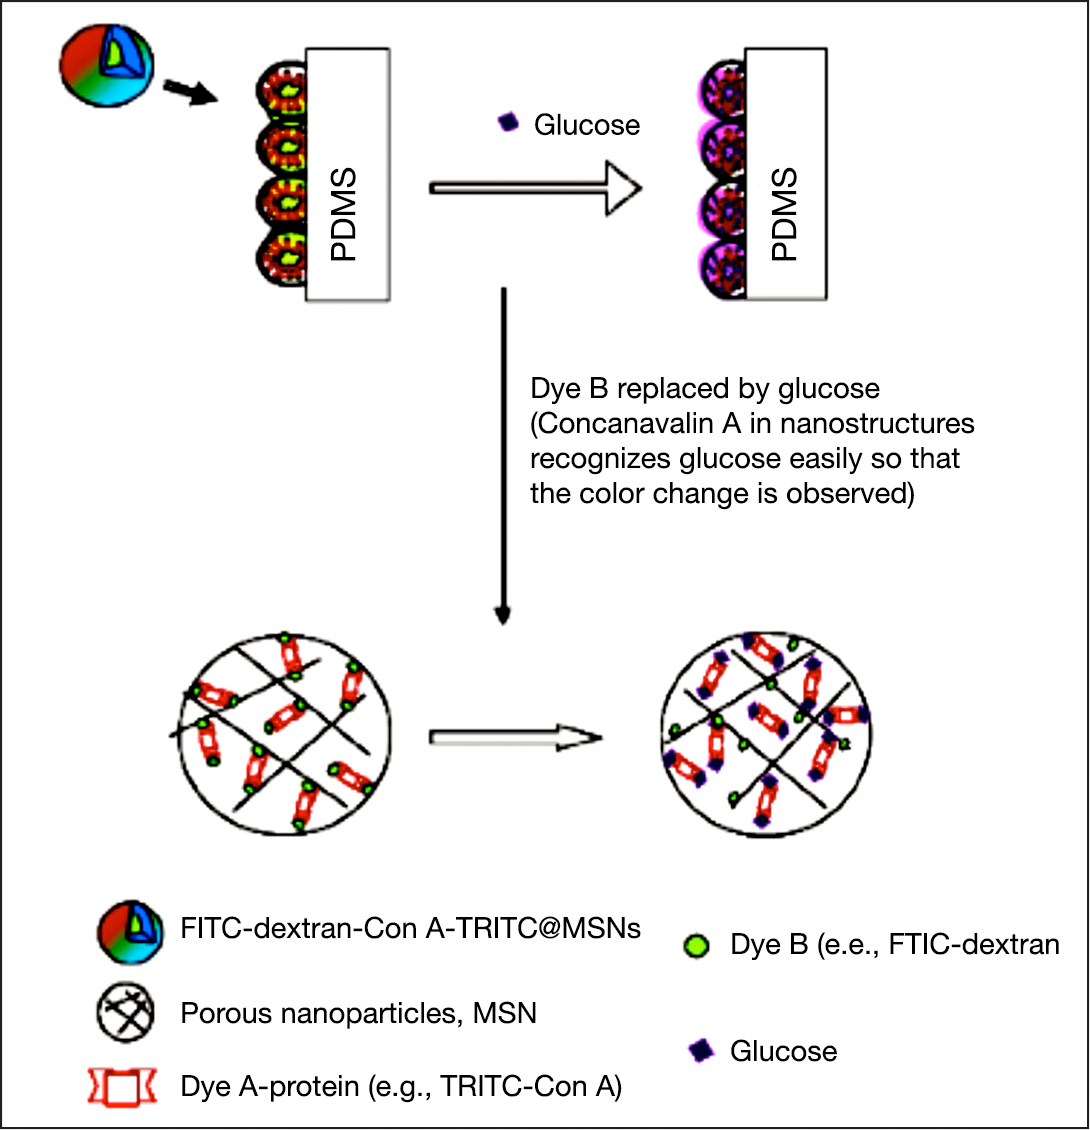
Steps for producing the nanostructured FRET sensor for monitoring glucose.
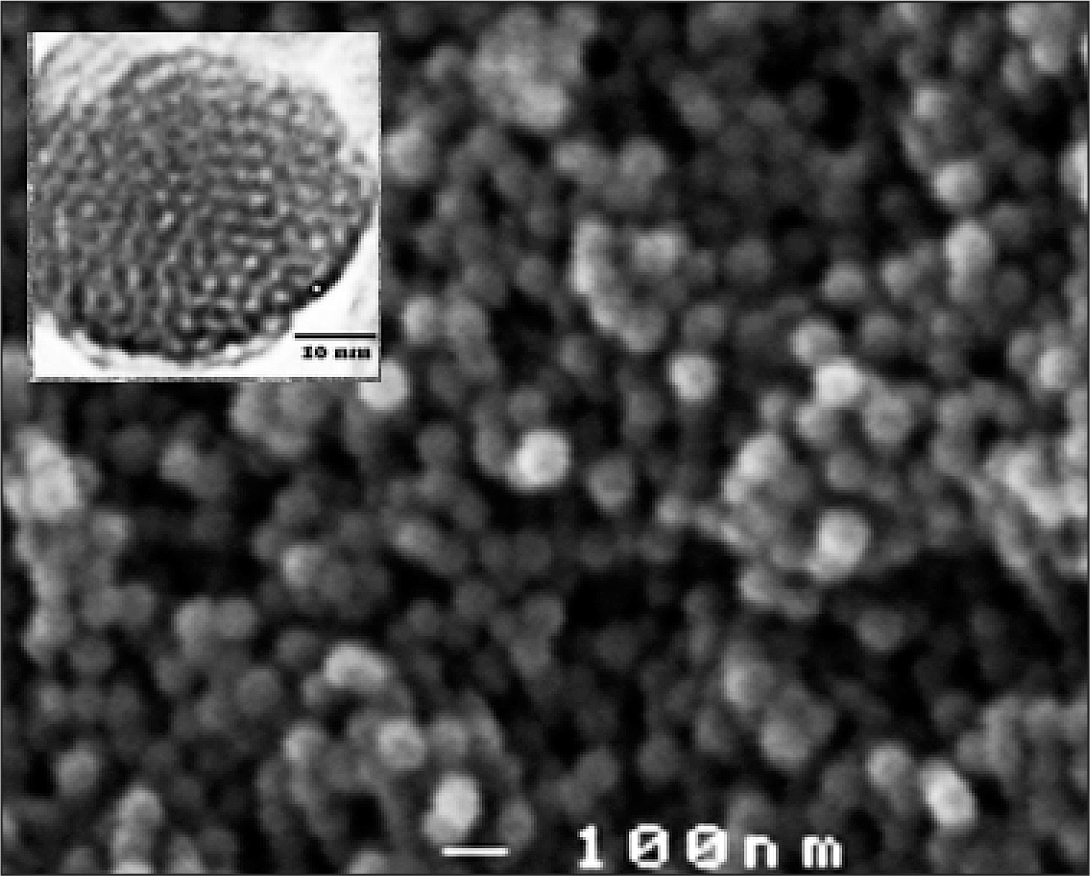
Scanning electron microscopy micrograph of assembling FITC–dextran–Con A–TRITC@MSNs on PDMS. The small image refers the TEM micrograph of porous silica nanoparticles conjugating FITC–dextran–Con A–TRITC. The average diameter of nanoparticles is approximately 60 ± 5 nm.
Dextran–FITC has two functional reaction sites. One allows the conjugation of FITC onto MSNs through the ionic bound; the other is the covalent chemical bound between dextran and Con A labeled with TRITC. The two organic dyes lead to the phenomenon of FRET, which is confined in nanoscale. Fluorescence energy transfer is a fluorescence property dominated by the distance between two organic fluorescent molecules. Due to the stronger affinity between Con A and glucose than that of Con A and dextran, the signal of FRET will be changed as shown in
Laser confocal scanning microscopy was carried out with the excitation at λex = 490 nm to investigate how quickly the color of the nanostructured FRET sensor changed before and after adding the 20 μl of glucose with 0.10 mmol/liter. The LCSM micrographs had two detect channels, λem = 520 and 570 nm, respectively.
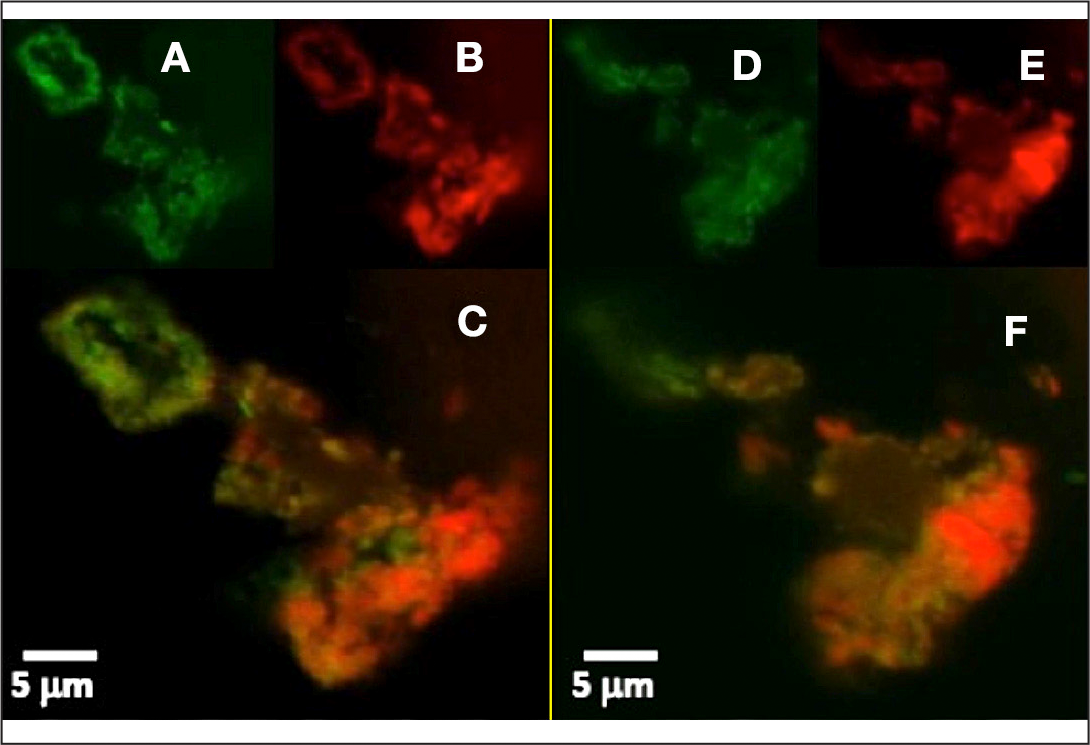
Laser confocal scanning microscopy images:
Furthermore, we studied the correlation between the FRET and the concentration of glucose. An excited wavelength at 490 nm was applied to excite the electron of FITC, which has an emission wavelength at 520 nm. The excited electronic state of FITC may transfer its excitation energy to TRITC conjugated on Con A through long-range dipole–dipole interactions. The phenomenon is reflected by the emission peak of the TRITC, the neighbor of FITC, at 570 nm. The fluorescence intensities of the donor, FITC, and acceptor, TRITC, are denoted as I(D) and I(A), respectively. The ratio of the I(A)/I(D) is determined as the function of the concentration of glucose. Correlation between I(A)/I(D) and the concentration of aqueous glucose.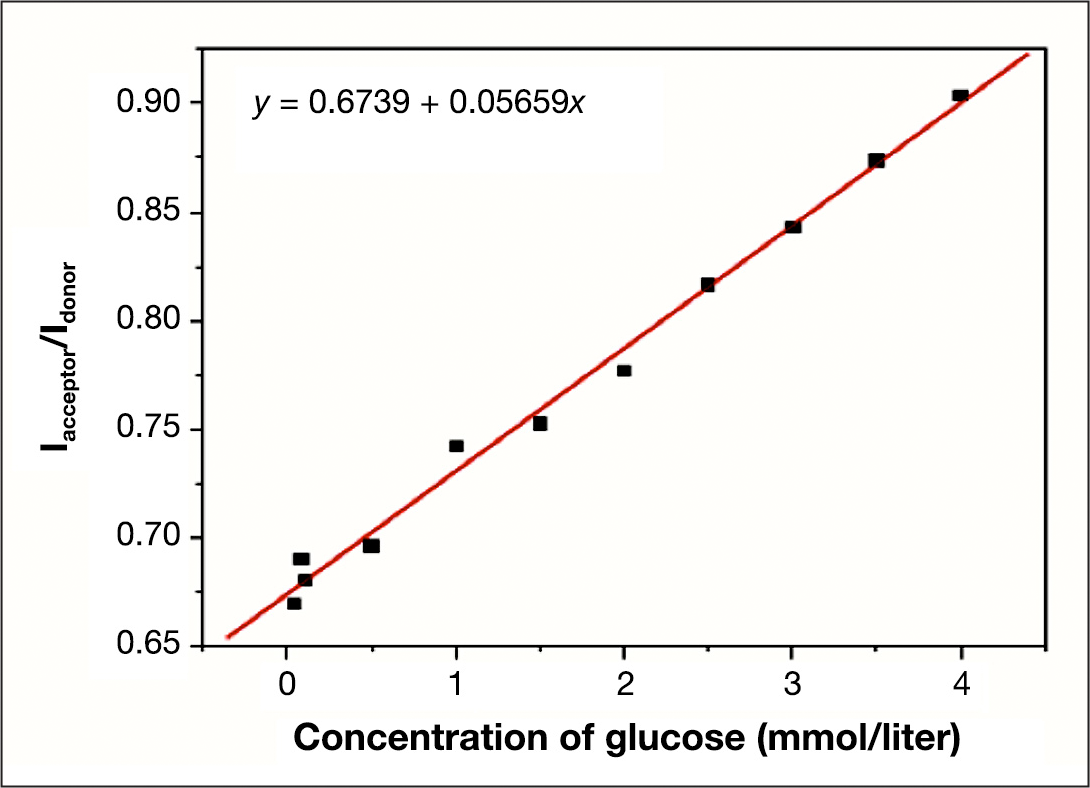

To further study the duration of the sensor, we repeated the discussed measures for 5 days.
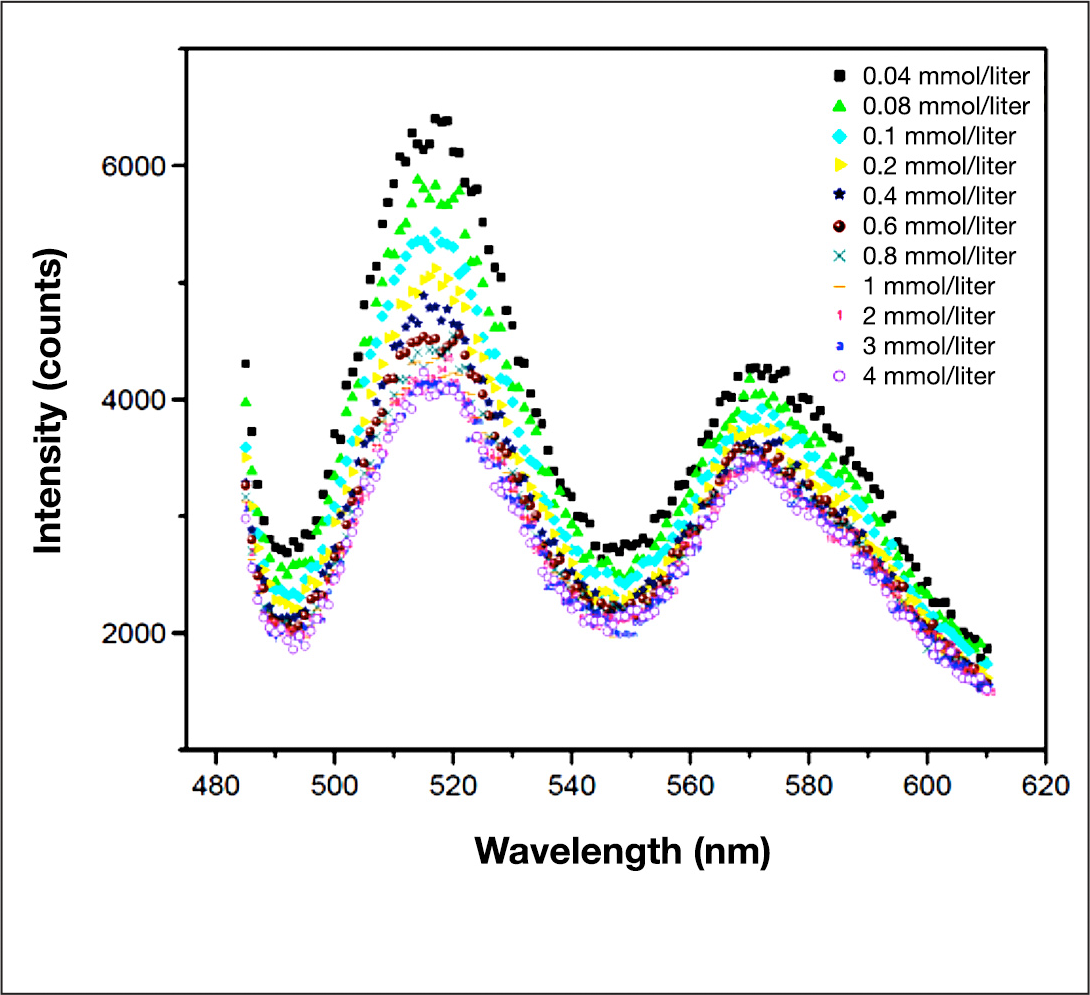
Fluorescence spectra as a function of the concentration of glucose, which can be monitored continuously for 5 days.
To be able to build a portable glucose monitoring system, the FRET signals according to the different concentrations of glucose can be monitored by a portable fluorescence microscope (40X, pixels 640 × 480). The images taken can be converted to the readable signals through the Matlab image process functions: an m–n–3 data array for the RGB image followed with the im2double function to convert the RGB to the digital image. We have studied 10 images corresponding to the concentration of glucose in the range of 0.04 to 4 mmol/liter.
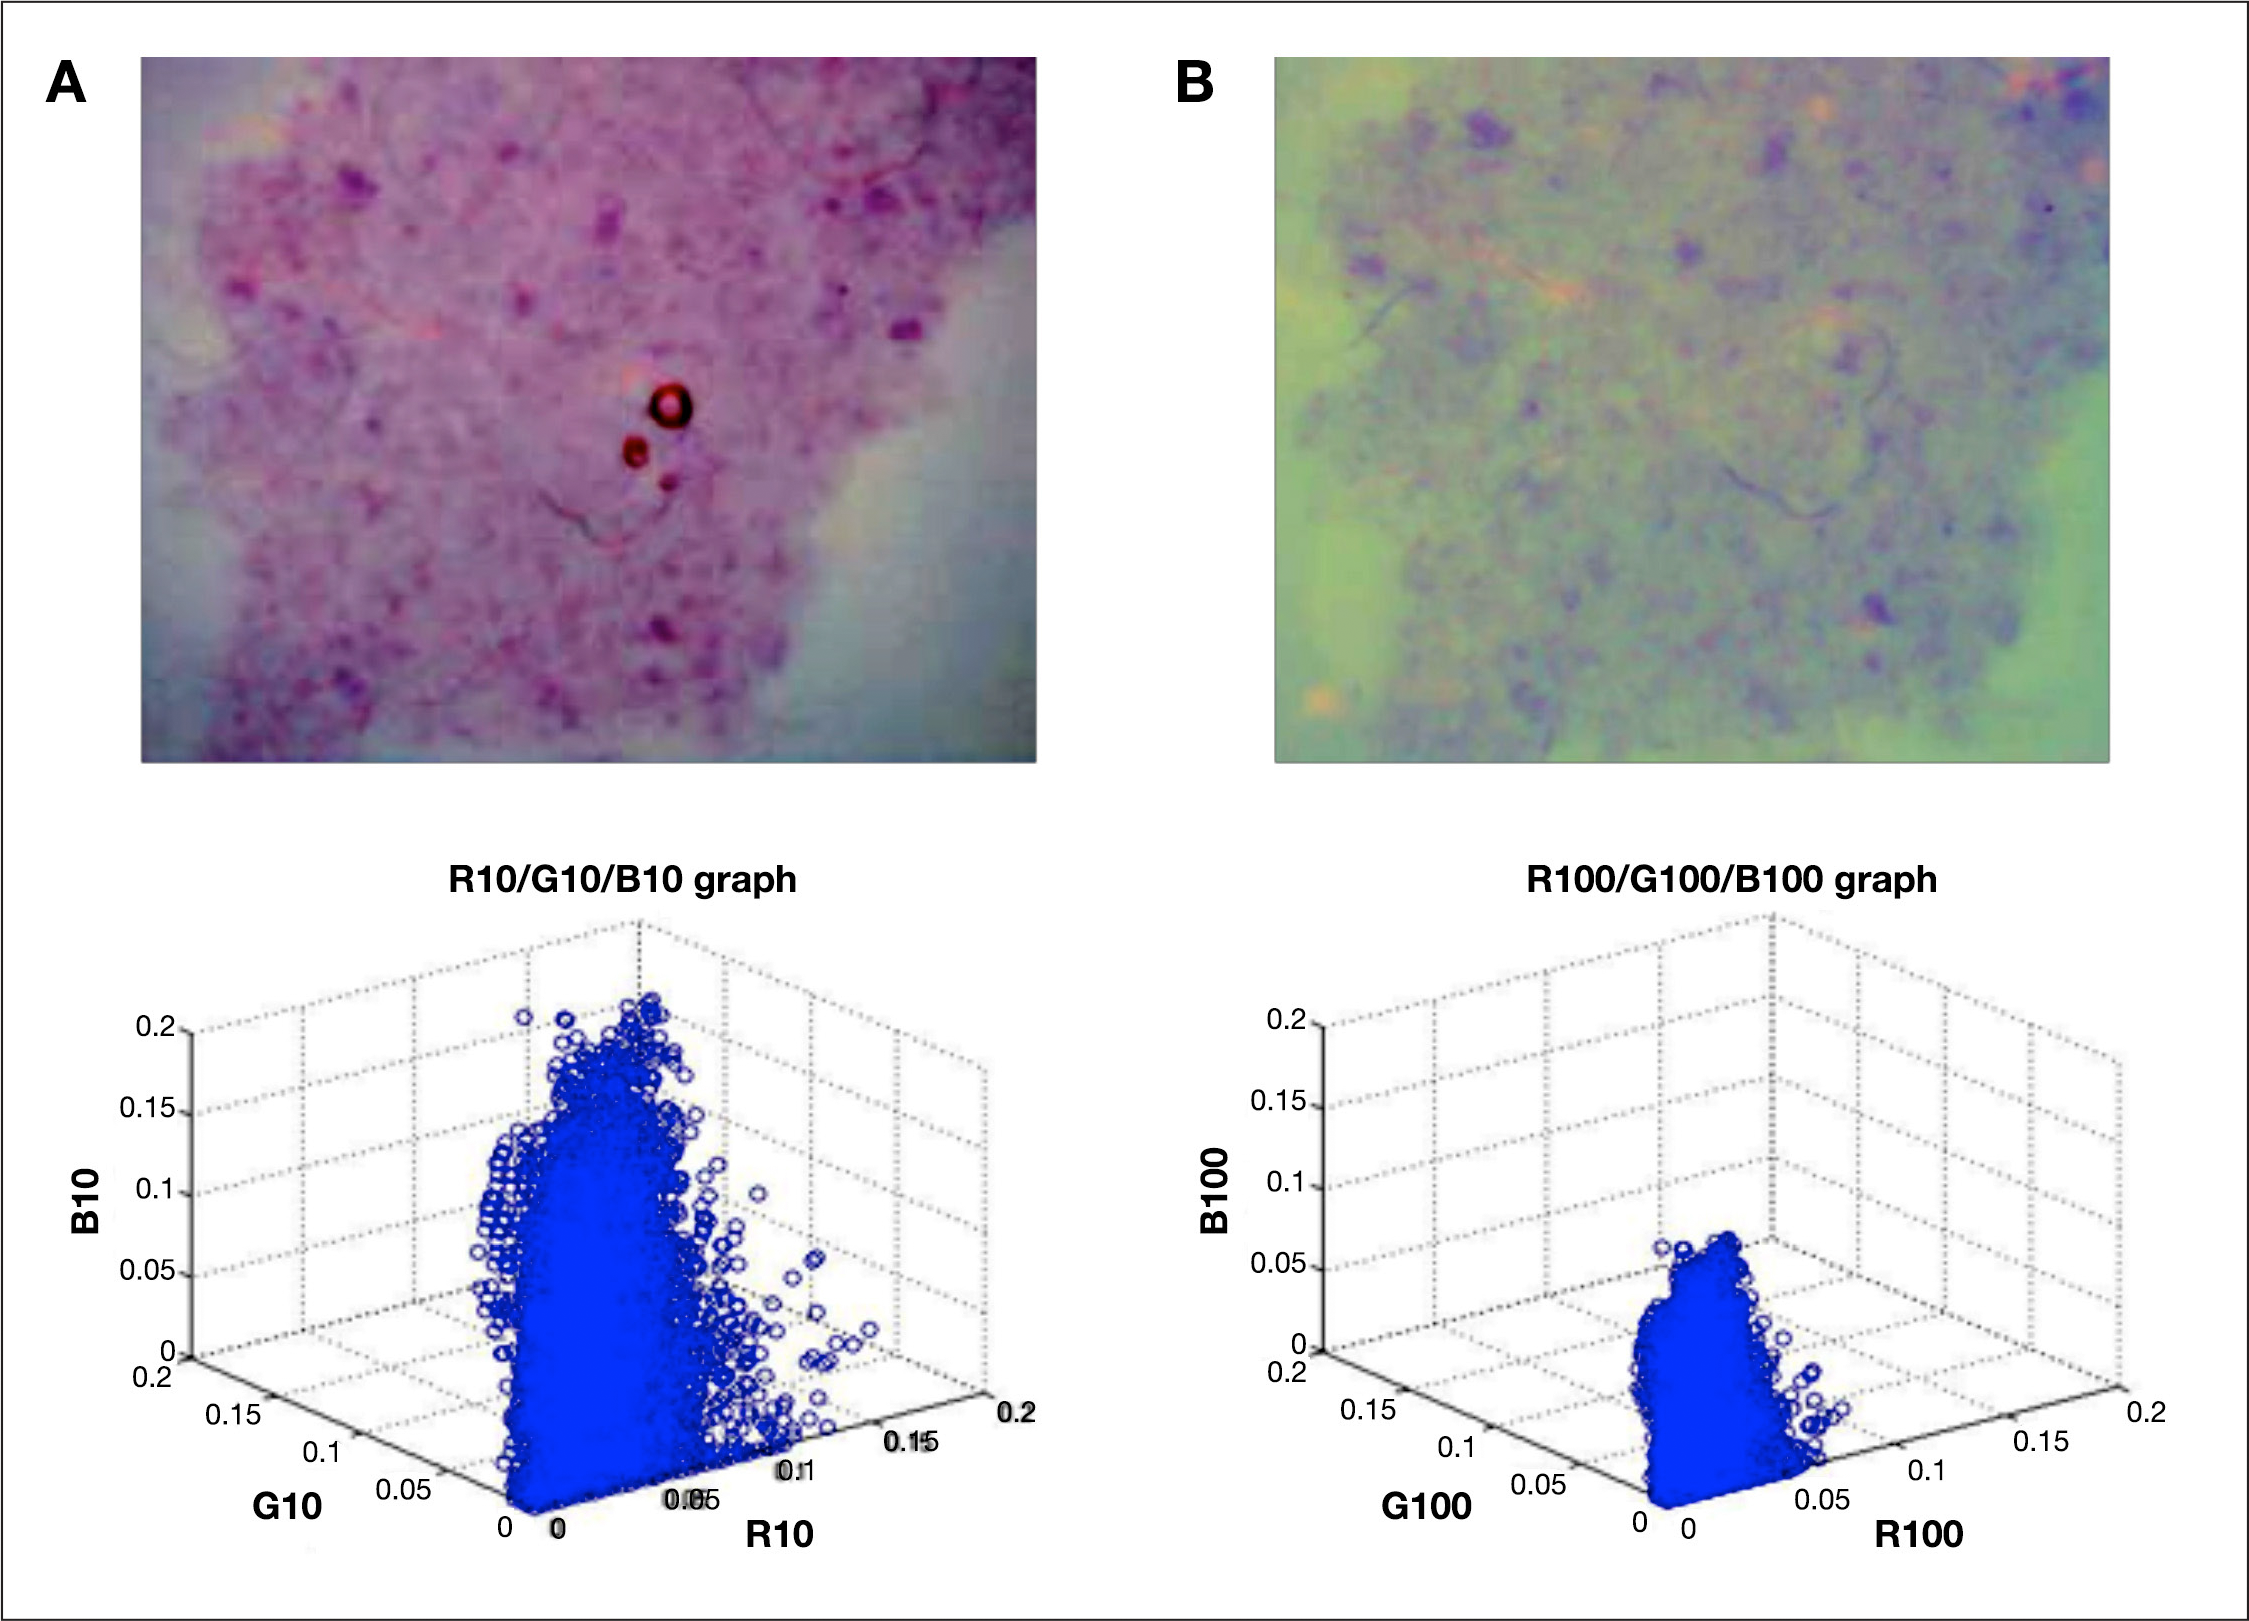
Image versus readable signal to the FRET sensor; the concentration of (A) 0.05 mmol/liter and (B) 1 mmol/liter.
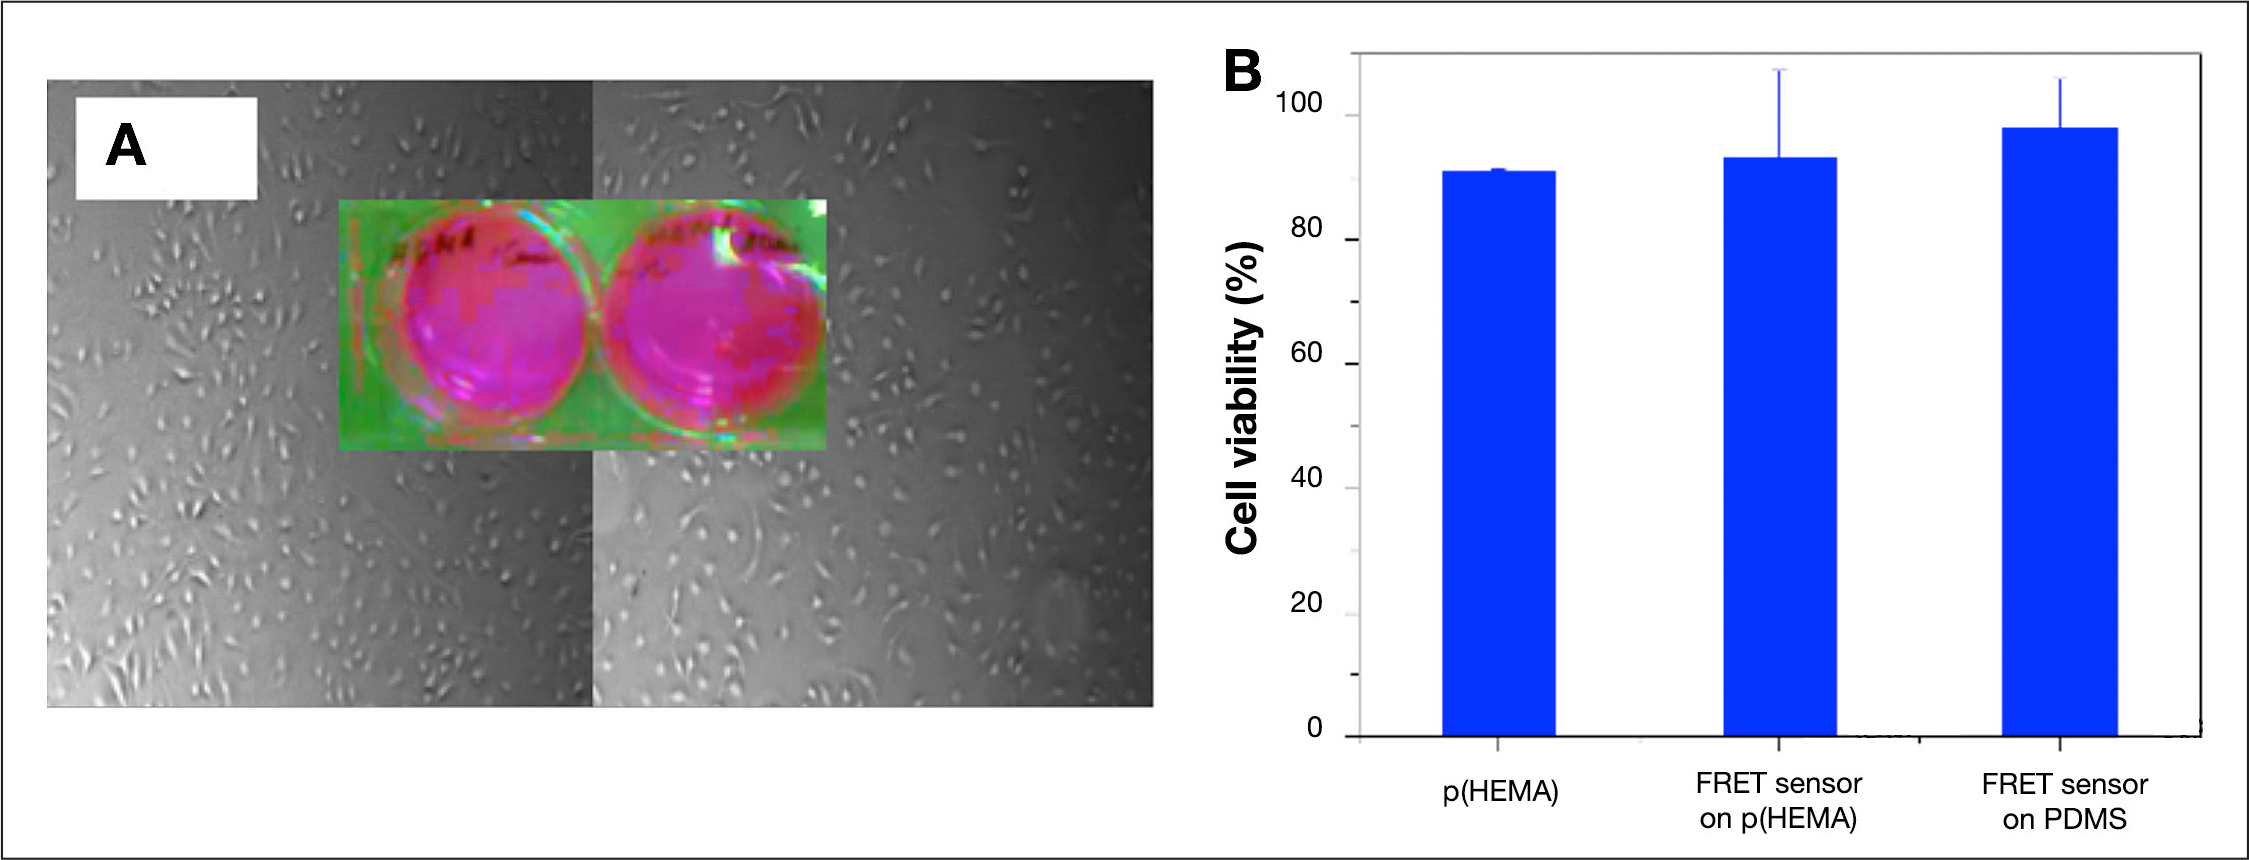
The response of HUVEC to the FITC–dextran–Con A–TRITC@MSN on PDMS were further investigated.
Conclusions
In summary, by harnessing the advantageous of mesoporous nanoparticles, MSNs, a nanostructured FRET glucose sensor has been developed for detecting the extremely small amount of aqueous glucose with a broad concentration range of 0.04 to 4 mmol/liter in 20 μl. The measure range is appropriate for the tear glucose concentration range of diabetes patients. The advantages of MSNs lie in their porous structures, which makes the sensor act as an analyte reservoir. Furthermore, the nanostructured optical probe has a highly sensitive reaction with aqueous glucose due to the high concentration of FRET-labeled Con A at nanoscale. It takes no more than 2 min to detect the change in the LCSM images before and after adding 20 μl of glucose (0.10 mmol/liter) on the FRET sensor by LCSM. The linear relation of I(A)/I(D) and the concentration of glucose is found using a fluorospectrometer. Furthermore, the durability of the FRET sensor was evaluated for 5 days. The positive results demonstrate that the nanostructured FRET sensor can be used for continuous glucose monitoring. In addition, the images obtained by a portable fluorescence microscope with low resolution can be converted to digital signals according to the different concentration of glucose, which may provide the opportunity to build a portable fluorescence sensor. Furthermore, the in vitro cytotoxicity study shows that the device is biocompatible: over 90% cells were kept alive for 5 days. It is expected that the FRET sensor with nanostructures may provide an alternative method for monitoring glucose levels noninvasively and continuously.
Footnotes
Abbreviations:
This research project is funded by the Western Innovation Fund, the Canada Foundation for Innovation, and the Grant Challenges Canada—Canadian Rising Stars in Global Health.