
Abstract
Importance
Pituitary adenomas (PAs) present a notable economic burden on healthcare systems due to their management’s reliance on multimodal, often costly interventions.
Objective
To determine total and relative healthcare costs for PAs at Ontario-based institutions.
Design
A retrospective, propensity-score-matched cohort analysis.
Setting
Ontario, Canada, encompassing public healthcare facilities and covering costs over a 6-year study period.
Participants
Adults diagnosed with PA (n = 1675) between April 1, 2013, and March 31, 2019, compared to a general population cohort and a hospitalized control cohort matched on demographics and health factors.
Intervention/Exposures
Analysis of healthcare cost components (inpatient, outpatient, and diagnostic services) and cost trajectories postsurgery for PAs.
Main Outcome Measures
Primary outcome was total annualized healthcare costs for patients with PA relative to the general and hospitalized cohorts. Relative costs were estimated using a negative binomial regression model.
Results
Of 1675 patients with PA, total annualized costs were $49,992. Highest total costs were associated with inpatient hospitalization ($24,796) and physician services/diagnostic evaluations ($20,075). After propensity score matching, patients with PA had 12.7 times higher costs [95% confidence interval (CI) (10.9, 14.8), P < .0001] during the preadmission/admission period, which remained elevated postoperatively (P < .05). Total costs did not differ between patients with PA and the hospitalized cohort [RR 0.97, 95% CI (0.92, 1.03); P = .3271] in the preadmission/admission period; however, follow-up costs were 37% lower for patients with PA in the 1st follow-up year [RR 0.63, 95% CI (0.51, 0.77); P < .0001], and up to 50% lower by the 5th year [RR 0.50, 95% CI (0.36, 0.68); P < .0001].
Conclusions
This study provided a comprehensive assessment of the economic burden of PAs on the publicly-funded healthcare system. Patients with PA had higher annualized total costs across all observed time periods compared to the general population and lower annualized total costs compared to patients admitted to a surgical ward.
Relevance
This study highlights the financial impact of PA management on healthcare resources and provides a basis for future research aimed at cost-efficiency improvements in long-term PA care.

Keywords
Introduction
Healthcare spending has demonstrated an upward trend in high-income countries over the last 2 decades, with overspending expected to continue to rise.1,2 Understanding the cost of healthcare delivery could transform the value of healthcare but requires the education of medical consumers and decision-makers on the cost-generating components of healthcare.3,4 Pituitary adenomas (PAs) are a rare but severe endocrine disorder, accounting for 10% to 15% of all diagnosed intracranial tumors. 5 PA management varies but is reliant on a multimodal paradigm of surgical and nonsurgical interventions to reduce mortality and improve quality of life, which can incur substantial economic impacts. 6 Retrospective population-based studies indicate that over 6000 Americans undergo PA surgery annually, with costs exceeding $200 million.7-9 However, the breakdown of these costs is poorly understood and a comprehensive cost evaluation for long-term perioperative care of patients with PA, including analysis of cost-contributing factors, is lacking. Past analyses on the economic burden of PA care have failed to provide a comprehensive analysis of the perioperative process. An accurate evaluation of the longitudinal economic burden of disease is crucial for policymakers and clinicians to enhance efficiency and transparency in healthcare spending and develop cost-containment strategies. This population-based study presents a comparative analysis to explore direct healthcare costs and utilization of treatment for patients with PA in Canada.
Methods
Study Design
This study was a retrospective, matched cohort study using administrative health data from ICES, an independent, nonprofit research corporation funded by the Ontario Ministry of Health and Long-Term Care (MOHLTC) that captures all publicly funded healthcare encounters. 10 This study was approved by the Ottawa Hospital Research Institute Research Ethics Board (20170946-01H). As a retrospective analysis of existing de-identified data, patient consent was not required. This study was reported in compliance with the recommendations of the Consolidated Health Economic Evaluation Reporting Standards Statement. 11
Setting
Ontario, the most populous province in Canada, contains over 14 million residents and represents approximately 40% of the Canadian population. The Ontario MOHLTC provides publicly funded healthcare to all Ontario residents as paid by taxation revenues. 12 The public system provides free care at the point of service for all medically necessary physician and hospital-based care.13,14 Additional details on the study setting are presented in the Methods section of the Supplemental Appendix.
Population
The target population was adults with a PA diagnosis, that is, aged 18 years and older at the time of diagnosis. Diagnosis of PA was based on the International Classification of Diseases, 10th Revision, Clinical Modification (ICD-10-CA code D35.2). The study population included patients that were hospitalized during the index period (April 1, 2013 and March 31, 2019) with a most responsible diagnosis (MRDx) of PA. The first date of admission during the index period was defined as the index date. Cases were obtained from the Discharge Abstract Database (DAD), a database that contains demographic, clinical, and administrative data of all hospital admissions in Ontario. Additional details on the study population, including exclusion criteria, are presented in the Methods section of the Supplemental Appendix.
Data Set
Patient-level sociodemographic factors, including age, sex, and neighborhood income (in quintiles) at baseline were extracted. Health status was assessed based on comorbidities. Comorbidities were classified based on 9 disease flags [Crohn’s, congestive heart failure (CHF), chronic obstructive pulmonary disease (COPD), diabetes, rheumatoid arthritis, hepatobiliary problems, dementia, human immunodeficiency viruses (HIV), and asthma]. Data on cost from the publicly funded care, including hospital records from acute care, emergency department, inpatient rehabilitation, inpatient complex-continuing care, residential long-term care, physician billings, and outpatient drug prescriptions for eligible individuals were linked to the base cohort over the study period. The sociodemographic and health status data were linked to patient-level healthcare utilization and cost data using encrypted patient-specific identifiers.
After defining PA diagnosis, additional definitions for treatment were applied. Patients treated with surgery for their PA were identified using Ontario physician fee codes N112 or Canadian classification of health interventions codes (Supplemental eTable 1). Prescription drug costs were evaluated for patients with pharmaceutical coverage by the MOHLTC (persons aged 65 or over that received Ontario Drug Benefit coverage).
Two control cohorts were selected: a general population cohort and a hospitalized cohort. The general population cohort was selected from the Registered Persons Database, which contains information on those who are registered under the Ontario Health Insurance Plan and who are eligible for the Ontario Drug Program. Those who were alive on April 1, 2013 were assigned a random index date. The hospitalized cohort was selected from the DAD with the same exclusions as the cases.
Matched cases and controls were observed over 6 time periods. The first period was measured from 180 days prior to the index admission date until the index discharge date (that is, preadmission and admission period). The second period included encounters from the index discharge date to 1 year following the discharge date (follow-up year 1). The subsequent third to sixth periods were divided into 1-year intervals of the following 2 to 5 years (follow-up years 2-5). Person days for each costing period were truncated at the earliest of the date of death, date of last contact, or March 31, 2021, whichever occurred first.
Outcomes
The primary outcome was annualized total healthcare utilization and costs associated with patients with PAs receiving care during the specified time periods. Patient-level costs were derived based on the utilization of healthcare services in the administrative databases during the study period, and provincial total healthcare expenditures were estimated using previously published methods. 14 Secondary outcomes were: (1) relative healthcare utilizations and costs associated with patients with PA in comparison to a matched cohort of patients in the general population that did not have the diagnosis and were alive on the earliest date of admission (that is, April 1, 2013); and (2) relative utilizations and costs derived from a comparison to a matched cohort of hospitalized patients admitted.
All healthcare expenditures were derived using the ICES person-level costing algorithm for each cost category. 14 Total healthcare costs were analyzed according to the number of acute care activities, ambulatory care, physician services, diagnostic evaluations, and disability supports (that is, rehabilitation, long-term, continuing, and home care). Physician services and diagnostic evaluation costs were reported as combined outcomes. These costs include fees paid to physicians, labs, and nonphysician healthcare professionals, which may be based on a fee-for-service or shadow billing system. These costs also cover payments to physicians who work in emergency departments, family health organizations or networks, medical oncologists, and radiation oncologists. All costs were adjusted to 2021 Canadian Dollars (CAD) and annualized. 14
Study Analysis
Baseline sociodemographic and health status characteristics were summarized for the PA and non-PA cohorts. Mean and standard deviation (SD), or median and interquartile range (IQR), were presented for continuous variables and frequencies and percentages were presented for categorical variables.
To estimate the relative cost burden associated with patients with PA, propensity score matching was performed to account for the differences in baseline demographics and characteristics between the PA cohort, and the general as well as hospitalized cohorts in evaluating mean annual costs and healthcare resource utilization. In comparison to the general population cohort, patients with PAs were matched according to baseline characteristics with patients without PAs with at least one encounter with the healthcare system, and regression methods were used to adjust for important residual differences between the cohorts that remained after matching. After classifying the patients with and without PA, a Propensity score was calculated, including region, income quintile, community size, and comorbidities. One control was selected for each case with the following criteria: (1) hard match on age and sex and 1 month of diagnosis date and (2) propensity score within 0.2 SD of the logit of the propensity score using greedy matching algorithm. Mean and SD or median and IQR were presented for cases, controls, and the absolute difference between a case and its matched control. The balance of baseline covariates between the 2 groups was assessed using standardized differences in the matched samples, and standardized differences of less than 5% were considered acceptable. For more detailed information on the propensity score matching of the hospitalized cohort, see the Methods section in Supplemental Appendix 1.
Generalized estimating equation (GEE) regression models estimated relative rates using a negative binomial distribution with log link and unstructured correlation matrix for each time period. Pairs where either the case or control who died or date of last contact was prior to the beginning of the subsequent time period, or if the window extended past March 31, 2021, were excluded. Confidence intervals (CIs) were calculated using the empirical standard errors. A level of α < .05 was applied to indicate statistical significance.
Results
During the study period, a total of 1675 cases were identified that had been admitted with MRDx of PA. Table 1 presents baseline characteristics of the unmatched PA cohort. The mean age at diagnosis was 54.8 years (SD 15.6 years) and 51.5% of patients identified as male. In 59.7% (N = 1000) of patients with PA, a surgery was performed as confirmed by identification of a surgical claim. Forty-nine percent of patients (N = 820) received their diagnosis of PA at the time of surgery. The mean length of stay in hospital was 6.2 days (SD: 6.3 days). In 1333 patients (79.6%), surgery for the PA was performed as an elective procedure.
Baseline Characteristics of Unmatched Pituitary Adenoma Cohort.
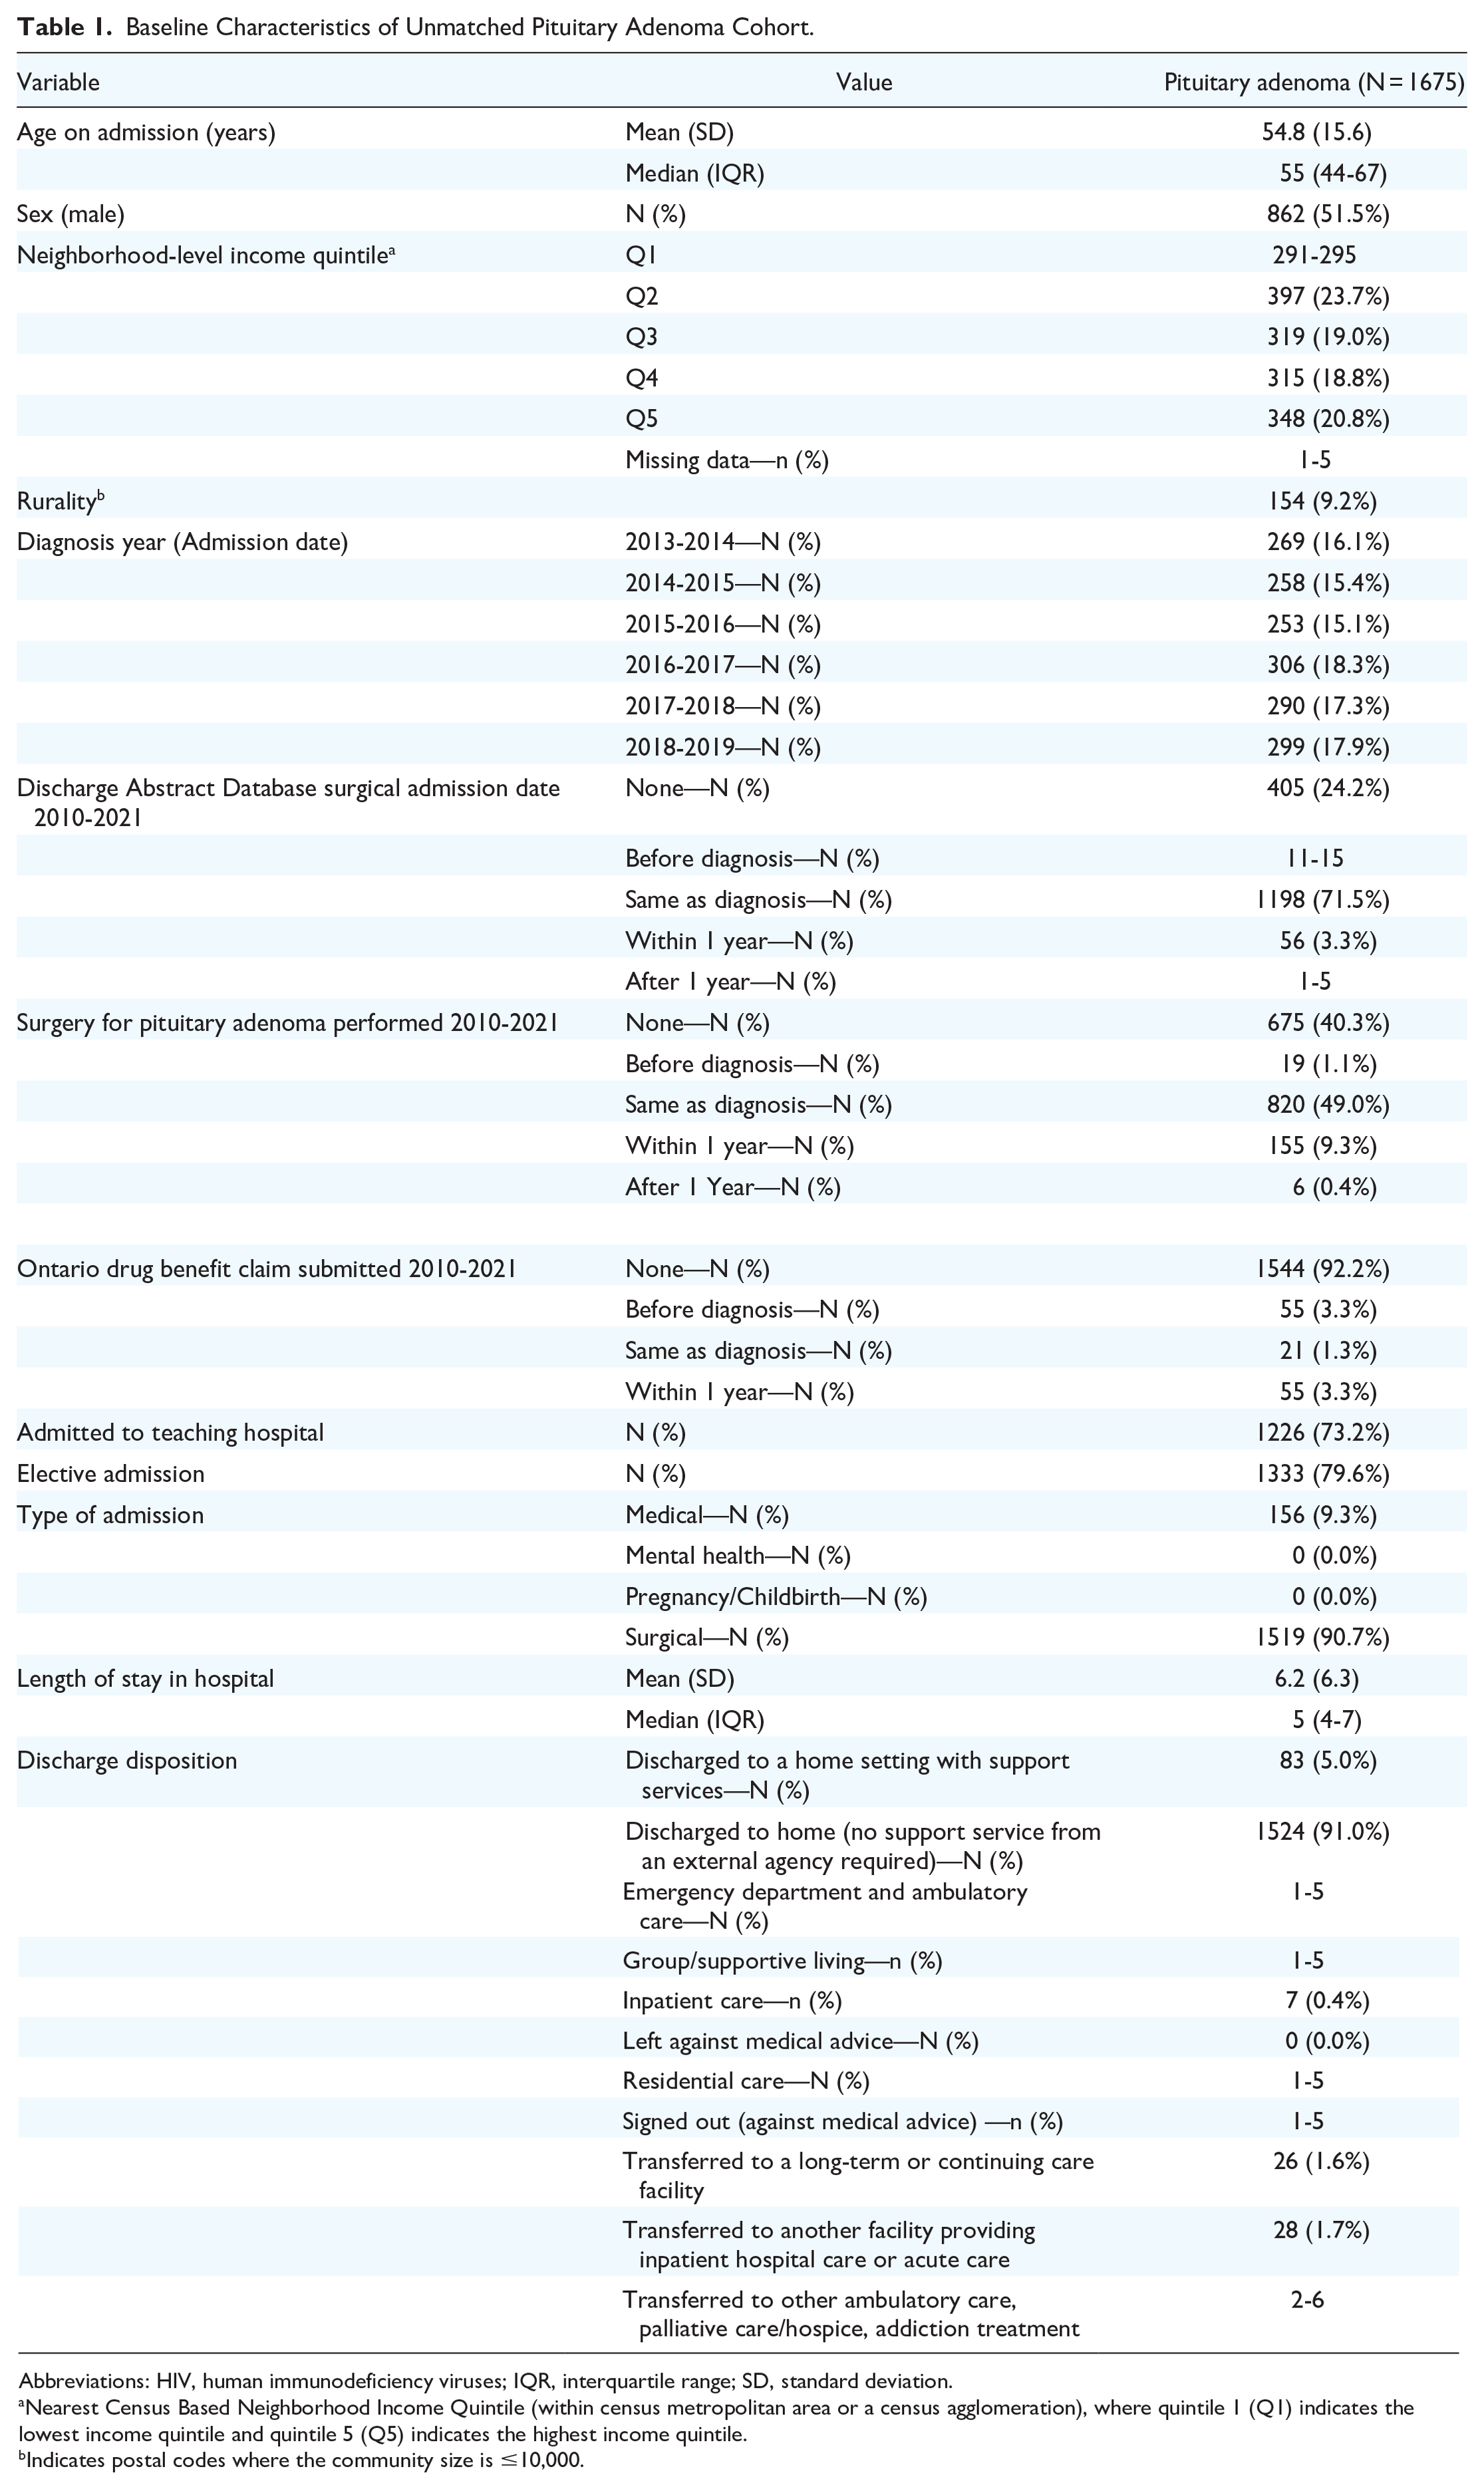
Abbreviations: HIV, human immunodeficiency viruses; IQR, interquartile range; SD, standard deviation.
Nearest Census Based Neighborhood Income Quintile (within census metropolitan area or a census agglomeration), where quintile 1 (Q1) indicates the lowest income quintile and quintile 5 (Q5) indicates the highest income quintile.
Indicates postal codes where the community size is ≤10,000.
The matching algorithm balanced age, sex, and diagnosis date between 1672 patients with PA and 1672 matched control patients from the general population cohort. The summary of baseline demographic and clinical characteristics after propensity score-matching is shown in Table 2. The mean age at diagnosis was 54.8 years (SD 15.6 years) and 51.6% of patients (N = 862) identified as male in both cohorts. The PA cohort had a higher proportion of patients that were diagnosed with CHF, COPD, and asthma (P < .05). Annualized total costs were noted to be higher in the patients with PA as compared to the general population cohort across the observed time periods (Table 3). Total annual costs were $49,992 in the PA cohort and $3949 in the general population cohort during the preadmission and admission period. Highest total costs were attributed to inpatient hospitalization costs ($24,796 vs $693), and physician services and diagnostic evaluations costs ($20,075 vs $1333), particularly due to specialist fees ($18,312 vs $740).
Summary of Baseline Patient Characteristics of the Pituitary Adenoma and General Population Cohorts After Propensity Score Matching.

Abbreviations: HIV, human immunodeficiency viruses; IQR, interquartile range; SD, standard deviation.
Nearest Census Based Neighborhood Income Quintile (within census metropolitan area or a census agglomeration) where quintile 1 (Q1) indicates the lowest income quintile and quintile 5 (Q5) indicates the highest income quintile.
2011 Census metropolitan area or a census agglomeration population.
Annualized Mean Total Cost of Care (2021 Canadian Dollars) Among Patients With Pituitary Adenomas as Compared to Their Matched Cohort in the General Population by Time Period.

Excluding physician services.
Prescription drug costs are only available for adults over age 65 year and are based on the total amount paid to the pharmacy from the Ontario Ministry of Health and Long-Term Care, including dispensing fees. 14
A negative binomial regression model was performed to establish costs in the PA cohort relative to the general population cohort across the 6 time periods (Table 4). Compared to the general population cohort, total mean annualized costs associated with patients with PA were 12.7 [95% CI (10.9, 14.8), P < .0001] times higher during the preadmission and admission period. The relative increase in total healthcare costs for patients with PA as compared to the general population cohort remained increased throughout the time periods but declined with each subsequent follow-up year. Relative increase in total costs tabulated in follow-up year 4 included the possibility of a null effect [RR 1.38, 95% CI (1.0, 1.9); P = .05]. Patients with PA were associated with a 35.8-fold increase in inpatient costs compared to the general population cohort in the preadmission and admission time period [95% CI (24.7, 51.9); P < .0001], and a 7.5-fold increase in the first follow-up year [95% CI (4.55, 12.39); P < .0001]. Physician services and diagnostic evaluation costs saw a 15.1-fold increase for patients with PA [95% CI (13.6, 16.7); P < .0001] relative to the general population cohort and remained consistently higher across all follow-up time periods (P < .0001).
Results From Negative Binomial Regression Analysis of Mean Annualized Costs for Patients With Pituitary Adenoma Versus the General Population.

Prescription drug costs are only available for adults over age 65 year and are based on the total amount paid to the pharmacy from the Ministry of Health and Long-Term Care, including dispensing fees. 14
The matching algorithm balanced age, sex, and diagnosis date between 1614 patients with PA and 1614 matched hospital control patients. The summary of baseline demographic and clinical characteristics after propensity score matching is shown in Supplemental eTable 2. The mean age at diagnosis was 55.1 years (SD 15.4 years) among patients with PA and 55.3 years (SD 15.4 years) among the hospitalized cohort. A total of 52.2% of patients (N = 843) identified as male in both cohorts. The PA cohort had a higher proportion of patients that were discharged home with no support services [1473 (91.3%) vs 1156 (71.6%); P < .0001]. The PA population had a higher percentage of patients that were diagnosed with diabetes mellitus [371 (23.0%) vs 315 (19.5%); P = .016]. However, fewer patients died within 1 year among patients with PAs as compared to the hospitalized population [22 (1.4%) vs 83 (5.1%); P < .0001]. Annualized total costs were observed to be lower in the patients with PA as compared to the hospitalized cohort across the observed time periods. Patients with PA accrued higher annualized costs from outpatient care and laboratory investigations compared to the hospitalized cohort across all time periods (Supplemental eTable 3). Total physician services and diagnostic evaluation costs ($20,019 vs $11,960), particularly specialist fees ($18,272 vs $10,556), demonstrated higher annualized costs for the PA population as compared to the hospitalized cohort in the perioperative assessment and surgical period.
Results from the GEE models that compared costs of patients with PA (N = 1614) relative to the hospitalized cohort (N = 1614) across time periods are presented in Supplemental eTable 4. Total costs of care were not found to differ for patients with PA relative to the hospitalized cohort [RR 0.97, 95% CI (0.92, 1.03); P = .3271] in the preadmission and admission period. The total cost of care for follow-up of patients with PA was 37% lower for patients with PA as compared to the hospitalized cohort in the first year of follow-up [RR 0.63, 95% CI (0.51, 0.77); P < .0001], and 50% lower in the 5th year RR 0.50, 95% CI (0.36, 0.68); P < .0001]. Similarly, the cost of inpatient care for follow-up of patients with PA was 18% lower for patients with PA as compared to the hospitalized cohort in the preadmission and admission period [RR 0.82, 95% CI (0.76, 0.88); P < .0001], and 78% lower by the 5th follow-up year [RR 0.22, 95% CI (0.11, 0.43); P < .0001]. Total cost of physician services and diagnostic evaluations was 1.67 times higher [95% CI (1.61, 1.74); P < .0001] for patients with PA compared to the hospitalized cohort in the preadmission and admission period, but the economic burden of care decreased in subsequent follow-up years such that cost of care was 37% lower for patients with PA by follow-up year 5 [RR 0.63, 95% CI (0.49, 0.81); P = .0002].
Discussion
This population-based analysis was the first to evaluate the total and incremental healthcare costs of the management of PAs over 6 perioperative and follow-up time periods.
Compared to the general population cohort, patients with PAs had higher annualized total costs across all observed time periods. The negative binomial regression model revealed that total annualized costs for patients with a PA were substantially higher than the general population in the preadmission and admission period. Our analysis identified several key drivers of costs in the management of PAs. In keeping with previously published literature, the primary contributor to overall costs was attributed to inpatient hospitalization, which include cost of care provided in the critical care department, ward, and operating room.15-18 In our analysis, costs in this domain were highest in the preadmission and admission period, accounting for $24,796, or 49.5% of total costs. Although the largest contributor to expenses, the total economic burden of PAs in Ontario is lower than costs observed in previous analyses, which have attributed upwards of 60% of total costs to inpatient hospitalizations.18,19 Physician services and diagnostic evaluations costs, particularly specialist fees, were the second greatest driver of total costs in our analysis. Transsphenoidal surgery is most commonly performed by 2 specialist surgeons. 20 In the perioperative period, patients will furthermore require the supportive management of endocrinologists, neuro-ophthalmologists, neuroradiologists, and postoperative monitoring in an intensive care setting. As several specialists are involved in PA management in the perioperative period, it explains the dramatic cost drop off as these patients leave the perioperative period. While pharmacy fees can account for greater than 10% of overall costs in the reported literature,18,19 our analysis found that pharmacy fees accounted for only 4% of costs. This is most likely due to the fact that our reported pharmacy costs are only representative of adults over the age of 65 and are based on the total amount paid to the pharmacy from the MOHLTC, including dispensing fees. 14 In alignment with the previous studies, laboratory studies and imaging were small contributors to overall costs.
The cost of care for the pituitary cohort in the preadmission and admission period fell within the range of reported costs in the literature to further validate our findings. For example, in a study analyzing American data from 2015 to 2017, the average in-hospital cost, excluding surgical cost, for patients following endoscopic transsphenoidal surgeries was $28,624 USD ($38,899 CAD). 21 By comparison, a study analyzing costs of pituitary surgeries between 2015 and 2018 in a Dutch tertiary center reported €8979 ($14,955 CAD) for surgical costs and €4568 ($7608 CAD) for hospitalization costs, with a total of €16,339 ($27,214 CAD) for surgery and the first year of postoperative care. 20 Although these costs are not all directly comparable due to differences in included costs and treated conditions, the wide discrepancies highlight the cost variations for surgery and inpatient hospitalization between healthcare systems.
This study is the first to analyze the long-term costs of the surgical management of PAs and compare these costs to another surgical cohort. With the exception of the preadmission and admission period, patients with PA had lower annualized total costs across the observed time periods compared to the hospitalized cohort. Despite the relative complexity and subspecialty resources involved in the preadmission and perioperative management of PAs—such as frequent laboratory investigations, imaging, and consultations—compared to other surgical populations, our model found no differences in overall costs of care during this period. The lower PA follow-up costs could be attributed to the reduced long-term morbidity and thus decreased rehabilitation costs associated with management of PAs. We postulate that patients with PA are generally healthier than the average surgical patient and logically utilize fewer resources in the perioperative period.
Length of stay is an established driver of inpatient hospitalization costs.16,20,22,23 However, discharge policies following transsphenoidal surgery can be highly variable. Although the mean postoperative length of stay in Ontario hospitals was 6.2 days, significantly shorter stays of 2.7 to 9.04 days have been reported in the literature.17,21,23-25 Previous studies have shown that an accelerated postoperative discharge with enhanced postoperative surveillance may be cost-effective; that is, a fast-track discharge of 1 to 3 days in selected patients showed that reducing length of stay was feasible, safe, and cost-effective compared to those in a non-fast-track group.26,27 While an early discharge—as early as the first postoperative day—has been shown to be safe and inexpensive for other brain tumor surgeries, more data are needed to inform the safety behind this cost-saving practice in patients with PA. 28
Strengths and Limitations
This population-based study is strengthened as the first North American study providing a comprehensive overview of the cost of perioperative and follow-up healthcare of PAs in comparison to both a general population and a surgical population. Our analysis includes costs at all care levels and is not limited to a single center, enhancing the generalizability of our findings. Furthermore, our study offers a long follow-up period to illuminate cost differences.
However, there are limitations in this study, including those that are innate to retrospective analyses. In this study, ICD codes specific to PAs were used to identify cases. To ensure a comprehensive selection, we cross-referenced these ICD-10 codes with relevant procedure and billing codes, aiming to capture all pituitary adenoma cases, including combined cases. However, we recognize that there may be variations in coding practices across institutions. Future studies should consider additional methods to further improve data accuracy and case identification.
Although we included multicenter data, our patient population was limited to one province in Canada. In the province of Ontario, prescription drug costs are only available for adults over the age of 65 year and based on the total amount paid to the pharmacy from the MOHLTC, including dispensing fees. Given that the majority of our population was under the age of 65, medication costs captured through our registry were not an accurate representation of actual medication costs in our target population. A further limitation of our study was our inability to differentiate functioning versus nonfunctioning adenomas among the identified patients with PA. Some of the former patients, including those with Cushing’s disease, would likely have higher healthcare costs than those with nonfunctioning adenomas.
This analysis evaluated patients treated between March 2013 and 2019, with a 2-year follow-up period. As the data are more than 3 years old, their relevance may be affected by recent changes in healthcare costs and practices. Notably, while surgical fees have remained relatively stable, inflation has impacted other aspects of healthcare expenses. Furthermore, the implementation of Enhanced Recovery After Surgery protocols, which were not fully adopted during the study period, has led to earlier patient discharge and reduced length of stay in many centers. These evolving practices may influence current cost structures and patient outcomes. Future studies that incorporate updated data could enhance the relevance and applicability of the findings in the context of current healthcare trends.
Finally, our registry captured the diagnosis date as the earliest of DAD admission date between April 2013 and March 2019, and this was done because it was not possible to have the actual date of diagnosis. In practice, most patients going in for surgery already have a PA diagnosis. Prior 6 months and index admission were included as part of the economic evaluation to account for earlier diagnostic costs.
Conclusion
In our multi-institutional analysis, patients with PA were found to have higher annualized total costs across all observed time periods compared to the general population. We observed that patients with PA had lower annualized total costs across the observed time periods compared to a hospitalized patient cohort. The results of this study will inform policymaking through the identification of the total and incremental costs, and drivers of cost, including the economic impact of surgical populations by resource utilization. Future studies could examine the cost and utilization patterns of PA management by treatment approach and pituitary subtype.
Supplemental Material
sj-docx-1-ohn-10.1177_19160216251314793 – Supplemental material for The Economic Burden of Management of Pituitary Adenomas: A Propensity-Score-Matched Cost Analysis
Supplemental material, sj-docx-1-ohn-10.1177_19160216251314793 for The Economic Burden of Management of Pituitary Adenomas: A Propensity-Score-Matched Cost Analysis by Lisa Caulley, Andrea Lasso, Brandon Zagorski, Andrew S. Wilton, Refik Saskin, Nick Sahlollbey, Jeanne M. Séguin, Kednapa Thavorn, Mary-Anne Doyle, Janine Malcolm, Fahad Alkherayf, Stephanie Johnson-Obaseki, David Schramm and Shaun Kilty in Journal of Otolaryngology - Head & Neck Surgery
Footnotes
Acknowledgements
None.
Authors’ Contributions
All authors contributed to study conception and design. Material preparation and data collection were performed by Lisa Caulley, Shaun Kilty, Andrea Lasso, Brandon Zagorski, Andrew S. Wilton, Refik Saskin, Nick Sahlollbey, Jeanne M. Séguin, Mary-Anne Doyle, and Kednapa Thavorn. All authors contributed to data analysis and interpretation. The first draft of the manuscript was written by Lisa Caulley, Shaun Kilty, Andrea Lasso, Brandon Zagorski, Andrew S. Wilton, Refik Saskin, Nick Sahlollbey, and Jeanne Séguin. All authors commented on previous versions of the manuscript. All authors read and approved the final manuscript
Declaration of Conflicting Interests
The author(s) declared no potential conflicts of interest with respect to the research, authorship, and/or publication of this article.
Funding
The author(s) disclosed receipt of the following financial support for the research, authorship, and/or publication of this article: Lisa Caulley was supported by a Canadian Institutes of Health Research Frederick Banting and Charles Best Canada Graduate Scholarship Doctoral Awards (CGS-D) and a PSI Foundation Research Trainee Award (RT5-2020). The Funders/Sponsors were not involved in the design and conduct of the study; collection, management, analysis, and interpretation of the data; preparation, review, or approval of the manuscript; and decision to submit the manuscript for publication.
Ethics Approval
This study was approved by the Ottawa Health Sciences Network Research Ethics Board (Protocol Number 20170946-01H).
Supplemental Material
Additional supporting information is available in the online version of the article.
References
Supplementary Material
Please find the following supplemental material available below.
For Open Access articles published under a Creative Commons License, all supplemental material carries the same license as the article it is associated with.
For non-Open Access articles published, all supplemental material carries a non-exclusive license, and permission requests for re-use of supplemental material or any part of supplemental material shall be sent directly to the copyright owner as specified in the copyright notice associated with the article.