
Abstract
Multiple system atrophy (MSA) is a rapidly progressive neurodegenerative disorder with different metabolic patterns in parkinsonian (MSA-P) and cerebellar (MSA-C) subtypes, but their longitudinal changes are not well understood. To characterize longitudinal changes of glucose metabolism and network connectivity in MSA using 18F-FDG-PET for early diagnosis and disease progression tracking, we retrospectively analyzed 29 MSA patients (17 MSA-P, 12 MSA-C) and 28 healthy controls. Regional glucose uptake was assessed as standardized uptake value ratios (SUVR). We examined inter-regional connectivity via correlation analysis and modeled metabolic decline using nonlinear mixed-effects models. Clinical progression was measured using the Unified Multiple System Atrophy Rating Scale (UMSARS). MSA-P displayed progressive hypometabolism in the putamen, cerebellum, and frontal cortex, while MSA-C showed declines primarily in the cerebellum and frontal regions. Longitudinal modeling indicated a faster putaminal decline in MSA-P (β = −0.015 ± 0.006) than in MSA-C (β = 0 ± 0.011), whereas cerebellar metabolism declined over time in both groups with overlapping slopes in MSA-P (β = −0.022 ± 0.006) and MSA-C (β = −0.022 ± 0.011). Regional metabolic reductions correlated with UMSARS progression (putamen in MSA-P: r = −0.59, p < 0.001; cerebellum in MSA-C: r = −0.62, p < 0.001). Significant connectivity disruptions were noted in frontal, basal ganglia, and cerebellar-parietal circuits. Longitudinal FDG-PET reveals distinct metabolic decline patterns in MSA subtypes—putamen in MSA-P and cerebellum in MSA-C—linked to clinical severity. These findings may inform clinical practice and trial design, supporting the use of FDG-PET for biological staging, monitoring disease progression, and potentially evaluating treatment responses.
Plain language summary
Background Multiple System Atrophy (MSA) is a progressive brain disease that primarily presents with either predominant Parkinson's-like symptoms (MSA-P) or coordination problems (MSA-C). We used a special brain scan (FDG-PET) that measures brain cell activity by tracking their sugar (glucose) usage. We aimed to see how brain activity changes over time in people with MSA to better understand and track the disease. Methods We studied 29 MSA patients (17 MSA-P, 12 MSA-C) and 28 healthy individuals for comparison. All participants underwent FDG-PET brain scans. We analyzed the scans to measure energy use in different brain regions and to see how these regions communicate with each other. We also tracked clinical symptom progression using a standard rating scale (UMSARS). Results We found that brain areas use less energy (become less active) as MSA progresses, and the pattern depends on the subtype. MSA-P patients showed a rapid decline in activity in brain regions controlling movement (putamen and cerebellum), and planning (frontal cortex). MSA-C patients showed decline mainly in the cerebellum (for coordination) and frontal cortex. The rate of decline differed between subtypes: the putamen worsened faster in MSA-P, whereas the cerebellar hemisphere declined more in MSA-C. Critically, lower activity in these key areas was directly linked to worse clinical symptoms. We also found that the normal communication networks between different brain regions were disrupted. Conclusion This study shows that FDG-PET brain scans can reveal distinct patterns of how brain activity declines over time in the two MSA subtypes. These patterns are closely linked to the worsening of patients' symptoms. Measuring this brain energy loss provides a valuable tool for monitoring disease progression in future clinical trials, potentially helping to evaluate new treatments faster
Introduction
Multiple system atrophy (MSA) is a rapidly progressive neurodegenerative disorder with a poor prognosis, characterized by a median survival of 6–10 years.1–3 It is classified into two subtypes: MSA with predominant parkinsonism (MSA-P) and MSA with predominant cerebellar ataxia (MSA-C). 4 Pathologically, MSA is defined by widespread neuronal loss and gliosis, with the accumulation of fibrillar α-synuclein in oligodendrocytes, and evidence suggests that misfolded α-synuclein may spread through the brain via mechanisms resembling prion-like propagation, although this remains a hypothesis under investigation. 5 However, the clinical overlap with early stages of other α-synucleinopathies, such as Parkinson's disease (PD) and dementia with Lewy bodies (DLB), complicates early diagnosis. 6
The rapid disease progression and absence of effective treatments underscore the need for reliable biomarkers to monitor progression and inform clinical decision-making.
Recently, 18F-fluorodeoxyglucose positron emission tomography (FDG-PET) has emerged as a powerful tool for providing critical insights into the metabolic dysfunction underlying MSA, linking regional metabolic changes to clinical symptomatology. Previous studies, including our own, have demonstrated that MSA-P is associated with hypometabolism in the inferior frontal cortex, striatum, and cerebellum, 7 whereas MSA-C is marked by early and prominent cerebellar hypometabolism. 8 These findings suggest that distinct metabolic changes may show potential reflect the progression of clinical symptoms in MSA and highlight the potential of FDG-PET in differentiating MSA subtypes.
Longitudinal studies highlight the rapid clinical progression of MSA. Longitudinal analysis of 97 early-stage MSA patients over two years showed significant progression in both motor and non-motor symptoms, respectively. 9 FDG-PET analysis of 85 MSA patients (median survival: 8 years, CI: 6.64–9.36) further suggested that reduced glucose metabolism in the left insula at baseline indicated the shorter survival. 10 These findings further underscore the utility of FDG-PET for monitoring disease progression and predicting prognosis. Additionally, besides conventional regional analyses, metabolic network connectivity, reflecting inter-regional correlations in resting-state glucose metabolism assessed via FDG-PET, offers further insights into the pathophysiology of PD and atypical parkinsonian syndromes, including DLB, highlighting the broader applicability of FDG-PET in understanding neurodegenerative diseases. 11
However, longitudinal studies on regional glucose metabolism and metabolic network alterations in MSA remain limited, with most research to date being cross-sectional and lacking systematic assessments of long-term metabolic changes across MSA subtypes. To address this gap, we aimed to assess changes in relative glucose metabolism and metabolic network connectivity across MSA subtypes using longitudinal FDG-PET, focusing on the temporal progression of these alterations. FDG-PET may serve as a valuable tool for capturing disease-related metabolic changes over time, with potential utility as a dynamic biomarker for monitoring MSA progression and informing therapeutic development.
Methods
Study design and population
Patients clinically diagnosed with MSA between January 2014 and June 2024 at the Department of Neurology, Huashan Hospital, Fudan University (Shanghai, China), were retrospectively recruited. These patients were drawn from the prospectively established Parkinson's Disease and High-Risk Population Clinical Information and Biobank, which provides systematically collected motor and non-motor assessments. For this study, we retrospectively identified biobank-registered MSA cases who had undergone FDG-PET imaging and included those with at least two FDG-PET scans accompanied by clinical evaluations within one month of each scan. Diagnoses were confirmed by two experienced neurologists (F.T.L., and J.W.) according to the 2008 s consensus criteria for MSA 12 for patients enrolled before 2022, and the 2022 Movement Disorder Society (MDS) criteria 4 for those enrolled from 2022 onwards, with patients classified into MSA-P and MSA-C subgroups. A total of 29 MSA patients met the inclusion criteria and completed longitudinal follow-up over a mean duration of 1.9 ± 0.6 years. For comparison, 28 age- and sex-matched healthy individuals with no history of neurological or psychiatric disorders, who were also registered in the biobank and underwent a single FDG-PET scan, were retrospectively selected. The study was approved by the Ethics Committee of Huashan Hospital (KY2011-213) and conducted under its supervision. Written informed consent was obtained from all participants before study enrollment.
Clinical assessments
Demographic information of the patients, including age (years), sex, disease duration (months), education (years), and levodopa equivalent daily dose (LEDD, mg), were systemically collected. Medical history was reviewed to document the presence or absence of orthostatic hypotension, urinary incontinence, REM sleep behavior disorder (RBD), and depression. Motor impairment was evaluated in the medication-off state using the Unified Multiple System Atrophy Rating Scale (UMSARS). 13
Assessment of cerebral glucose metabolism via FDG-PET/CT
FDG-PET images were obtained on a Siemens Biograph 64 PET/CT scanner (Siemens Healthineers, Munich, Germany) to quantify cerebral glucose metabolism across MSA subtypes. Initial image preprocessing and statistical mapping were performed using SPM, as described in Supplement Materials (Methods), to visualize group-level metabolic patterns. For subsequent analyses, we calculated standardized uptake value ratio (SUVR) by normalizing regional tracer uptake to the whole-brain mean, using brain regions defined by the AAL3 atlas. 14 Anatomically relevant regions of interest (ROIs) were selected based on AAL3 subdivisions; detailed anatomical labels for these regions are provided in Supplementary Table 1.
Metabolic connectivity analysis
We assessed metabolic connectivity from inter-regional coefficients of FDG-PET SUVR for MSA patients of different subgroup and for the HC group. 15 The 134 brain regions defined in the AAL3 atlas were consolidated into 70 bilateral regions of interest (ROIs) by merging homologous regions across hemispheres. Following global mean normalization, a 70 × 70 inter-regional correlation matrix was generated for each group. To identify disease-related alterations in metabolic connectivity, inter-regional correlation coefficients were compared across the three groups using one-way ANOVA. Multiple comparisons were corrected using Bonferroni adjustment for the number of ROIs and group contrasts. All correlation values were transformed using Fisher's r-to-z transformation to approximate normality. A corrected two-sided P-value <0.05 was considered statistically significant.
Statistical analysis
To compare the baseline demographic profiles and clinical characteristics between the two groups, Chi-squared test was used for categorical variables and student t test and Mann-Whitney U test were used for continuous variables (including SUVR), based on the normality of the data. To compare the longitudinal SUVR changes of FDG-PET in clinical characteristics between the two groups, a non-linear mixed-effect model was applied, using disease duration as the time scale and adjusting for age and sex. Given the repeated measurements within the same participants, repeated measures correlation (rmcorr) 16 was employed to analyze the associations between normalized SUVR and UMSARS total scores. Two-tailed p values are presented, and differences were considered statistically significant at p < 0.05.
Results
Demographic information and clinical characteristics
A total of 29 patients with MSA were included in this study, including 17 patients with the parkinsonian type (MSA-P, 58.6%) and 12 patients with the cerebellar type (MSA-C, 41.4%). The healthy controls (HCs) group consisted of 28 individuals, including 16 males (57.1%), with a mean age of 59.3 ± 7.2 years. Baseline demographic and clinical characteristics, as well as within-group longitudinal changes, are summarized in Table 1. At baseline, the patients were 58.4 ± 7.5 years old, with the mean age at onset of 56.5 ± 7.6 years. MSA-P and MSA-C groups differed significantly in gender distribution (MSA-P: 7 male [41.2%]; MSA-C: 10 male [83.3%]; p = 0.03). The mean interval between the two FDG-PET assessments was 1.9 ± 0.6 years, with comparable durations in the MSA-P (1.9 ± 0.6 years) and MSA-C (2.0 ± 0.5 years) subgroups. At follow-up, both subtypes exhibited marked motor progression in the medication-off state, with UMSARS total scores rising from 31.2 ± 13.9 to 52.6 ± 12.4 in MSA-P and from 32.1 ± 5.7 to 48.6 ± 11.4 in MSA-C (both p < 0.001).
Demographic, clinical, and behavioral variables.
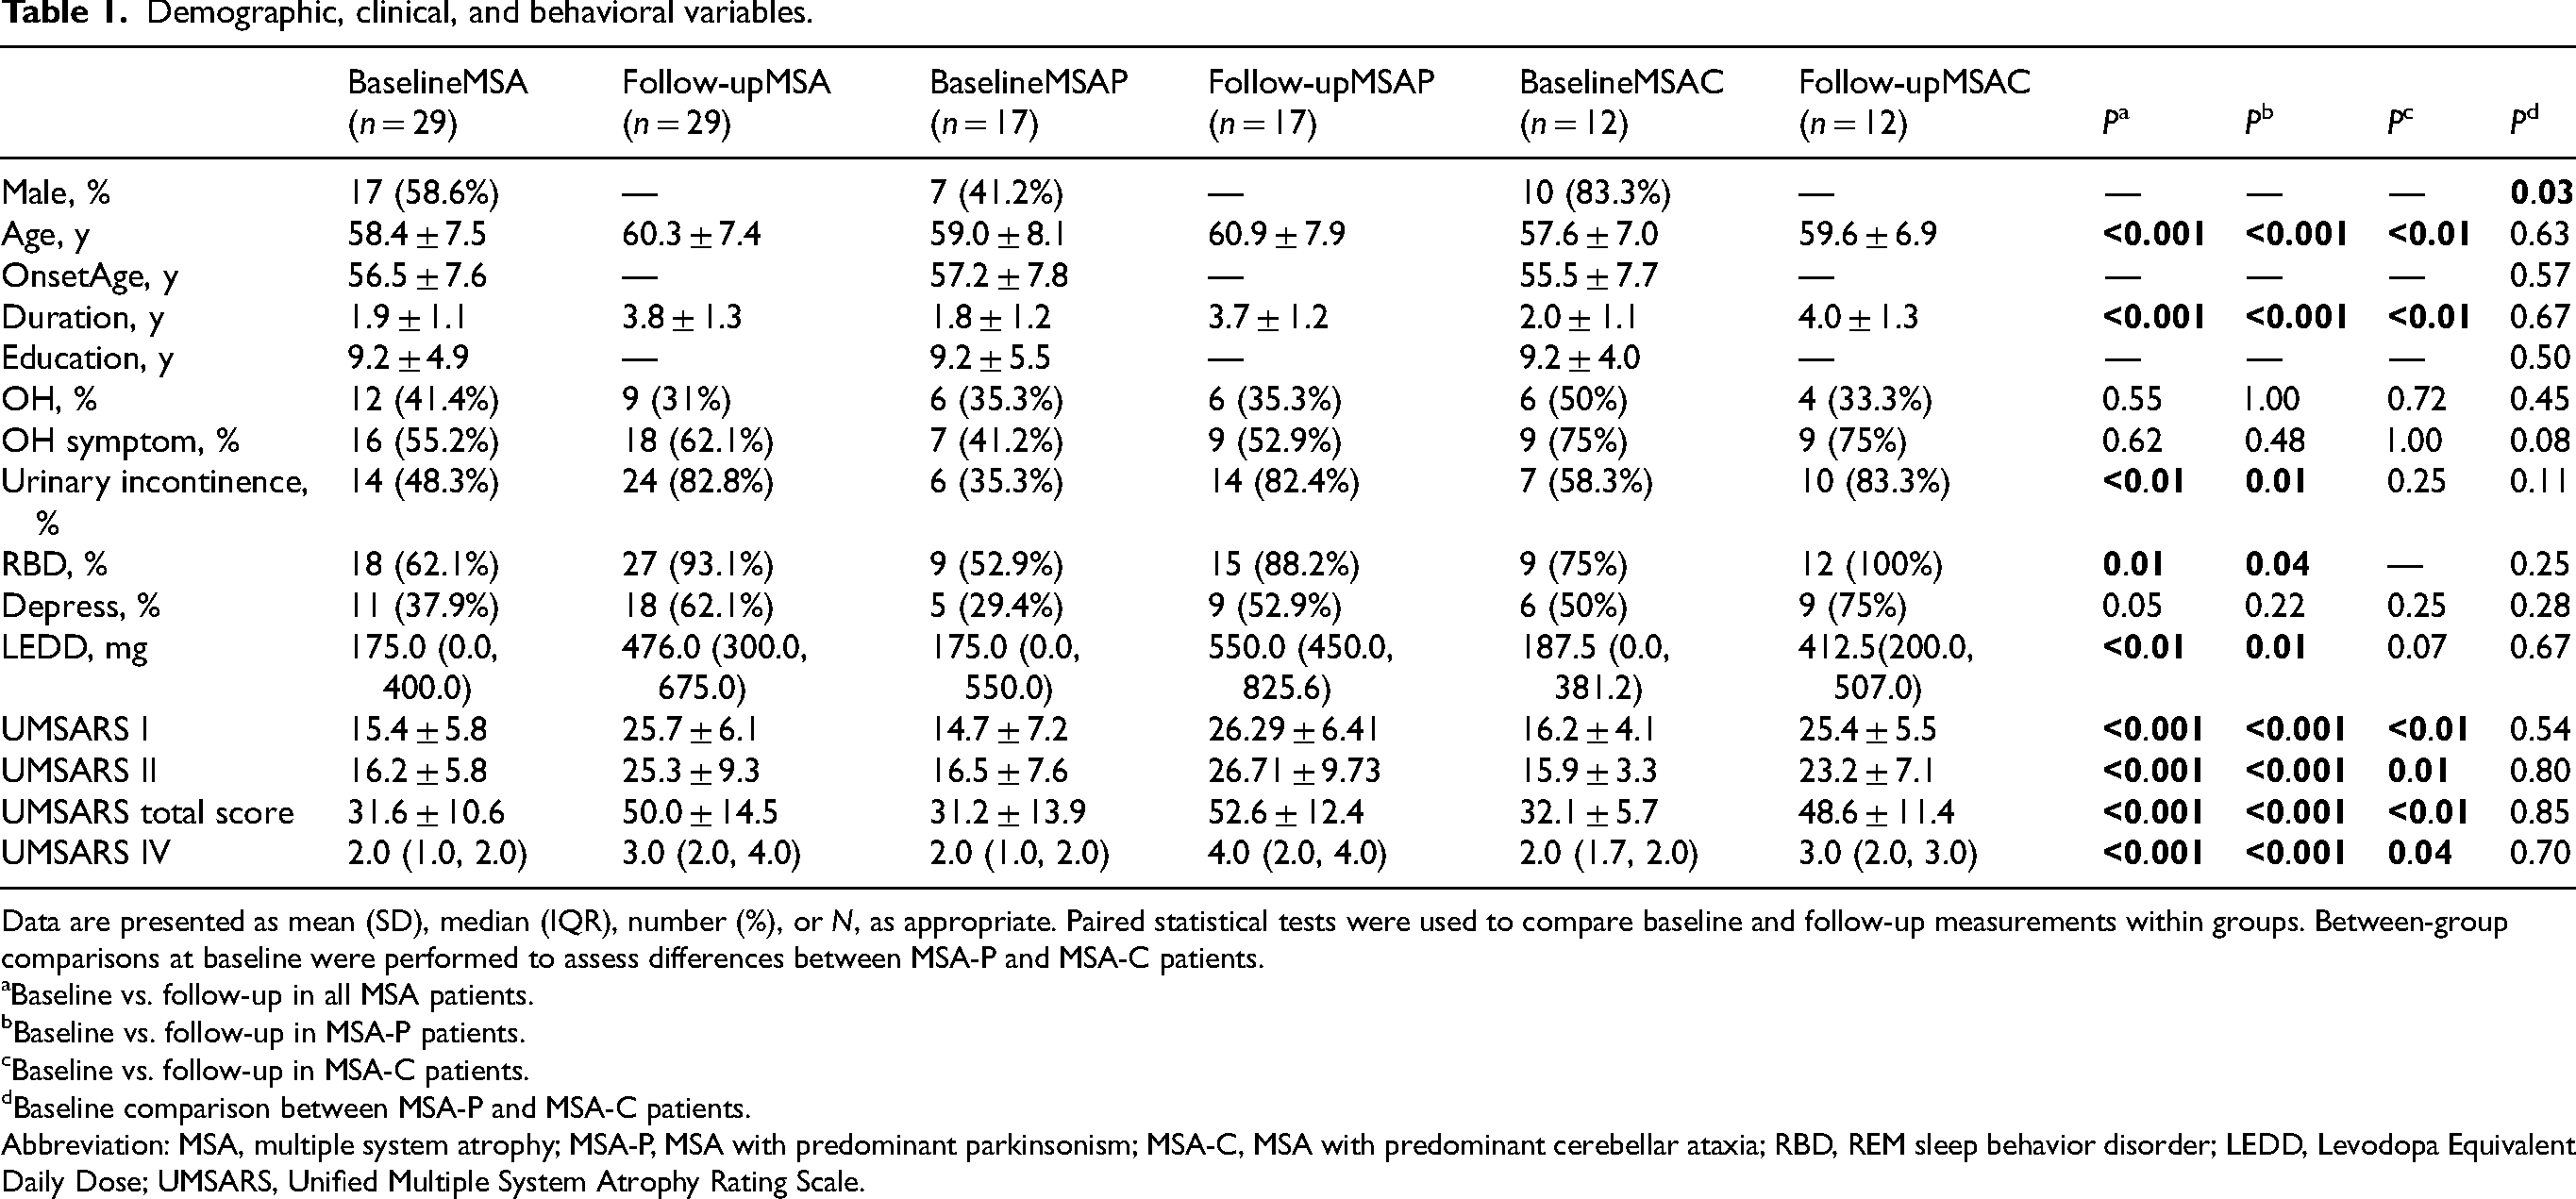
Data are presented as mean (SD), median (IQR), number (%), or N, as appropriate. Paired statistical tests were used to compare baseline and follow-up measurements within groups. Between-group comparisons at baseline were performed to assess differences between MSA-P and MSA-C patients.
Baseline vs. follow-up in all MSA patients.
Baseline vs. follow-up in MSA-P patients.
Baseline vs. follow-up in MSA-C patients.
Baseline comparison between MSA-P and MSA-C patients.
Abbreviation: MSA, multiple system atrophy; MSA-P, MSA with predominant parkinsonism; MSA-C, MSA with predominant cerebellar ataxia; RBD, REM sleep behavior disorder; LEDD, Levodopa Equivalent Daily Dose; UMSARS, Unified Multiple System Atrophy Rating Scale.
Distinct and progressive glucose hypometabolism in MSA subtypes
At baseline, voxel-wise comparisons with HCs showed subtype-specific patterns of glucose hypometabolism (Figure 1, A1-6). The MSA-P subgroup exhibited significant reductions in FDG uptake in the putamen and cerebellum, whereas the MSA-C subgroup demonstrated predominant hypometabolism in the cerebellum, fusiform gyrus, and middle occipital gyrus. These cross-sectional patterns were consistent at both baseline and follow-up. Longitudinal within-group analyses revealed progressive metabolic decline from baseline to follow-up in both subtypes (Figure 1, B1-3). Baseline-to-follow-up comparisons within each subtype revealed distinct patterns: MSA-P patients exhibited significant reductions in metabolism within the cerebellum, putamen, and inferior frontal gyrus, whereas MSA-C patients showed predominant hypometabolism in the cerebellum, frontal cortex (including inferior, superior, and medial regions), fusiform gyrus, thalamus, and caudate nucleus. The statistical results supporting the Figure 1 of regional metabolic decreases are detailed in Supplementary Tables 2–10, and the full voxel-wise findings, including both metabolic decreases and increases, are presented in Supplementary Figure 1.
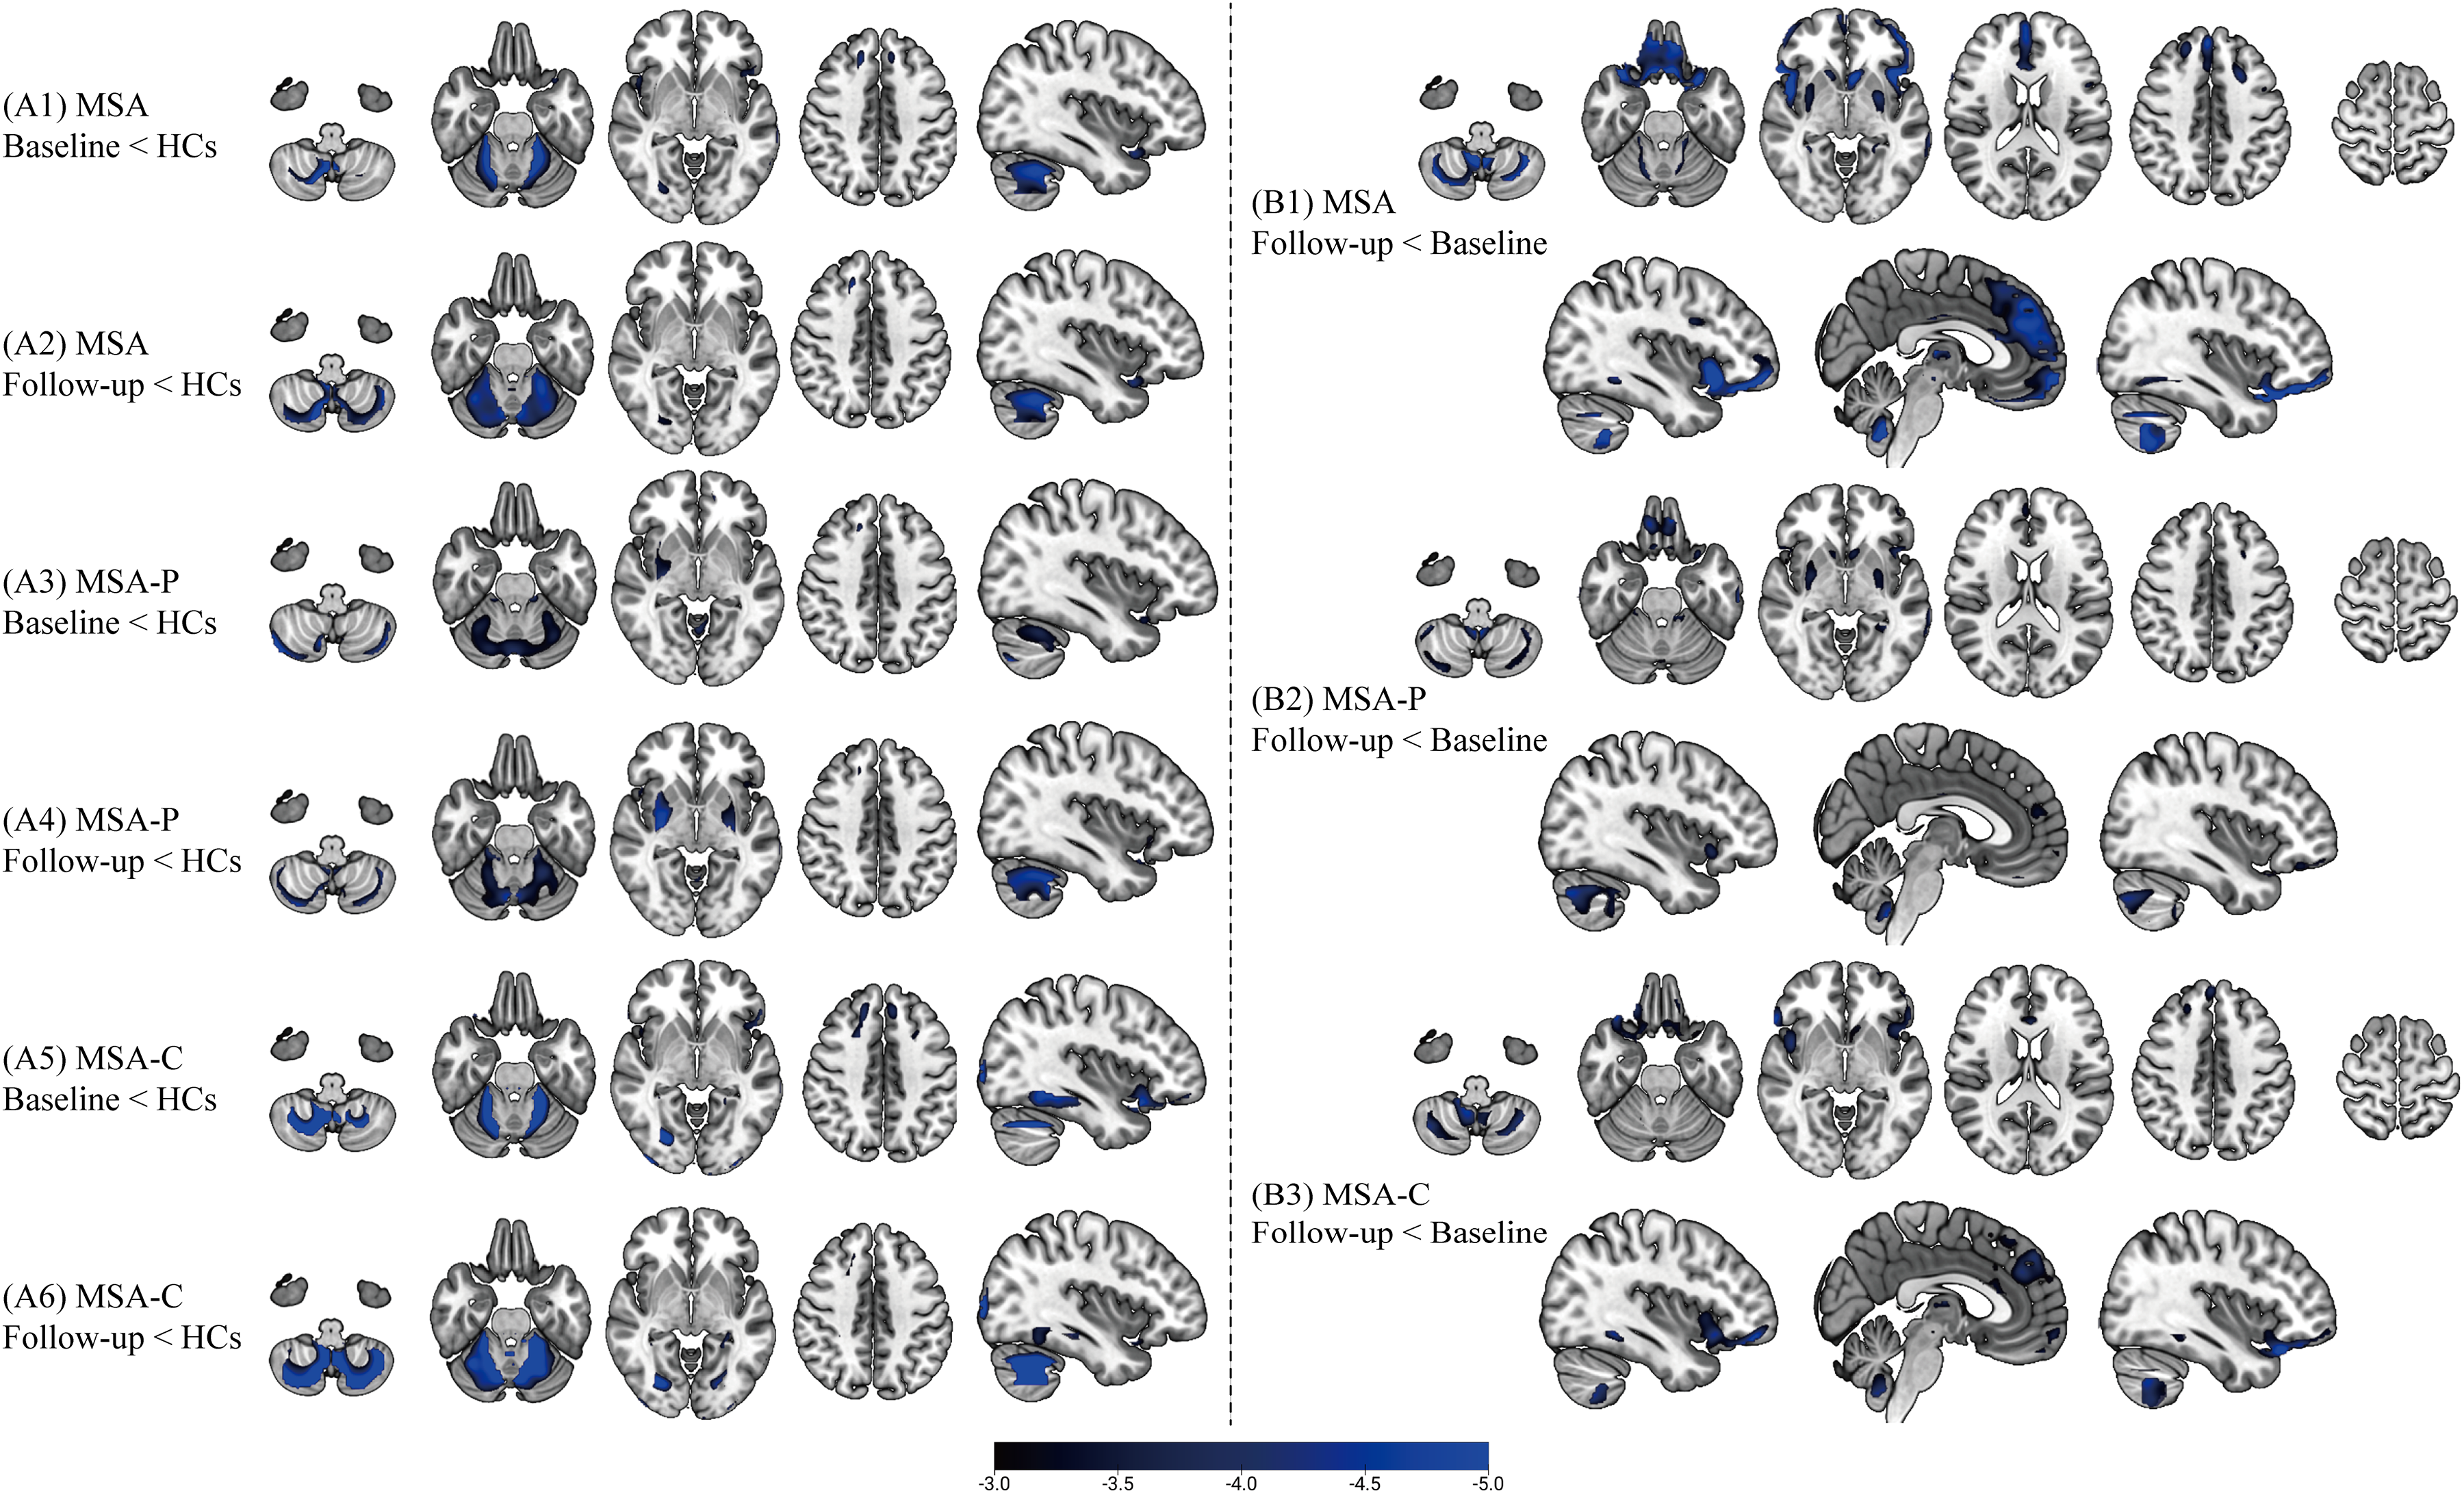
Regional hypometabolism in MSA subtypes versus healthy controls and longitudinal metabolic decline. (A) Cross-sectional comparisons of FDG uptake between MSA patients and HCs: A1, entire MSA cohort at baseline versus HCs; A2, entire MSA cohort at follow-up versus HCs; A3, MSA-P subtype at baseline versus HCs; A4, MSA-P subtype at follow-up versus HCs; A5, MSA-C subtype at baseline versus HCs; A6, MSA-C subtype at follow-up versus HCs. (B) Longitudinal within-group comparisons of metabolic decline: B1, entire MSA cohort (follow-up < baseline); B2, MSA-P subtype; B3, MSA-C subtype. T-maps were generated in SPM12 using voxel-wise t-tests with the specified contrasts. Results are thresholded at pFWE < 0.05 (cluster-level). T-values are indicated by the color bar. Baseline: FDG-PET scans at initial visit; Follow-up: Scans at subsequent visit to assess metabolic progression. HC, healthy control; MSA, multiple system atrophy; MSA-P, parkinsonian subtype; MSA-C, cerebellar subtype.
Longitudinal trajectories of FDG-PET metabolism in MSA
During longitudinal follow-up, cerebral glucose metabolism in the key regions including the cerebellum and the putamen declined in both MSA-P and MSA-C as disease progressed. Table 2 summarizes the results of linear mixed-effects models assessing regional FDG-PET changes. This finding was supported by log-transformed model predictions (Figure 2A), showing a steeper slope in MSA-P (β = −0.015 ± 0.006) compared to MSA-C (β = 0 ± 0.011) in the putamen. Conversely, the frontal cortex, specifically medial orbitofrontal and lateral frontal regions, exhibited a faster FDG-PET metabolic decline in MSA-C compared with MSA-P, with FDR-adjusted p values of 0.02 for both, respectively, suggesting a subtype-specific vulnerability in frontal lobe metabolism. Although cerebellar metabolism also declined over time in both groups, the interaction with disease duration was not statistically significant, indicating similar rates of decline. This was further illustrated by model-based prediction curves (Figure 2B), with overlapping slopes in MSA-P (β = −0.022 ± 0.006) and MSA-C (β = −0.022 ± 0.011). Supplementary Table 11 reports age- and gender-adjusted mixed-effects model estimates for all 70 ROIs.
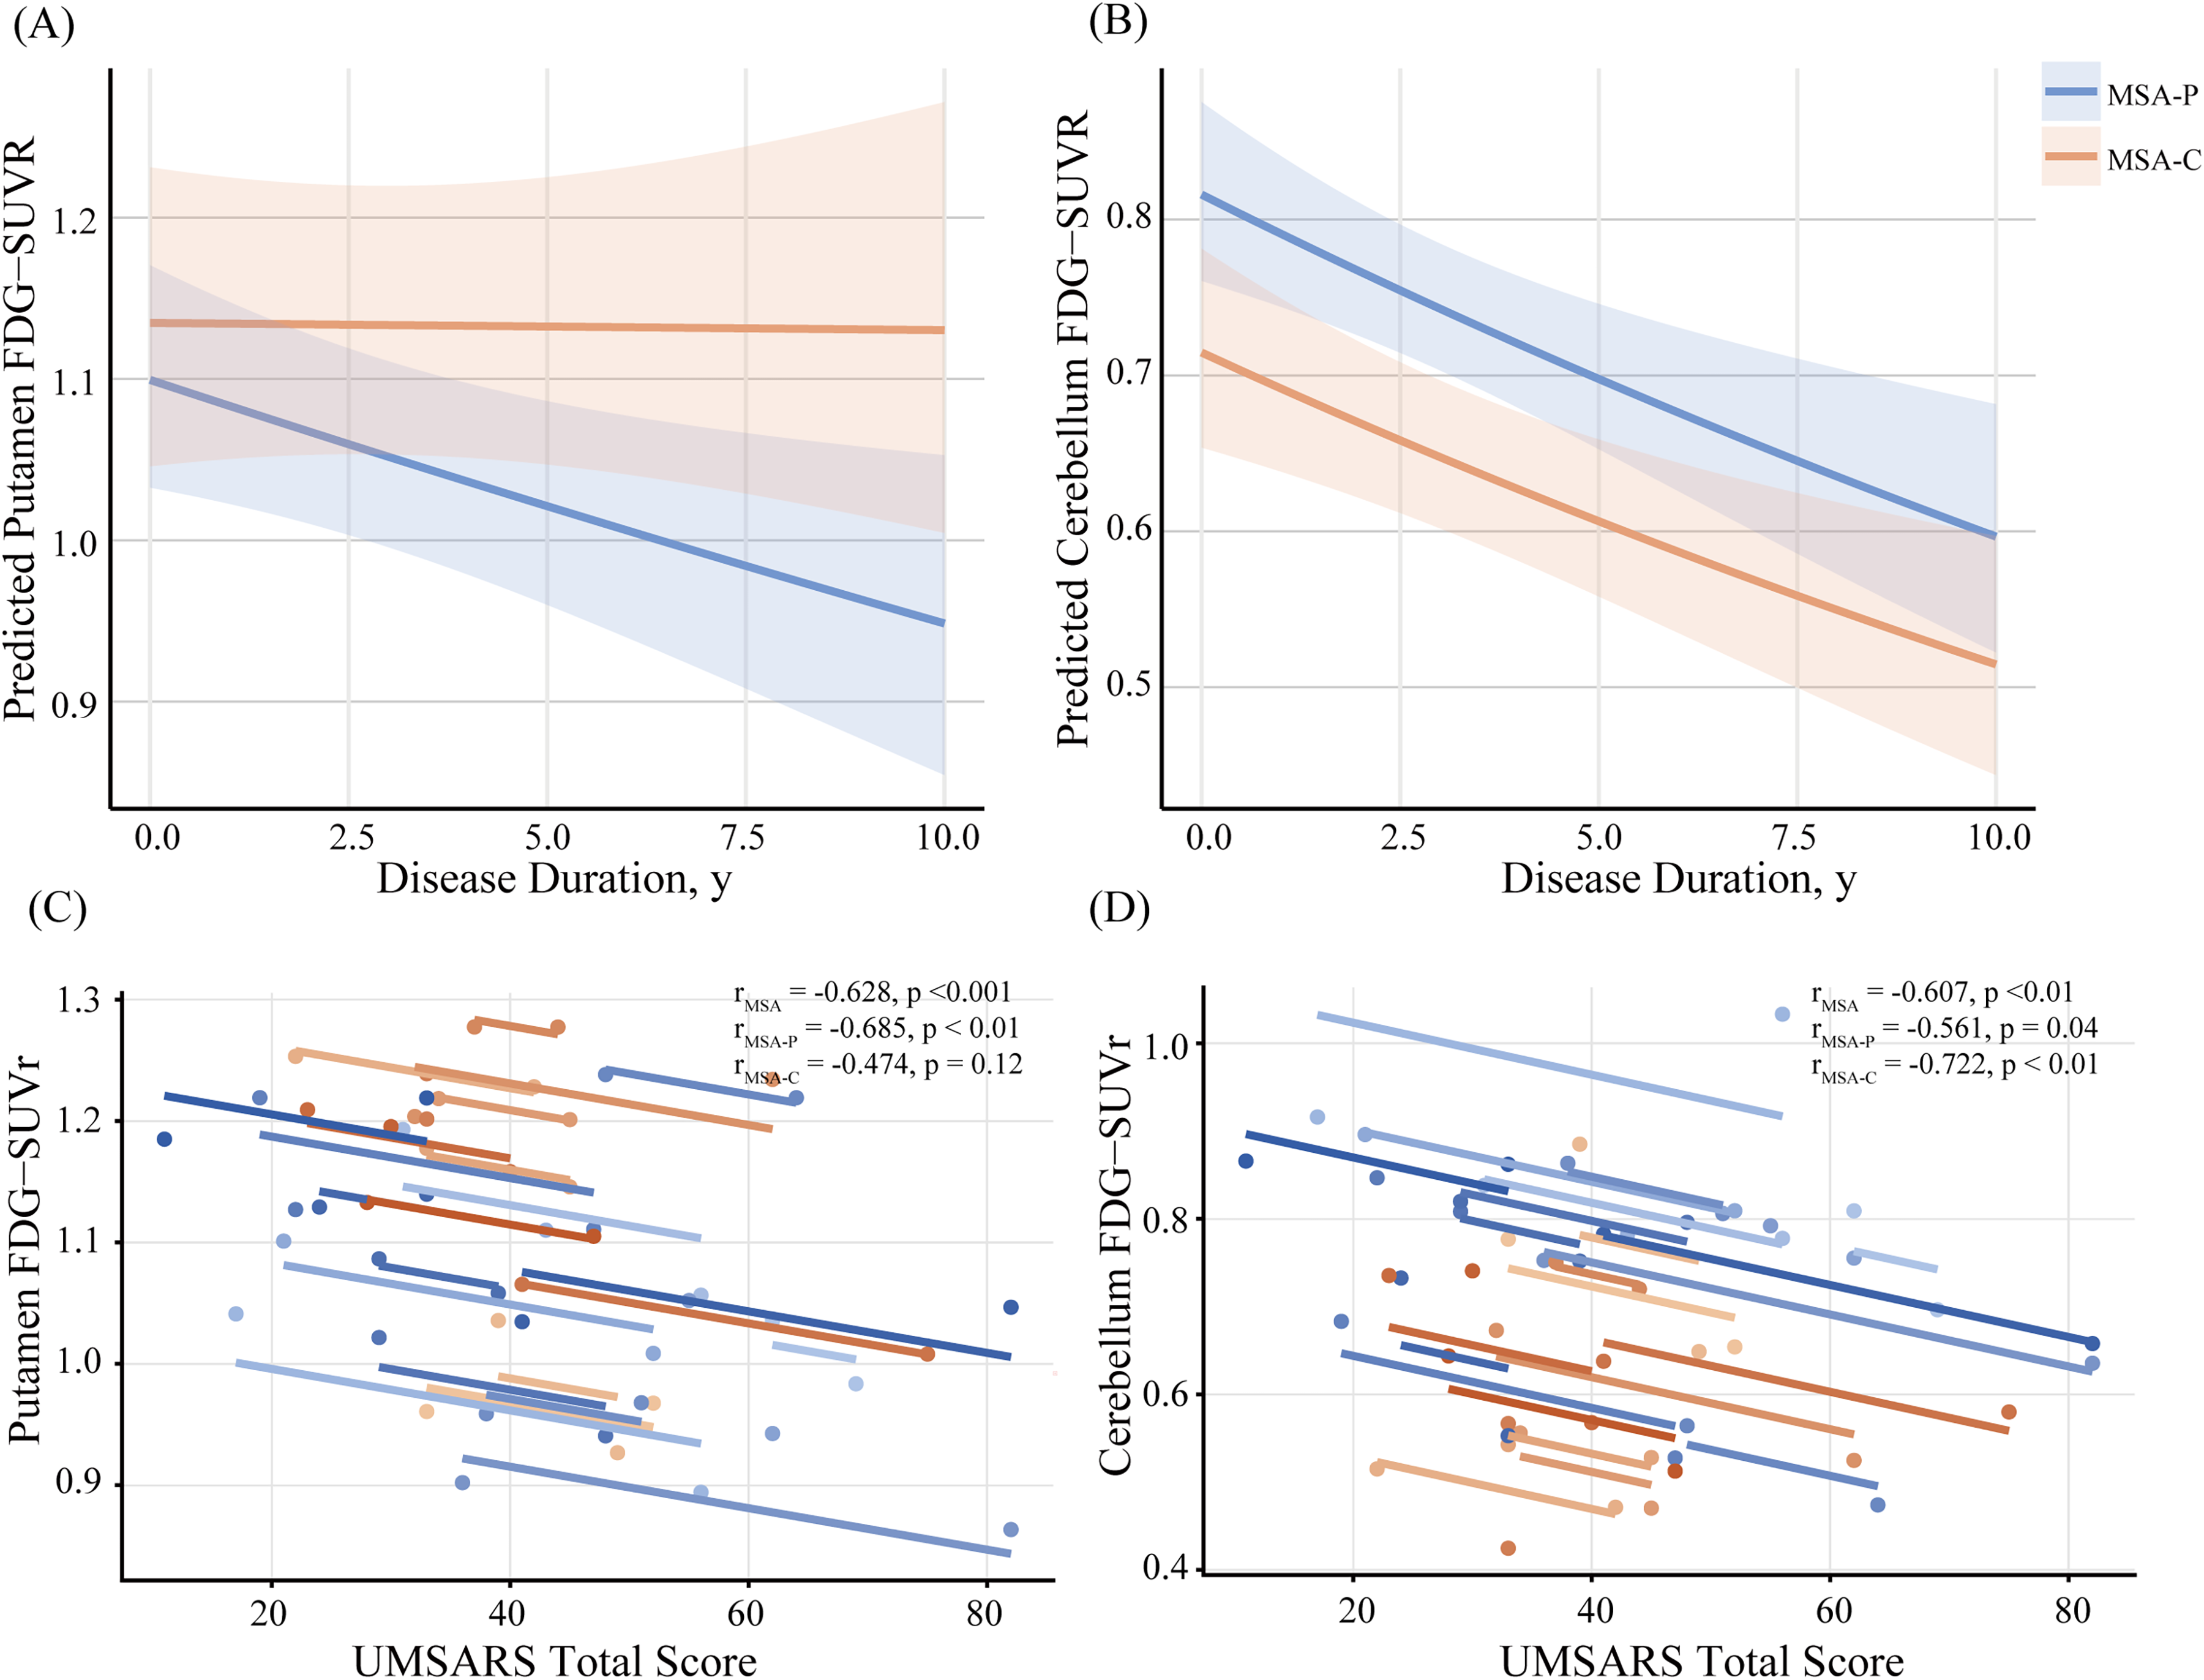
Longitudinal FDG-PET trajectories and clinical correlations in MSA subtypes. (A and B) Individual patient line plots of normalized FDG uptake (SUVR) over time in the (A) putamen and (B) cerebellum, color-coded per subject. In panels (C and D), each point represents a patient's SUVR at baseline or follow-up; colored lines are within-subject repeated-measures correlation (rmcorr) fits, depicting longitudinal trajectories. (C) showing a strong negative correlation between putaminal metabolism and UMSARS scores across the cohort (r = –0.63, p < 0.001); this association is more pronounced in the MSA-P subgroup (r = –0.68, p < 0.01); (D) illustrating a significant negative correlation between cerebellar metabolism and UMSARS scores (r = –0.61, p < 0.01), particularly within the MSA-C subgroup (r = –0.72, p < 0.01).
Longitudinal changes in regional FDG-PET metabolism in MSA-P and MSA-C patients.
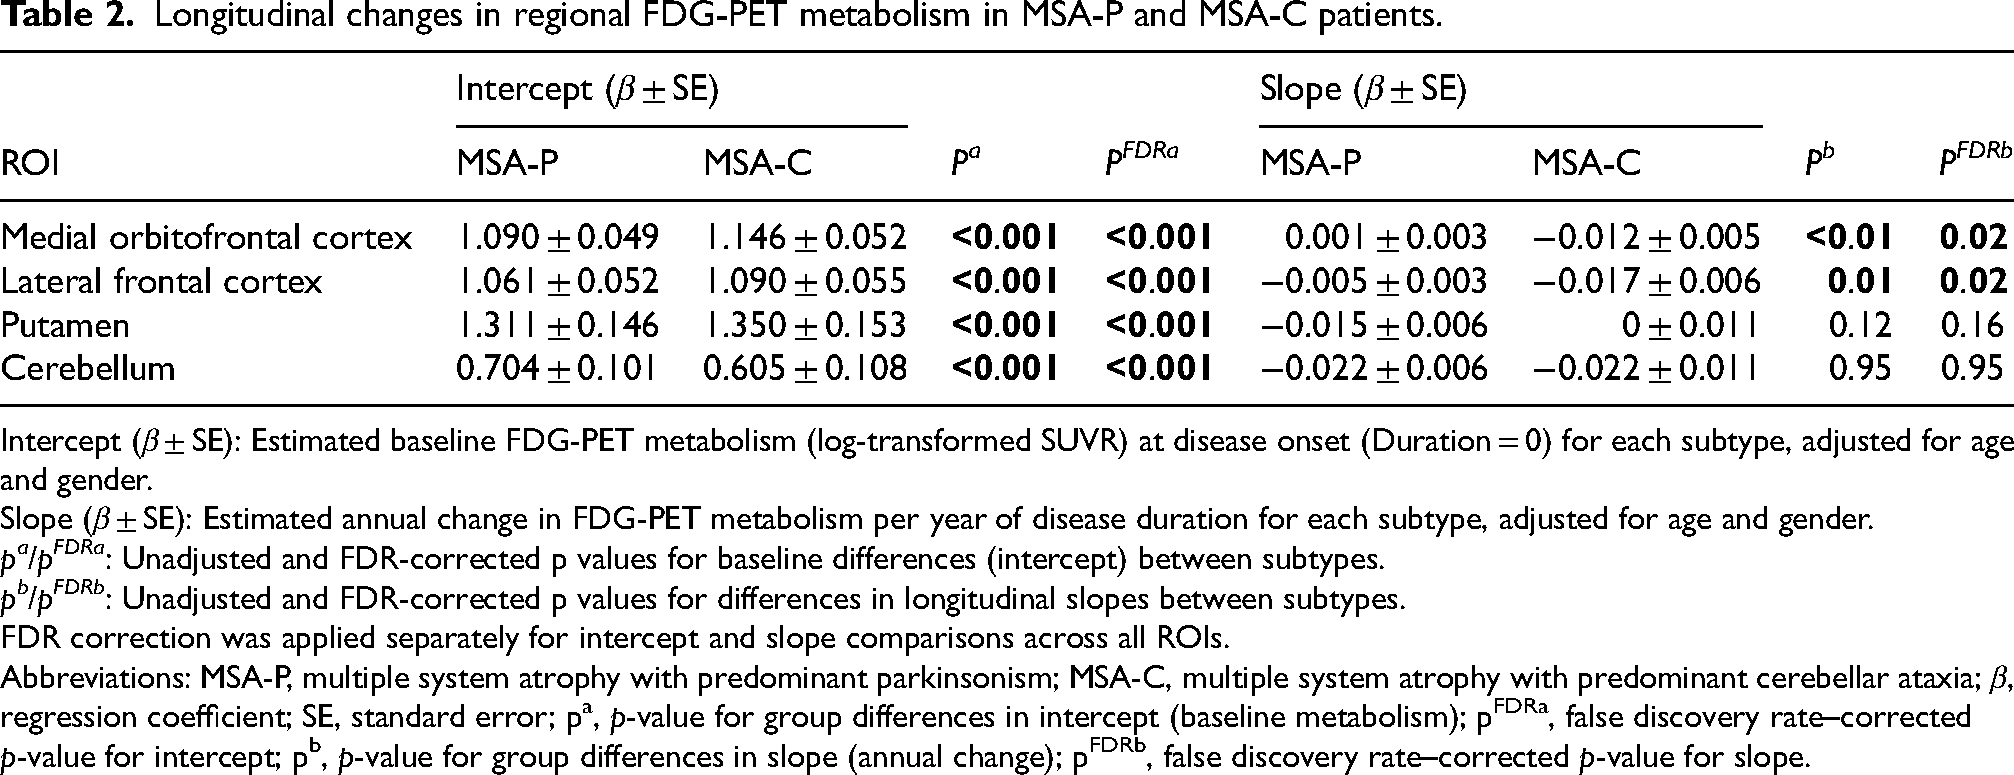
Intercept (β ± SE): Estimated baseline FDG-PET metabolism (log-transformed SUVR) at disease onset (Duration = 0) for each subtype, adjusted for age and gender.
Slope (β ± SE): Estimated annual change in FDG-PET metabolism per year of disease duration for each subtype, adjusted for age and gender.
pa/pFDRa: Unadjusted and FDR-corrected p values for baseline differences (intercept) between subtypes.
pb/pFDRb: Unadjusted and FDR-corrected p values for differences in longitudinal slopes between subtypes.
FDR correction was applied separately for intercept and slope comparisons across all ROIs.
Abbreviations: MSA-P, multiple system atrophy with predominant parkinsonism; MSA-C, multiple system atrophy with predominant cerebellar ataxia; β, regression coefficient; SE, standard error; pa, p-value for group differences in intercept (baseline metabolism); pFDRa, false discovery rate–corrected p-value for intercept; pb, p-value for group differences in slope (annual change); pFDRb, false discovery rate–corrected p-value for slope.
Regional hypometabolism progression tracks clinical deterioration in MSA
A significant negative association between regional glucose metabolism and clinical progression was revealed by rmcorr analysis. 16 Specifically, reduced metabolism in the putamen (r = −0.63, p < 0.001) and cerebellum (r = −0.61, p < 0.01) was strongly correlated with higher total scores on the UMSARS across the cohort (Figure 2C and D). Subtype-specific analyses further clarified the distinct roles of these regions: in MSA-P patients, putaminal hypometabolism showed a linear correlation with UMSARS scores (r = −0.68, p < 0.01), while in MSA-C patients, cerebellar metabolic decline was similarly associated with clinical deterioration (r = −0.72, p < 0.01).
Longitudinal metabolic connectivity changes in MSA
Compared with HCs, patients with MSA demonstrated the most prominent changes in intra-regional metabolic connectivity within the frontal cortex and cerebellum. Specifically, intra-frontal connectivity increased at baseline but declined over time, while intra-cerebellar connectivity showed an initial reduction followed by a compensatory increase. Beyond intra-regional changes, alterations were also observed in inter-regional metabolic networks. Connectivity between the basal ganglia and cerebellum showed a continuous decline, whereas connectivity between the basal ganglia and parietal cortex steadily increased. Cerebello-parietal connectivity initially increased but later declined, while cerebello-frontal connectivity remained consistently elevated compared to controls throughout the study period (Figure 3). Pairwise comparisons of metabolic connectivity across all ROIs for MSA-P, MSA-C, and HCs are presented in Supplementary Table 12, including both uncorrected and FDR-adjusted p-values.
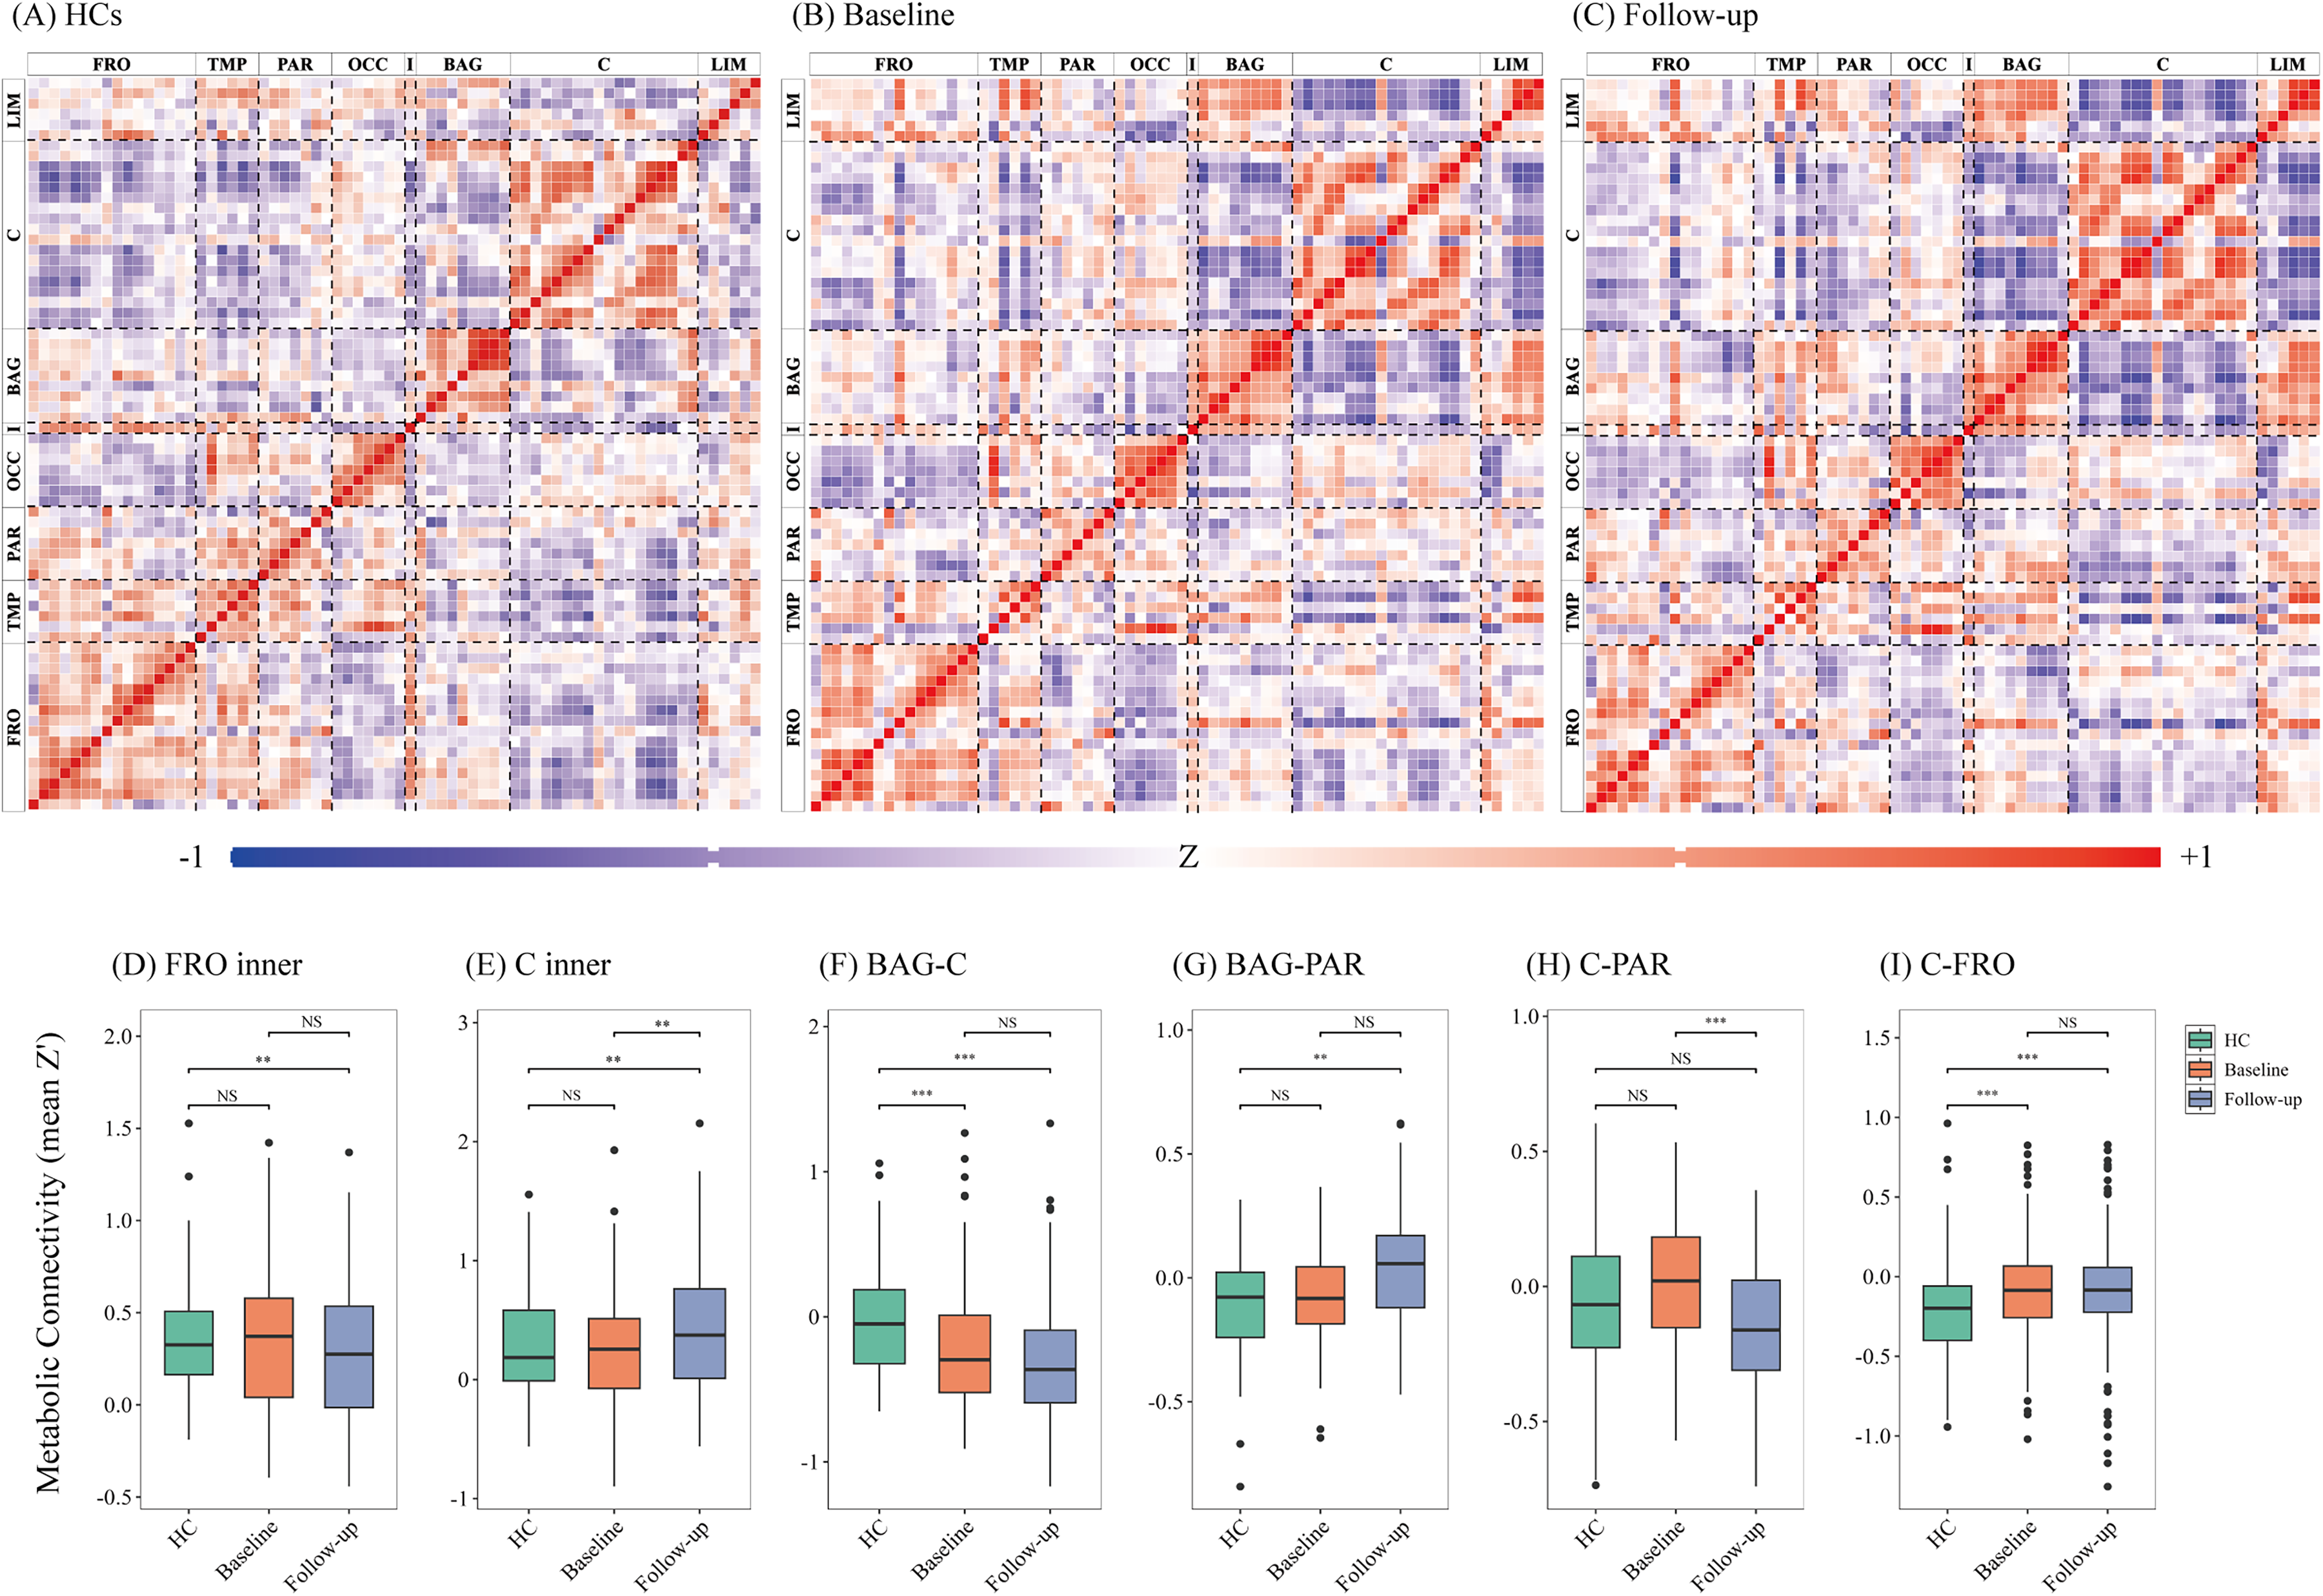
Longitudinal metabolic connectivity in MSA and HCs. (A) HCs demonstrate canonical metabolic connectivity patterns. (B) MSA patients at baseline and (C) at follow-up are shown, illustrating alterations in inter-regional connectivity over time. Matrices display Fisher z-transformed interregional correlation coefficients. Significant correlations are indicated by asterisks: * p < 0.05, ** p < 0.01, *** p < 0.001 (FDR-corrected). Warm colors (red) indicate preserved positive correlations (functional connectivity), while cool colors (blue) represent negative correlations (functional decoupling). Abbreviation: FRO, frontal cortex; TMP, temporal cortex; PAR, parietal cortex; OCC, occipital cortex; I, insula; BAG, basal ganglia; C, cerebellum and brainstem; LIM, limbic structures.
Discussion
In this longitudinal FDG-PET imaging study, we investigated the glucose metabolic changes and metabolic connectivity alterations in patients with MSA, focusing on different subtype and disease progression. We found that progressive putaminal hypometabolism in MSA-P and cerebellar hypometabolism in MSA-C were each closely associated with worsening UMSARS scores. Our findings provide novel insights into the metabolic signatures associated with MSA-P and MSA-C and highlight the potential of FDG-PET as a biomarker for tracking MSA disease progression.
As we found in the current study, FDG-PET performed well as practical biomarkers to MSA. In a clinicopathological study of 203 patients clinically diagnosed with MSA during life, the diagnostic accuracy was 78.8% (160/203), underscoring the persistent challenges in antemortem diagnosis. 17 A recent hybrid FDG-PET and MRI radiomics study achieved excellent discrimination between PD and MSA (AUC = 0.957 in validation), highlighting the diagnostic value added by FDG-PET in differentiating MSA from PD. 18 In a study of 166 parkinsonian patients using dual-tracer PET/CT, FDG-PET accurately differentiated PD from MSA-P with an AUC of 0.963, demonstrating that FDG-PET significantly enhances MSA diagnostic accuracy. 19 Beyond its diagnostic utility, FDG-PET also holds promise as a longitudinal biomarker for disease progression. For instance, in prodromal DLB with concurrent prodromal AD, the left orbitofrontal cortex shows a more pronounced metabolic decline. 20 Longitudinal FDG-PET studies in DLB have documented progressive hypometabolism in the occipital, parietal, and lateral temporal cortices, eventually involving the frontal lobes, primary sensorimotor areas, thalamus, and substantia nigra. 21 In the field of MSA, some cross-sectional studies indicate that MSA-C is primarily associated with cerebellar hypometabolism, whereas MSA-P exhibits combined involvement of the putamen and cerebellum.7,22 The findings were similar in our current study. Furthermore, in our present longitudinal investigation, both MSA subtypes exhibited significant clinical worsening at follow-up, as indicated by increased UMSARS total scores in the medication-off state. Parallel FDG-PET findings revealed progressive cerebral hypometabolism, reinforcing the potential of FDG-PET as a surrogate marker for disease progression in MSA.
Beyond regional metabolic deficits, our study revealed altered inter-regional metabolic connectivity, offering deeper insight into network-level changes in MSA. The observed reduction in connectivity within the basal ganglia and between the basal ganglia and parietal/temporal cortices points to early disruption of motor and executive circuits, reflecting broader network reorganization. A transient increase in fronto-limbic connectivity may reflect early compensatory recruitment to preserve cognitive and emotional functions. Over time, declining fronto-parietal and fronto-occipital connectivity indicates progressive network failure, consistent with clinical worsening. These findings align with the compensatory recruitment hypothesis, where initial increases in connectivity give way to collapse as neurodegeneration advances.
Our findings highlight the distinct responsible metabolic signatures underlying different MSA subtypes related to their key symptoms and disease progression. The longitudinal FDG-PET analysis revealed a progressive decrease of metabolism in putamen in MSA-P, and a sustained hypometabolism in cerebellum in MSA-C. The responsible regions tracked closely with the rising UMSARS scores and worsening motor function. FDG-PET plays a supportive role in the diagnosis of MSA, as per the current consensus criteria. 4 Previous cross-sectional studies suggested that longer disease duration in MSA is associated with greater putaminal hypometabolism. 8 Here, we provide the first longitudinal evidence that reductions in FDG-PET uptake correlate with increasing disease severity, as measured by UMSARS scores, with putaminal hypometabolism predominating in MSA-P and cerebellar hypometabolism in MSA-C. These findings align with the selective involvement of striatonigral degeneration in MSA-P and olivopontocerebellar atrophy in MSA-C, reinforcing the hypometabolism in putamen and cerebellum as subtype-specific markers.
Several limitations should be acknowledged. First, the relatively small sample size may limit the generalization of our findings. In the future, the larger and multicenter cohorts are needed to validate these results and refine the clinical applications of FDG-PET as biomarkers for MSA. Second, the patients were included by clinical diagnosis, and the absence of neuropathological confirmation should be admitted. Third, the present work focused primarily on glucose metabolism, but other imaging modalities, such as dopamine transporter (DAT) imaging and MRI-based structural and functional connectivity analyses, could provide complementary information on neurodegenerative changes in MSA. Fourth, longitudinal FDG-PET data were unavailable for HCs, limiting our ability to separate disease-specific metabolic decline from normal aging. Finally, because the study relied on retrospectively collected PET data, the design imposes inherent constraints on longitudinal inference, and the reported disease-related trajectories should therefore be interpreted with appropriate caution.
Conclusion
This longitudinal FDG-PET study reveals distinct metabolic trajectories in MSA subtypes, linking regional hypometabolism to clinical progression. MSA-P is characterized by predominant hypometabolism in the putamen, while MSA-C shows early and severe cerebellar involvement. Progressive decline in the putamen and cerebellum correlates with worsening UMSARS scores, making these regions key biomarkers for disease progression. Additionally, MSA patients demonstrate significant alterations in metabolic connectivity over time, particularly within the frontal cortex and basal ganglia, and between the basal ganglia, cerebellum, and parietal cortex. These findings underscore the value of FDG-PET in monitoring MSA progression, providing insights into subtype-specific neurodegenerative patterns and supporting its potential for early diagnosis and therapeutic interventions.
Supplemental Material
sj-tif-1-pkn-10.1177_1877718X261455593 - Supplemental material for Cerebral metabolic trajectories alterations in multiple system atrophy: A longitudinal FDG-PET study
Supplemental material, sj-tif-1-pkn-10.1177_1877718X261455593 for Cerebral metabolic trajectories alterations in multiple system atrophy: A longitudinal FDG-PET study by Yixin Zhao, Huamei Lin, Xinyi Li, Qi Shen, Jing Wang, Chuantao Zuo, Jian Wang, Jingjie Ge and Feng-Tao Liu in Journal of Parkinson's Disease
Supplemental Material
sj-docx-2-pkn-10.1177_1877718X261455593 - Supplemental material for Cerebral metabolic trajectories alterations in multiple system atrophy: A longitudinal FDG-PET study
Supplemental material, sj-docx-2-pkn-10.1177_1877718X261455593 for Cerebral metabolic trajectories alterations in multiple system atrophy: A longitudinal FDG-PET study by Yixin Zhao, Huamei Lin, Xinyi Li, Qi Shen, Jing Wang, Chuantao Zuo, Jian Wang, Jingjie Ge and Feng-Tao Liu in Journal of Parkinson's Disease
Footnotes
Acknowledgments
We are grateful to all the patients who took part in this study.
Ethics declaration
The authors confirm that all methods were carried out by relevant guidelines and regulations by the Human Studies Institutional Review Board, Huashan Hospital, Fudan University (KY2011-213). The authors confirm that informed consent was obtained from all patients and/or their legal guardians to use the clinical data of patients for research.
Author contributions
YX Z and XY L drafted the manuscript. YX Z, XY L, and HM L sorted out the data. YX Z, HM L, XY L, Q S and W Jing illustrated and captioned all the figures and tables. CT Z and W Jian concept and design the research project. JJ G and FT L critically reviewed and revised the manuscript and approved the final draft for publication.
Funding
The authors disclosed receipt of the following financial support for the research, authorship, and/or publication of this article: F.-T. Liu was supported by the National Natural Science Foundation of China (grants 82371266 and 82171252); Clinical Research Project Supported by Huashan Hospital, Fudan University (grant 2023-YN008). J.-J. Ge was supported by Shanghai Science and Technology Natural Science Foundation (No.25ZR1402042).
This work was supported by the the National Natural Science Foundation of China, Joint Fund of the National Natural Science Foundation of China and the Karst Science Research Center of Guizhou Province, Shanghai Science and Technology Natural Science Foundation, Clinical Research Project Supported by Huashan Hospital, Fudan University, (grant number 82371266, 82171252, No.25ZR1402042, 2023-YN008).
Declaration of conflicting interests
The authors declared no potential conflicts of interest with respect to the research, authorship, and/or publication of this article.
Data availability
The data generated during and/or analyzed during the current study are available from the corresponding author upon reasonable request.
Supplemental material
Supplemental material for this article is available online.
References
Supplementary Material
Please find the following supplemental material available below.
For Open Access articles published under a Creative Commons License, all supplemental material carries the same license as the article it is associated with.
For non-Open Access articles published, all supplemental material carries a non-exclusive license, and permission requests for re-use of supplemental material or any part of supplemental material shall be sent directly to the copyright owner as specified in the copyright notice associated with the article.