
Abstract
Background
Parkinson's disease (PD) is a common neurodegenerative disease lacking treatments that modify progressive neuron loss. Terazosin (TZ) increases activity of the glycolytic enzyme phosphoglycerate kinase 1 and could potentially benefit impaired brain bioenergetics in PD. Preclinical data are encouraging, but we lack human data on relationships between TZ dose and measures of TZ target engagement in women and men.
Objective
This study evaluated the dose-dependent effects of TZ on brain and systemic bioenergetics and safety and tolerability in neurologically healthy older adults.
Methods
We administered TZ (1, 5, and 10 mg/day) to 18 neurologically healthy 60–85-year-old people. We measured plasma and cerebrospinal fluid TZ concentrations and changes in levels of whole blood ATP, brain ATP with 31P magnetic resonance spectroscopy, cerebral metabolic activity with 18F-FDG PET imaging, and plasma metabolomics. We also assayed tolerability and safety.
Results
TZ crossed the blood-brain barrier, and 5 mg/day increased whole blood ATP and decreased brain 18F-FDG uptake. TZ 1 mg/day lacked significant effects, and 10 mg/day did not produce additional metabolic benefit compared to 5 mg/day. These effects were similar for both sexes. Mild dizziness occurred in 3 females and 1 male.
Conclusions
These findings in humans align with results from preclinical cell, animal, and epidemiological studies. Our data show that TZ increases markers of energy metabolism with a biphasic dose-response and suggest that 5 mg/day TZ may provide maximal benefit while minimizing adverse consequences of higher doses. These results lay groundwork for clinical trials in people with PD.
Plain language summary
This research focused on how the medication terazosin (TZ), typically used for prostate issues and high blood pressure, affects energy levels in the brain and body of older adults who do not have neurological diseases. It is believed that TZ could help with energy problems in the brain that occur in Parkinson's disease because of its ability to activate a specific enzyme involved in energy production. In this study, 18 people aged between 60 and 85 received different doses of TZ (1 mg, 5 mg, and 10 mg per day). Measurements included how much TZ reached the brain and its effect on energy molecules like ATP, which powers our cells. Advanced imaging techniques were used to see how the brain's energy usage changed and how energy usage in the participants’ blood changed as an indication altered metabolism. The findings showed that a dose of 5 mg of TZ per day was most effective in increasing ATP levels without causing significant side effects. This dose also reduced energy usage in the brain, which might sound counterintuitive, but is consistent with increased energy efficiency. Higher doses did not show added benefits, and the effects were similar in both men and women. Understanding how TZ works at different doses helps lay the groundwork for future trials, potentially leading to new treatments for Parkinson's disease and similar conditions. This study is a step toward determining safe and effective TZ doses for possibly slowing down neurodegeneration due to energy deficits in the brain.
Introduction
Parkinson's disease (PD) is the second most common neurodegenerative disease.1,2 Current treatments can reduce some PD symptoms but no therapies prevent progressive neurodegeneration. 3 However, recent research has demonstrated that impaired brain bioenergetics are a key factor in PD. 4 Specifically, the mitochondrial toxin MPTP causes parkinsonism in humans and animal models of PD,5–11 and PD-causing mutations can disrupt cellular respiration.12–19 Furthermore, advancing age is the major risk factor for developing PD and is associated with disrupted energy metabolism,20–26 as is seen in the brains of PD patients. 27 Therefore, interventions targeting energy metabolism have potential to slow or halt the progressive neuron loss seen in PD. 28
Recent studies discovered that terazosin (TZ), an α-1 adrenergic receptor antagonist used to treat benign prostatic hypertrophy and hypertension, has an additional independent target in phosphoglycerate kinase 1 (PGK1). 29 PGK1 is the first ATP-producing enzyme in glycolysis, and interestingly, human mutations in PGK1 are associated with parkinsonism.30–33 TZ's ability to enhance energy metabolism via activation of PGK1 suggested that it might improve impaired PD bioenergetics. In testing that hypothesis, we found that TZ enhanced glycolysis and mitochondrial activity, increased ATP levels in the brain, and importantly, slowed or prevented neurodegeneration in diverse cellular and animal models of PD. 34 Those discoveries were complemented by several large epidemiological studies that associated TZ use with a decreased risk of developing PD and slower disease progression in people with PD.35–39 However, there are epidemiological reports suggesting that medications like TZ may not be protective for PD but rather that comparator medications, such as tamsulosin, may increase the likelihood of receiving a diagnosis of PD. 37 These contradicting results demonstrate the need for further studies of TZ in humans. Additionally, a small pilot study suggested TZ engaged its target and increased ATP levels in people with PD. 40
Although these findings are encouraging, key questions remain. First, animal studies suggest TZ penetrates the blood-brain barrier (BBB) 34 ; does TZ cross the BBB in humans, enabling it to reach its intended target? Second, because TZ is predominantly prescribed to treat benign prostatic hyperplasia, epidemiological studies only included men; does TZ similarly influence energy metabolism in men and women? Third, orthostatic hypotension is more common in women than men, 41 and PD can cause orthostatic hypotension; compared to men, does TZ place women at a greater risk for orthostatic hypotension? Fourth, TZ has a biphasic effect on energy metabolism in vitro and in vivo 34 ; what is the relationship between TZ dose and changes in measures of energy metabolism? To answer these questions, we studied the pharmacokinetic and pharmacodynamic properties of TZ in older healthy adults. To test target engagement, we measured whole blood ATP levels corrected for hemoglobin (ATP/Hgb), 31phosphorous-magnetic resonance spectroscopy (31P-MRS) to assay the ratio of βATP to inorganic phosphate (Pi) in the brain, 18F-fludeoxyglucose positron emission tomography (FDG-PET) to examine metabolic activity patterns, and plasma metabolites to assess systemic metabolic changes.
Methods
Participants
This study was approved by the Institutional Review Board at the University of Iowa (NCT: 04551040). All participants signed informed consent documents. Two cohorts of neurologically healthy older adults, aged between 60 and 85, were enrolled. Figure 1 displays the study timeline and titration schedules. Cohort A included six participants who were titrated to a daily TZ dose of 5 mg over five weeks. Cohort B included twelve participants who were titrated to 10 mg of TZ per day following a similar five-week schedule. The dosing regimens were designed based on historical use of TZ and pharmacological considerations, with the higher dose in Cohort B providing insights into the effects of TZ at doses beyond epidemiologically observed averages.
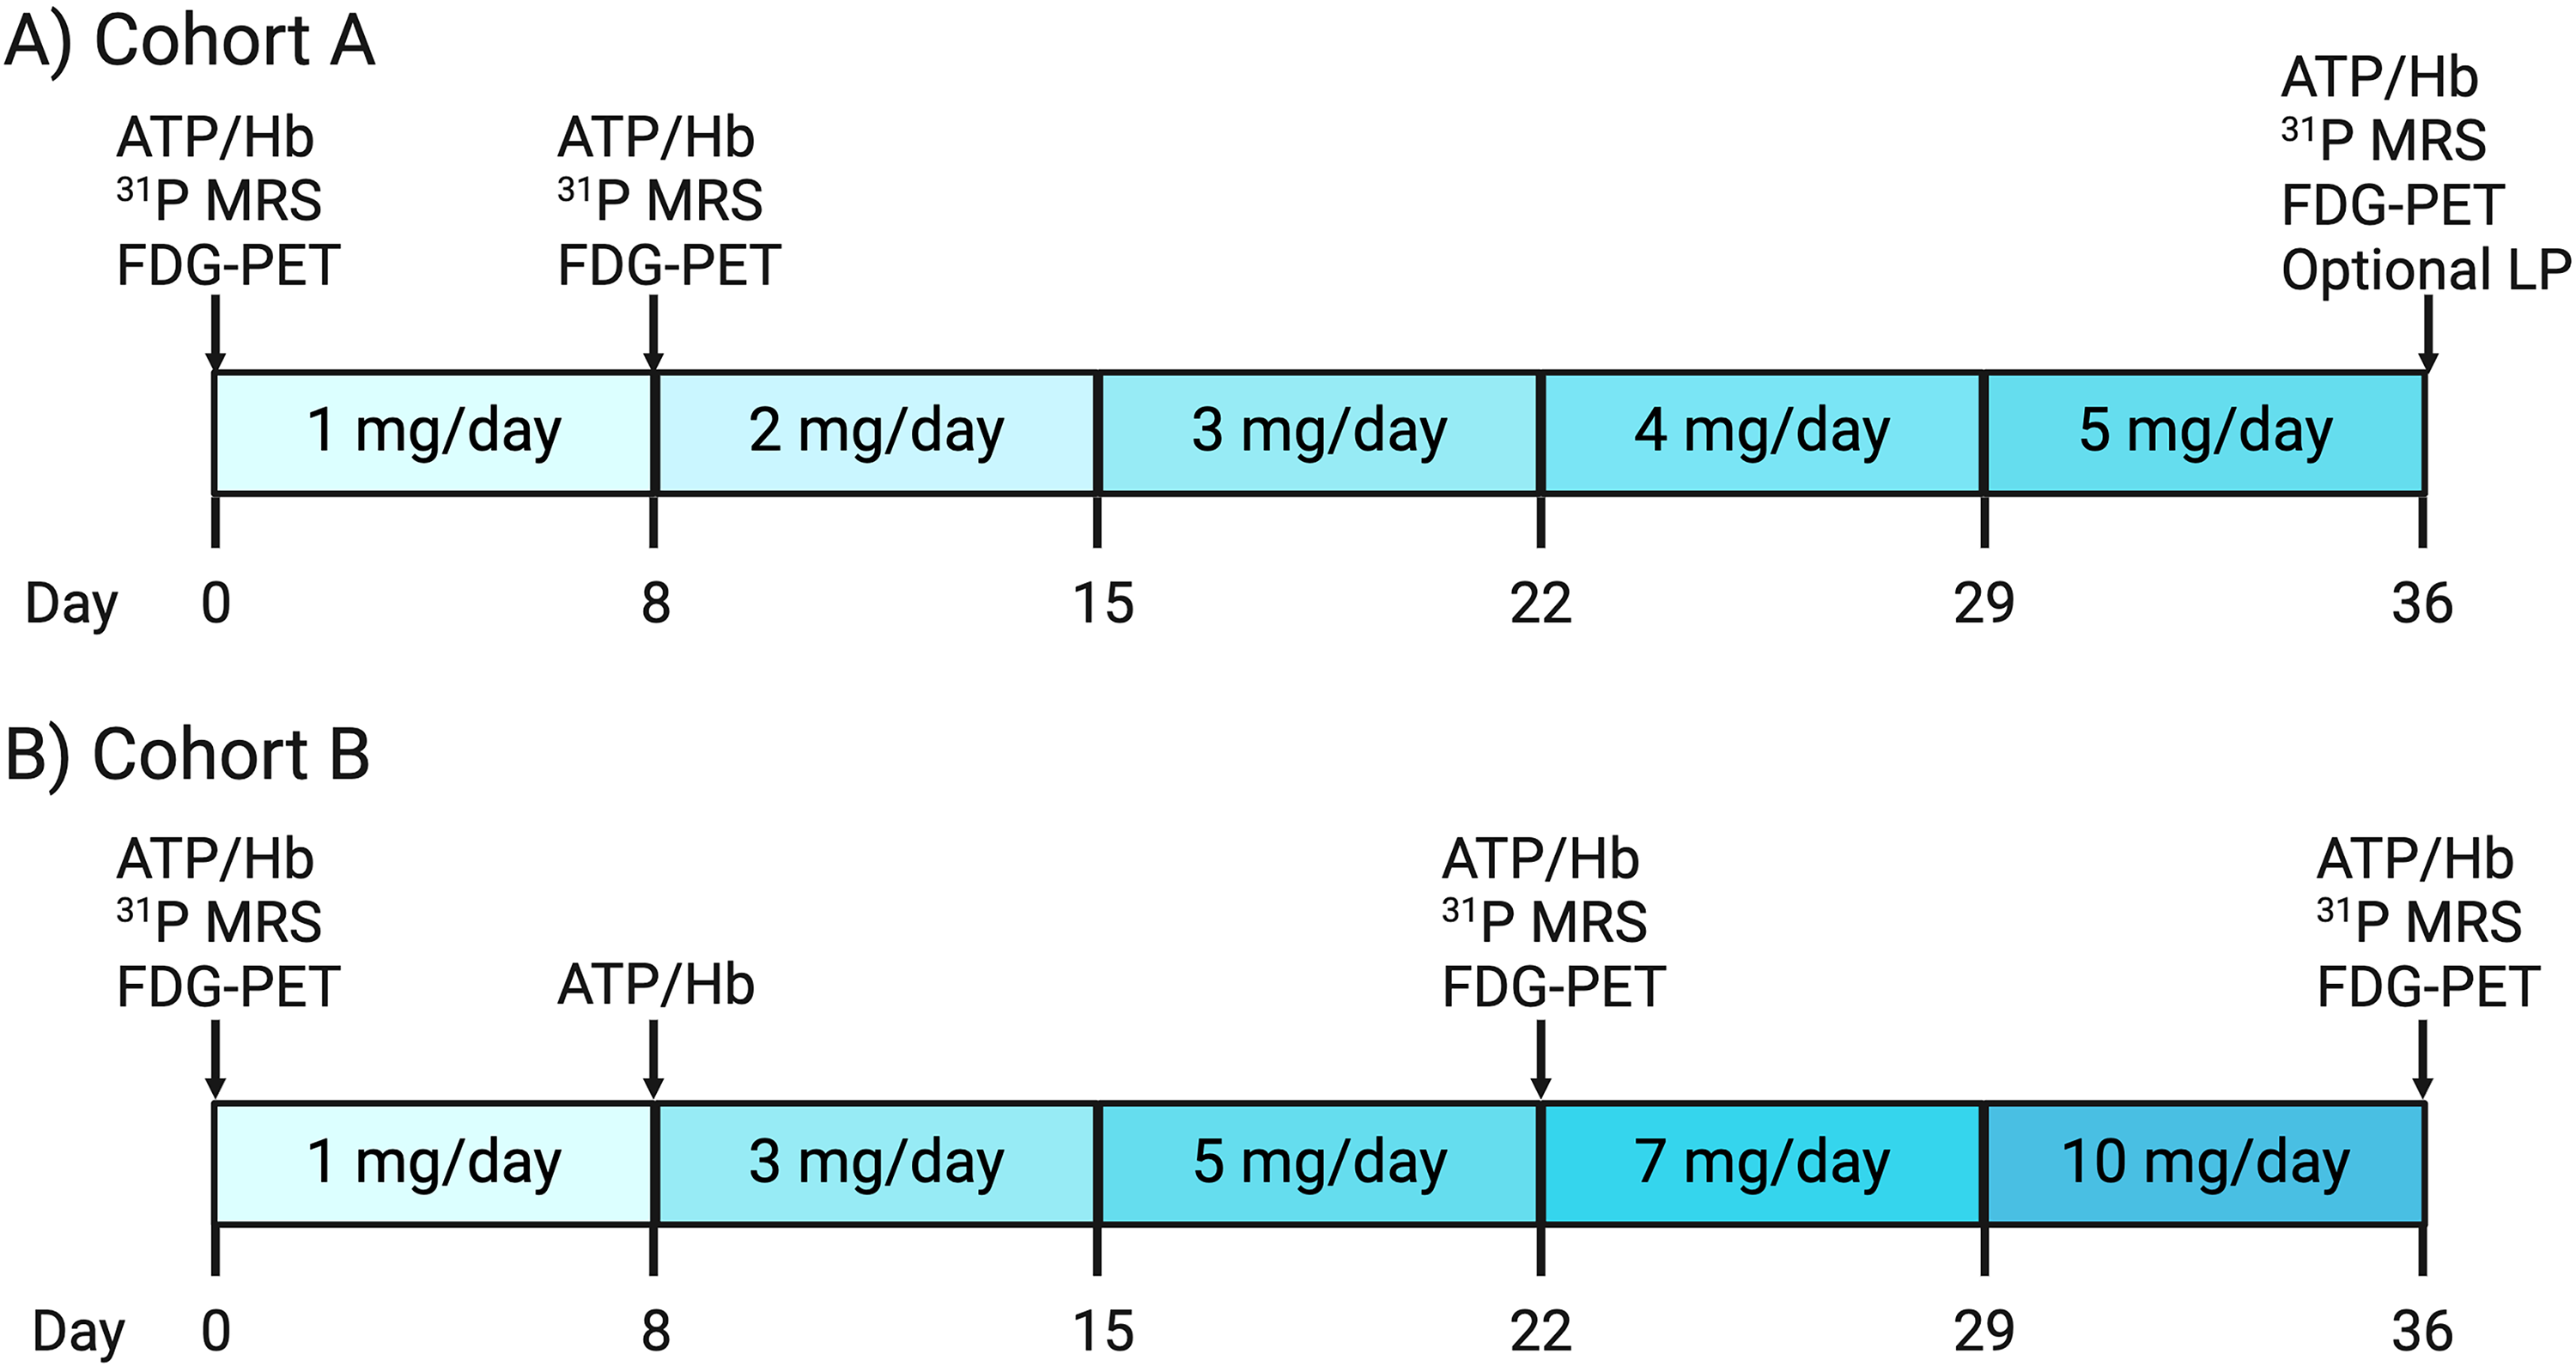
Study design. (A) There were six participants in Cohort A. These participants were titrated to a final dose of 5 mg/day TZ over 5 weeks. Three participants underwent a lumbar puncture after taking TZ 5 mg/day for one week. Participants underwent three in-person visits that all included imaging studies. (B) There were 12 participants in Cohort B. These subjects were titrated to a final dose of 10 mg/day TZ over 5 weeks. Participants underwent four in-person visits with imaging studies occurring at baseline, when participants were taking TZ 5 mg/day, and when participants were taking TZ 10 mg/day.
Cohort A was sex-balanced (3 females and 3 males), had a mean age of 73.0 years, and an average body mass index (BMI) of 25.9 kg/m2. Baseline blood pressure readings varied, with an average systolic pressure of 132 mmHg and a diastolic pressure of 83 mmHg. Orthostatic blood pressure and heart rate changes were also measured while supine and after standing for three minutes. The mean changes in systolic blood pressure (SBP) and diastolic blood pressure (DBP) was 2 mmHg and 6 mmHg, respectively, while the mean increase in heart rate (HR) was 10.7 beats per minute (bpm). Cohort B had a female majority (8 females and 4 males) with a mean age of 69.3 years, an average BMI of 26.9, and mean baseline blood pressure readings of 123/74 mmHg. The mean orthostatic changes were −4 mmHg for SBP, 4 mmHg for DBP, and 10 bpm for HR (Table 1). All participants were determined not to have PD or other brain disorders. Additionally, no subjects were taking medications, such as verapamil, that may be associated with pharmacokinetic changes of terazosin.
Baseline demographics.
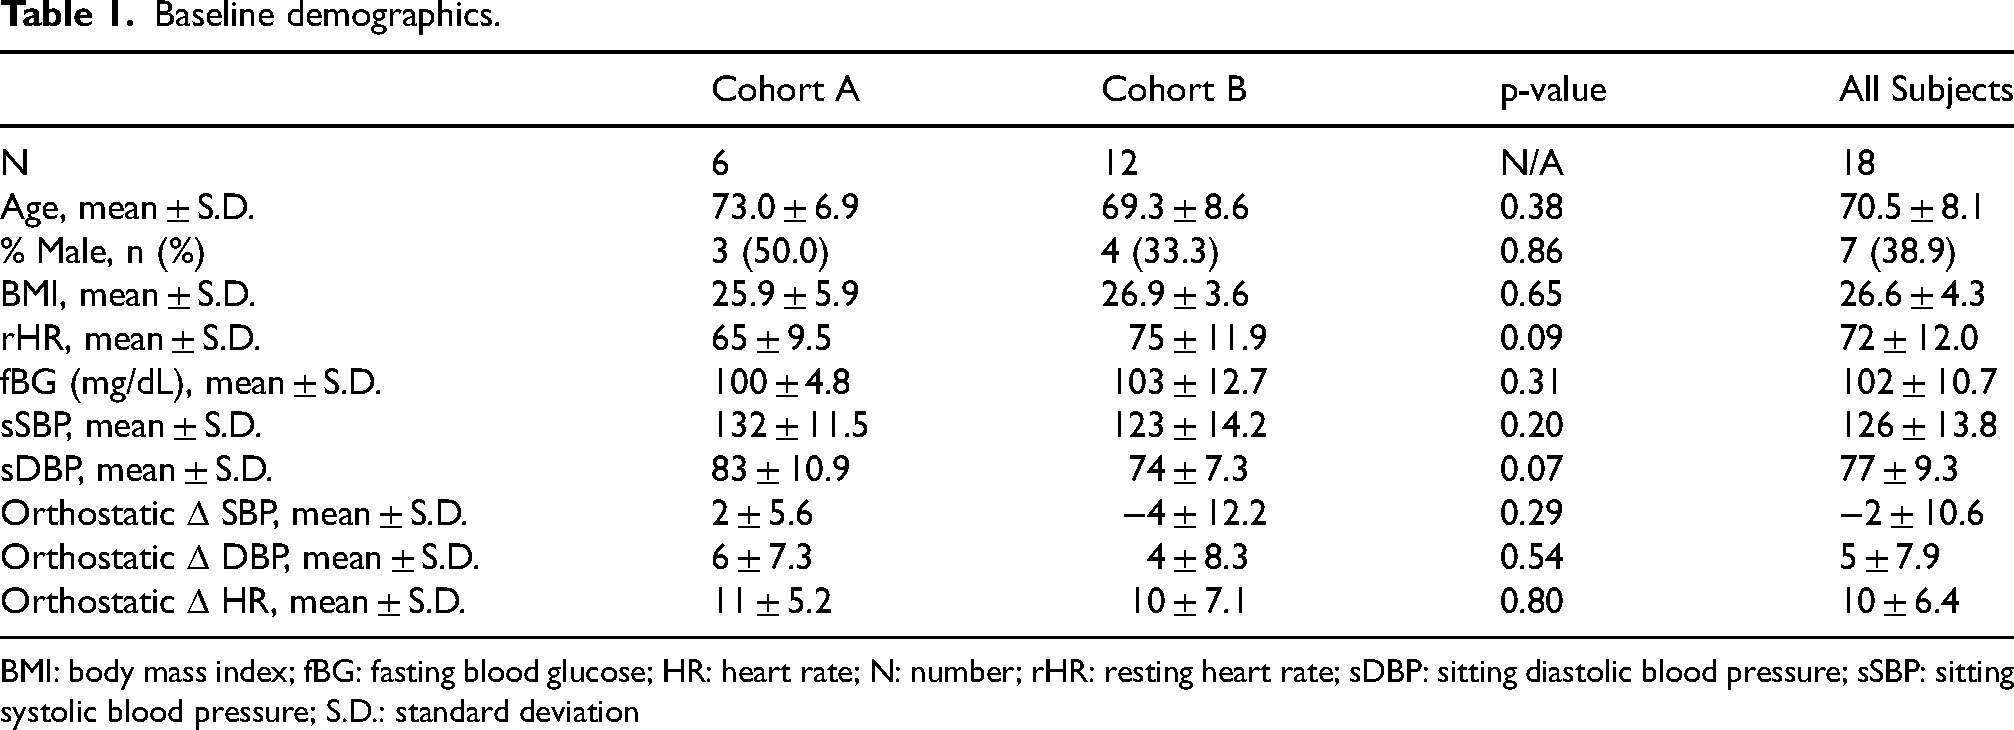
BMI: body mass index; fBG: fasting blood glucose; HR: heart rate; N: number; rHR: resting heart rate; sDBP: sitting diastolic blood pressure; sSBP: sitting systolic blood pressure; S.D.: standard deviation
Study protocol
Participants in Cohort A began with a baseline assessment, including 31P-MRS, 18F-FDG PET, and a blood draw, before beginning a weekly titration of 1 mg TZ each week, starting at 1 mg (Figure 1) and culminating in a final evaluation at 5 mg. The imaging and blood draws were performed after one week at 1 mg/day and again at 5 mg/day; the latter timepoint included an optional lumbar puncture, performed by University of Iowa neurologists. Three volunteers underwent the lumbar puncture. Cohort B followed a similar 5-week schedule that started with the same baseline assessments but a more accelerated titration (i.e., weekly 2 mg increases), starting from 1 mg and ending at 10 mg. Comprehensive follow-ups (i.e., 31P-MRS, 18F-FDG PET, and a blood draw) were performed after one week at 5 mg and again at 10 mg (Figure 1).
Throughout the study, safety and tolerability were monitored, including orthostatic hypotension and potential drug-related adverse effects due to TZ's known impact on blood pressure.
Liquid chromatography-mass spectrometry (LC-MS) to measure TZ plasma and CSF concentration
The Metabolomics Core at the University of Iowa developed an assay to quantify TZ in the plasma and cerebrospinal fluid (CSF) using LC-MS. Details regarding sample preparation and extraction are provided in the Supplemental Material. A standard dilution series was prepared in a commercially available human plasma sample (Innovative Research Inc, IPLAWBLIH50ML; Novi, MI) for TZ as described under sample preparation and extraction where 10 µl of TZ dilution was added in place of water. The final concentration of terazosin in the standard dilution series were 500, 250, 125, 62.5, 31.2,15.6 pg/µl. Samples for the calibration curve were prepared in triplicate. Three sample prepared without any spiked terazosin.
Mass spectrometry to quantify plasma metabolites
The Metabolomics Core at the University of Iowa used LC-MS and Gas Chromatography Mass Spectrometry (GC-MS) to quantify plasma metabolites. Details regarding sample collection and processing are provided in the Supplemental Material. Xcalibur software (Thermo Fisher) was used for data acquisition and initial data quality control. TraceFinder software was used for peak analysis. Linear regression analysis of the standard dilutions series and extrapolation to unknowns was carried out in GraphPad Prism.
Whole blood luminescence assay of ATP
Blood was collected in heparin anticoagulant and used for measurements of whole blood. Sample values were compared to hemoglobin standards provided with the kit. Whole blood ATP levels were normalized to hemoglobin levels. 42 Further details regarding data collection and handling are provided in the Supplemental Material.
31P magnetic resonance spectroscopy
We acquired 31P-MRS spectra using an established protocol 40 to quantify brain ATP fluctuations and evaluate target engagement. Participants undergoing the 31P MRS neuroimaging procedure were allowed to take their regular medications. Imaging was conducted using a GE SIGNA 7.0 T MRI scanner equipped with a RAPID Biomedical 31P/1H dual-tuned birdcage head coil. Subjects were positioned within the coil for a series of scans, including 1) a localizer scan, 2) a 1H anatomical scan, 3) high-order B0 shimming, 4) Bloch-Siegert-based center frequency and transmitter gain optimization (PCr peak centered at 0 Hz), and 5) quantitative, non-localized 31P MRS scans. Automated high-order shimming of the whole brain was performed with deep-learning-based autoHOS software. 43 The 31P MRS data collection employed a free induction decay (FID) sequence with a short block-shaped excitation pulse (152 μs) at a 20° flip angle. Each scan consisted of 128 acquisitions, with parameters including a TR of 2000 ms, 2048 sampling points, and a spectral width of 10,000 Hz. Three FID replicates at each time point were acquired to assess measurement uncertainty. FIDs were zero-filled to 8 K and apodized with 5 Hz line-broadening prior to Fourier-Transformation. Spectral analyses were performed on magnitude spectra for enhanced reproducibility. Metabolite peaks were identified within fixed boundaries (PCr: −1.5 to −2.0 ppm, αATP: −9.0 to −6.0 ppm, βATP: −18.0 to −14.0 ppm, γATP: −4.0 to −1.5 ppm, and inorganic phosphate: 4.4 to 5.8 ppm), with peak areas integrated as the summation of data points within these ranges. This approach accounted for minor peak position shifts due to pH-induced variations. Peak positions were determined by locating the maximum spectral amplitude. Total spectral signal intensity was computed by summing all data points within the −25 ppm to +25 ppm range.
18F-FDG PET imaging
Participants were instructed to fast for at least 6 h before FDG injection. Blood glucose was checked via finger stick and glucose levels were required to be ≤ 200 mg/dl to proceed with imaging. Scanning was performed on a GE Discovery MI Time of Flight PET/CT camera with SiPM array detector technology (GE Healthcare, Waukesha, WI). Participants laid supine and imaging commenced when 5 mCi of FDG was administered via venous catheter. The participant rested on the imaging table with eyes open and ears unplugged for the duration of the 60 min dynamic image collection. Imaging was dynamically collected in six frames of 5 s each (i.e., 6 × 5 s) followed by 9 × 10 s, 10 × 30 s, 13 × 60 s, and 8 × 300 s beds (3600 s = 60 min total). Computed tomography (CT) images were acquired immediately before the PET scan and were utilized for attenuation-correction of the ensuing PET image. All imaging sets were reconstructed using VUE Point HD reconstruction with 16 subsets and 6 iterations; PET images were also corrected for tracer decay, attenuation, scatter, and dead-time. For Cohort A, 18F-FDG PET was acquired at baseline, after one week at 1 mg TZ, and after one week at 5 mg TZ. Cohort B was imaged at baseline, after one week at 5 mg TZ, and after one week at 10 mg TZ. Structural T1-weighted MPRAGE brain magnetic resonance imaging (MRI; used for PET co-registration during analysis) was acquired on a GE Discovery 950 7 T scanner with a 32-channel head coil at 1 mm isotropic voxel size (Cohort A) and 0.43 × 0.43 × 0.69 mm voxel size (Cohort B). For co-registration with PET, all Cohort B T1-weighted images were resampled to 1 mm isotropic in PMOD (PMOD Technologies LLC, Zurich, Switzerland) using SINC interpolation.
PET image preprocessing and analysis were performed with PMOD version 4.4 modules. The final 30 min of the 60-min scan were spatially aligned (i.e., motion corrected) and then summed to create a static 18F-FDG PET image. Using the Brain Parcellation workflow in the PNEURO module, the structural MRI was segmented into gray and white matter and probabilistically parcellated into cortical and deep nuclei volumes of interest (VOIs) according to Hammers N30R83 atlas. The static PET image was then co-registered with the structural MRI and the average standardized uptake value (SUV) of each VOI was calculated. Lastly, each regional SUV was normalized to the blood glucose measured before a given scan with the following formula: (SUV * blood glucose)/100. This correction helped reduce the impact of different glucose levels 44 during the study visits on the FDG signal. A volume-weighted global mean comprised of all VOIs, excluding CSF and white matter regions, was also calculated to represent systemic (i.e., whole-brain) metabolic changes.
Statistical analysis
For all analyses, we constructed linear mixed-effect regression analyses with a random effect per subject to evaluate changes in outcomes as a function of dose. For analyses of changes in blood pressure from baseline, we controlled for baseline age, sex, and BMI. These same covariates were included in the analysis of the concentration of TZ at varying doses. The models that evaluated the percent change from baseline in whole blood ATP and change in FDG uptake included the covariates of baseline age, sex, BMI, and baseline ATP or baseline FDG uptake, respectively. These models were repeated to evaluate the dose-by-sex interaction to determine if there were significantly different dose effects as a function of sex.
All analyses were performed in RStudio version 4.3.1 using the lmerTest package. Unless otherwise stated, individual data points in all figures represent unadjusted values, while indicators of aggregated data, such as means with error bars, represented the predicted mean from the models after adjusting for covariates. Results were considered significant if the p-value was < 0.05.
Deidentified participant data will be made available upon reasonable request to the corresponding author.
Results
Protocol
We screened 19 people. One withdrew prior to the baseline visit, leaving 6 in Cohort A and 12 in Cohort B. One participant from Cohort B was unable to complete the final study visit due to severe weather. All other participants completed all aspects of the study and provided full datasets. Table 1 shows the baseline demographics.
TZ concentration in plasma
As the TZ dose increased, the plasma TZ concentration increased approximately linearly (Figure 2A). The TZ concentration at 1 mg/day was 0.02 ± 0.01 μg/mL (mean ± SEM), at 5 mg/day was 0.08 ± 0.01 μg/mL, and at 10 mg/day was 0.14 ± 0.01 μg/mL. These changes did not differ significantly as a function of sex (Supplemental Table 1).
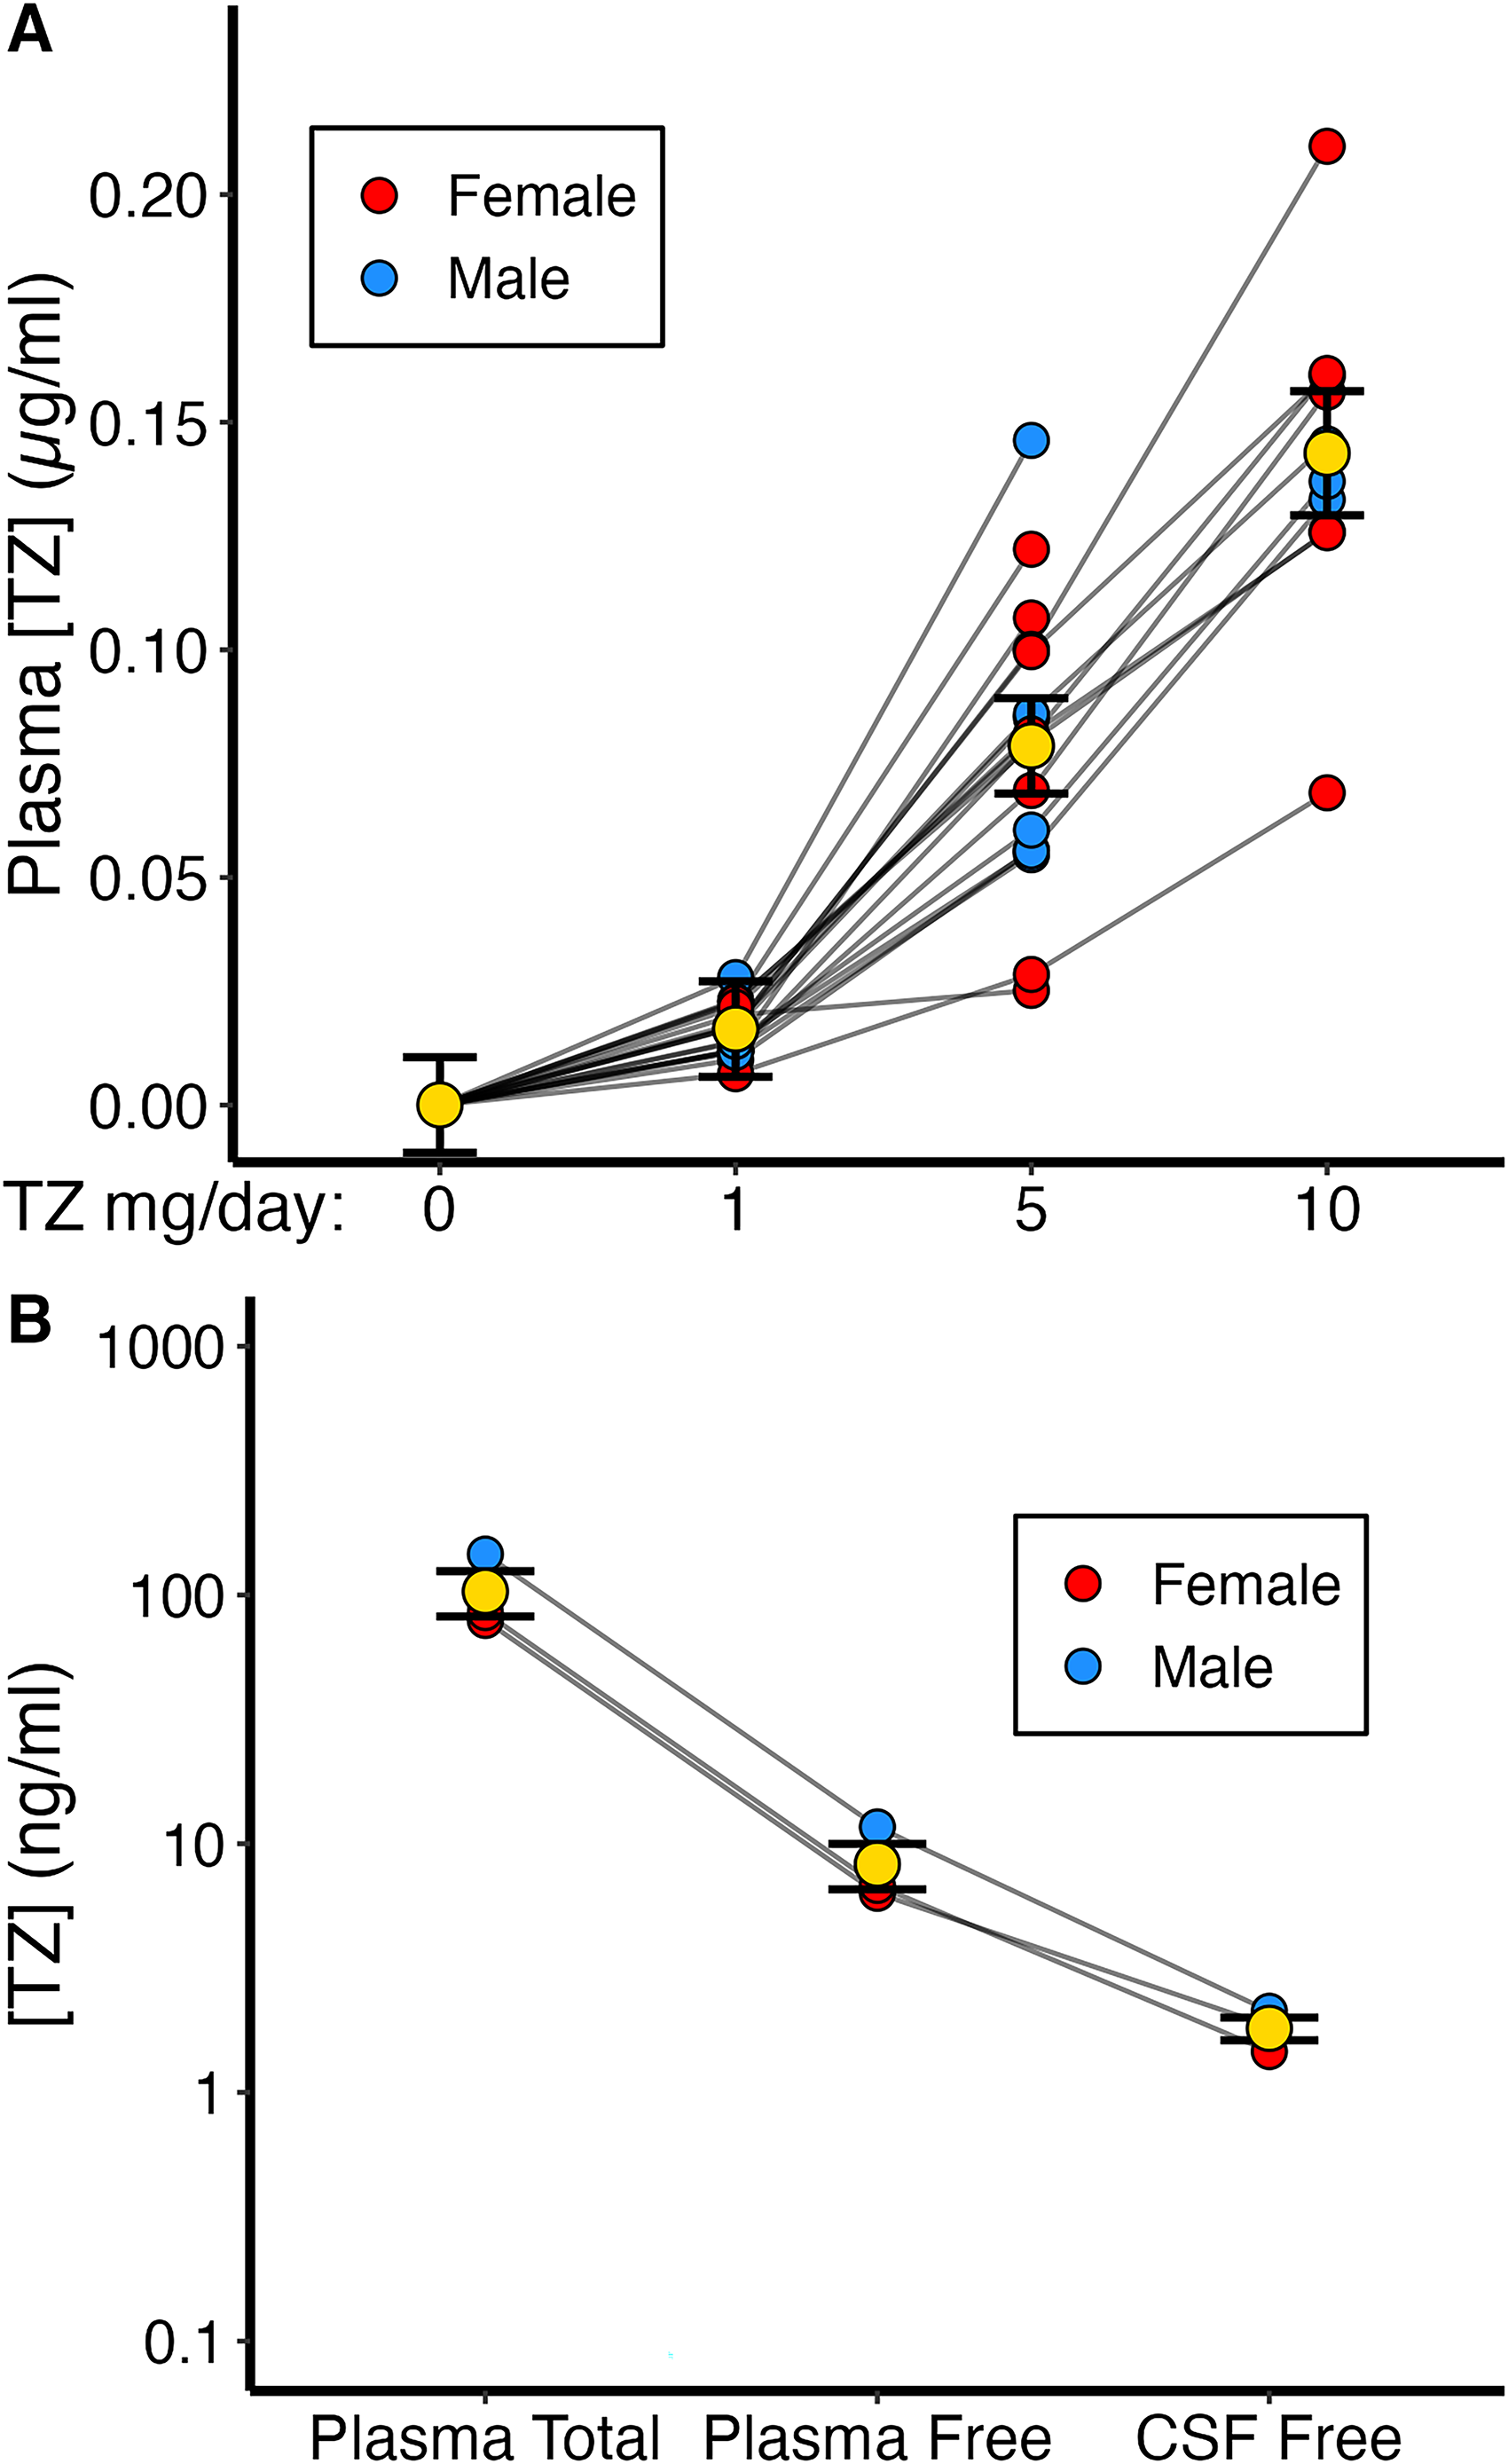
Tz concentrations in plasma and cerebrospinal fluid. (A) The concentration of TZ was significantly higher from baseline at all doses. Data were available for 18 subjects at TZ 1 mg/day, 18 subjects at TZ 5 mg/day, and 10 subjects at TZ 10 mg/day. (B) TZ was reliably detected in the CSF of all the three subjects from Cohort A who underwent a lumbar puncture while taking a TZ dose of 5 mg/day. Yellow dots and whiskers indicate mean ± SEM.
TZ concentration in CSF
To test TZ brain penetration, we obtained CSF by lumbar puncture in three volunteers who took TZ 5 mg/day for 1 week. We measured plasma and CSF TZ concentrations and calculated the plasma-free TZ concentration (TZ is ∼92% protein-bound 45 ). The CSF TZ concentration was 23 ± 3% (mean ± SEM) of the free plasma concentration, a ratio expected based on plasma availability (Figure 2B). 45 The mean TZ concentration in the CSF at TZ 5 mg/day was 1.81 ng/mL.
ATP/Hb levels in whole blood
Compared to baseline values, 1 mg/day TZ did not significantly increase whole blood ATP/Hb levels (Figure 3A). However, 5 mg/day TZ increased ATP/Hb levels compared to both baseline (6.2 ± 1.7%, mean ± SEM, p < 0.01) and to 1 mg/day (p = 0.006). Moreover, ATP/Hb levels increased >5% in 11 of the 18 subjects at TZ 5 mg/day. In contrast, 10 mg/day of TZ did not further increase ATP/Hb. There were no differences as a function of sex (Supplemental Table 1).
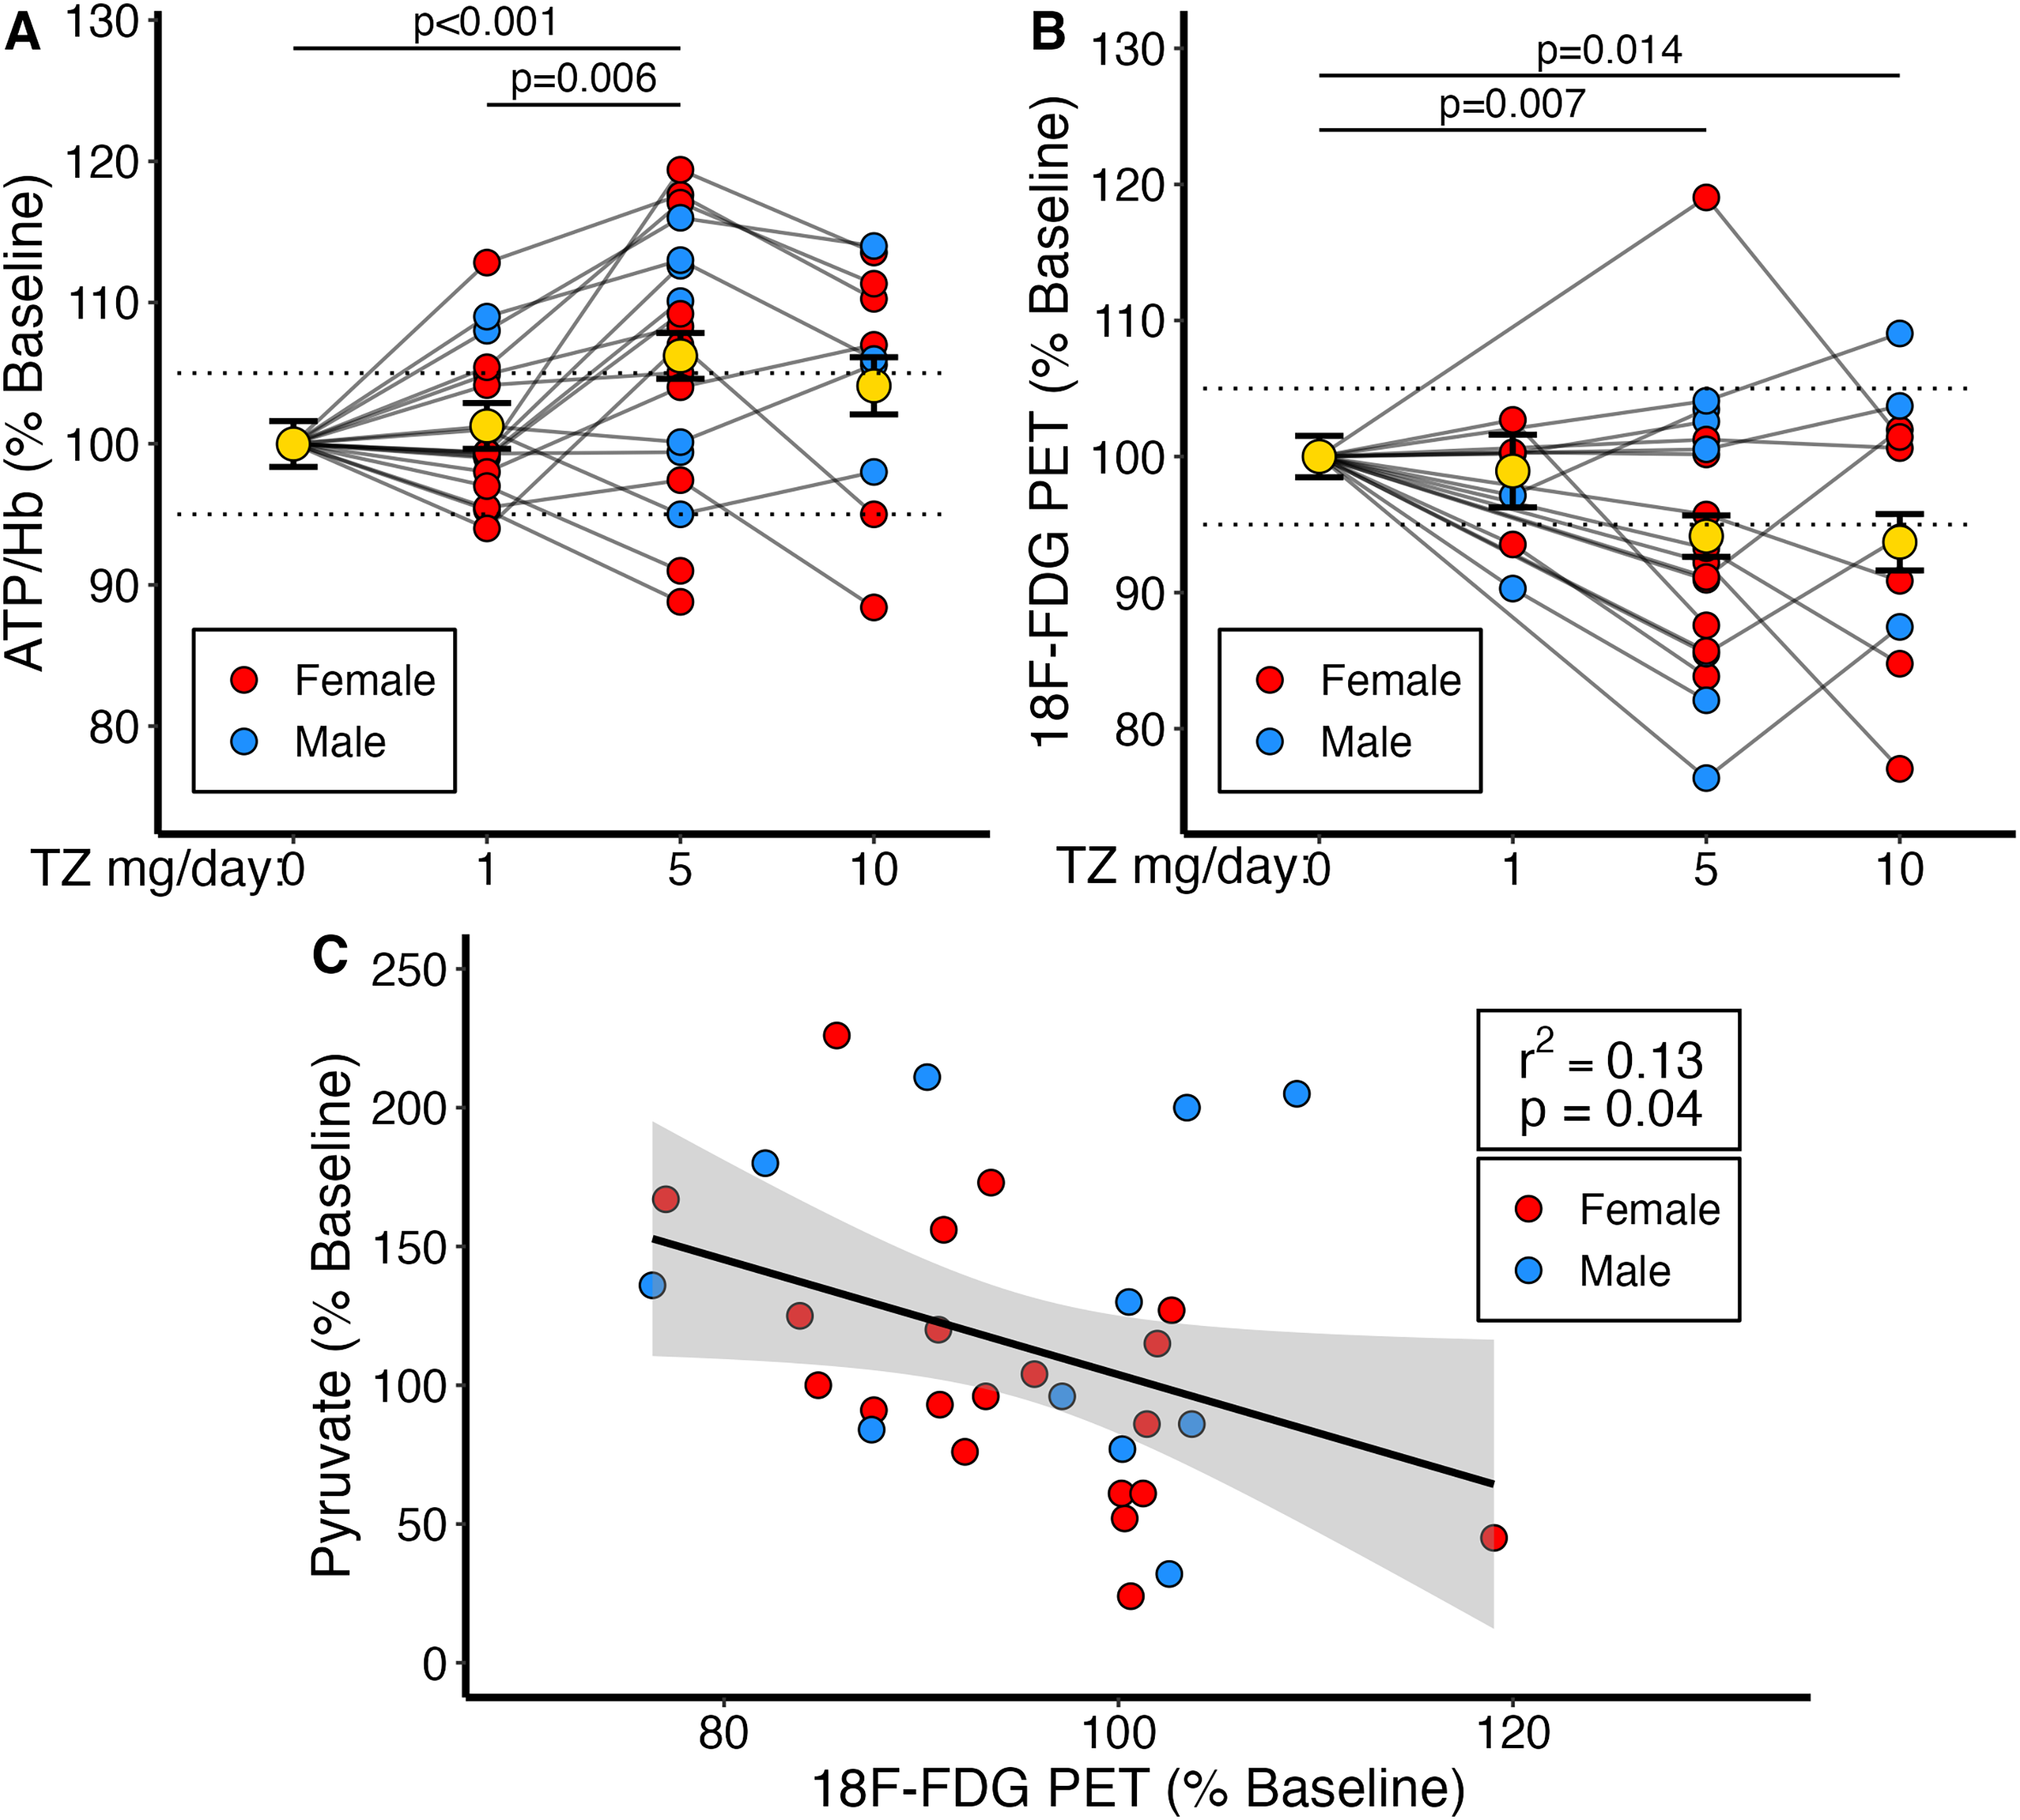
TZ-Induced changes in ATP/Hb and 18F-FDG PET. (A) Changes in whole blood ATP/Hb compared to baseline. Changes at 1 mg/day (1.26% ± 1.62, p = 0.46), 5 mg/day (6.22% ± 1.62, p < 0.01), and 10 mg/day (4.10% ± 2.02, p = 0.06). Comparisons between 1 mg/day and 5 mg/day (p < 0.01) and between 5 mg/day and 10 mg/day (p = 0.32). Data are from 18 participants at 1 and 5 mg/day, and 10 participants at 10 mg/day. (B) Changes in 18F-FDG PET for whole-brain standardized uptake values (SUV) compared to baseline. Changes in SUV at 1 mg/day (−1.36% ± 3.06, p = 0.66), 5 mg/day (−6.14% ± 2.15, p < 0.01), and 10 mg/day (−6.59% ± 2.58, p = 0.01). Comparisons between 5 mg/day and 10 mg/day (p = 0.86). Sample sizes were 6 at 1 mg/day, 18 at 5 mg/day, and 10 at 10 mg/day. Dashed lines represent a 5% increase or decrease and are presented for visualization purposes only. Yellow dots and whiskers indicate mean ± SEM. (C) Decreases in 18F-FDG PET correlate with increases in plasma pyruvate levels. Line and shading represent the fitted linear regression and the 95% confidence interval, respectively.
Consistent with previously reported results, we also evaluated the mean ATP/Hb values at baseline and at each dose of TZ rather than the percent change from baseline. The mean concentration of ATP at baseline was 58.0 ± 1.1 ATP/Hb. At 1 mg/day, the mean was 58.8 ± 1.1 ATP/Hb, which was not significantly different from baseline (p = 0.522). AT TZ 5 mg/day, the mean level of ATP was significantly elevated relative to baseline at 61.7 ± 1.1 ATP/Hb (p = 0.002). At 10 mg/day, there was no difference from baseline in ATP concentration (60.2 ± 1.3, p = 0.118; Supplemental Figure 1).
Ratio of βATP/Pi in brain
We used 31P-magnetic resonance spectroscopy to assay the ratio of βATP to inorganic phosphate (βATP/Pi) in brain. None of the TZ doses significantly changed βATP/Pi. βATP/Pi at 1 mg/day TZ was 0.5 ± 1.9% (n = 6, mean ± SEM, p = 0.80), at 5 mg/day was 0.2 ± 1.4% (n = 16, p = 0.89), and at 10 mg/day was −1.6 ± 1.6% (n = 9, p = 0.32). There were no differences as a function of sex (Supplemental Table 1).
18F-FDG PET in brain
TZ 1 mg/day did not significantly change global (the average SUV from all brain regions) FDG uptake from baseline (−1.4 ± 3.1%; p = 0.66) (Figure 3B). However, TZ 5 mg/day decreased the global FDG uptake (−6.1 ± 2.2%) (mean ± SEM) (p < 0.01). TZ 10 mg/day also decreased FDG uptake (−6.6 ± 2.6%; p = 0.01), but not significantly greater than 5 mg/day (p = 0.86). There were no differences as a function of sex (Supplemental Table 1). Additionally, there were no significant changes from baseline in fasting blood glucose levels.
Plasma GC-MS metabolomic analysis
Previous studies showed that TZ increased intracellular levels of pyruvate, a product of glycolysis, in multiple brain regions including the substantia nigra, striatum, and cortex of mice and prevented the MPTP-induced fall in brain pyruvate and ATP. 34 Compared to baseline, plasma pyruvate levels were 61 ± 17% higher than baseline (mean ± SEM, p < 0.01) on 1 mg/day TZ, 18 ± 18% (p = 0.33) on 5 mg/day TZ, and 12 ± 21% (p = 0.57) on 10 mg/day TZ. Given the effect of TZ on 18F-FDG PET, we compared changes in plasma pyruvate to changes in 18F-FDG PET. We found that as 18F-FDG uptake decreased, plasma pyruvate levels increased (Figure 3C).
Safety and tolerability
Systolic (SBP) and diastolic (DBP) blood pressures decreased from baseline at 5 and 10 mg/day TZ (Figure 4), consistent with its α-1 adrenergic receptor antagonistic activity. There were no significant changes in orthostatic blood pressure from baseline at any dose of TZ. However, there was a significant increase from baseline in orthostatic heart rate at TZ 5 mg/day (5 bpm ± 2, p = 0.01; Supplemental Figure 2). There were no significant sex differences in the changes in blood pressure or heart rate by dose (Supplemental Table 1).
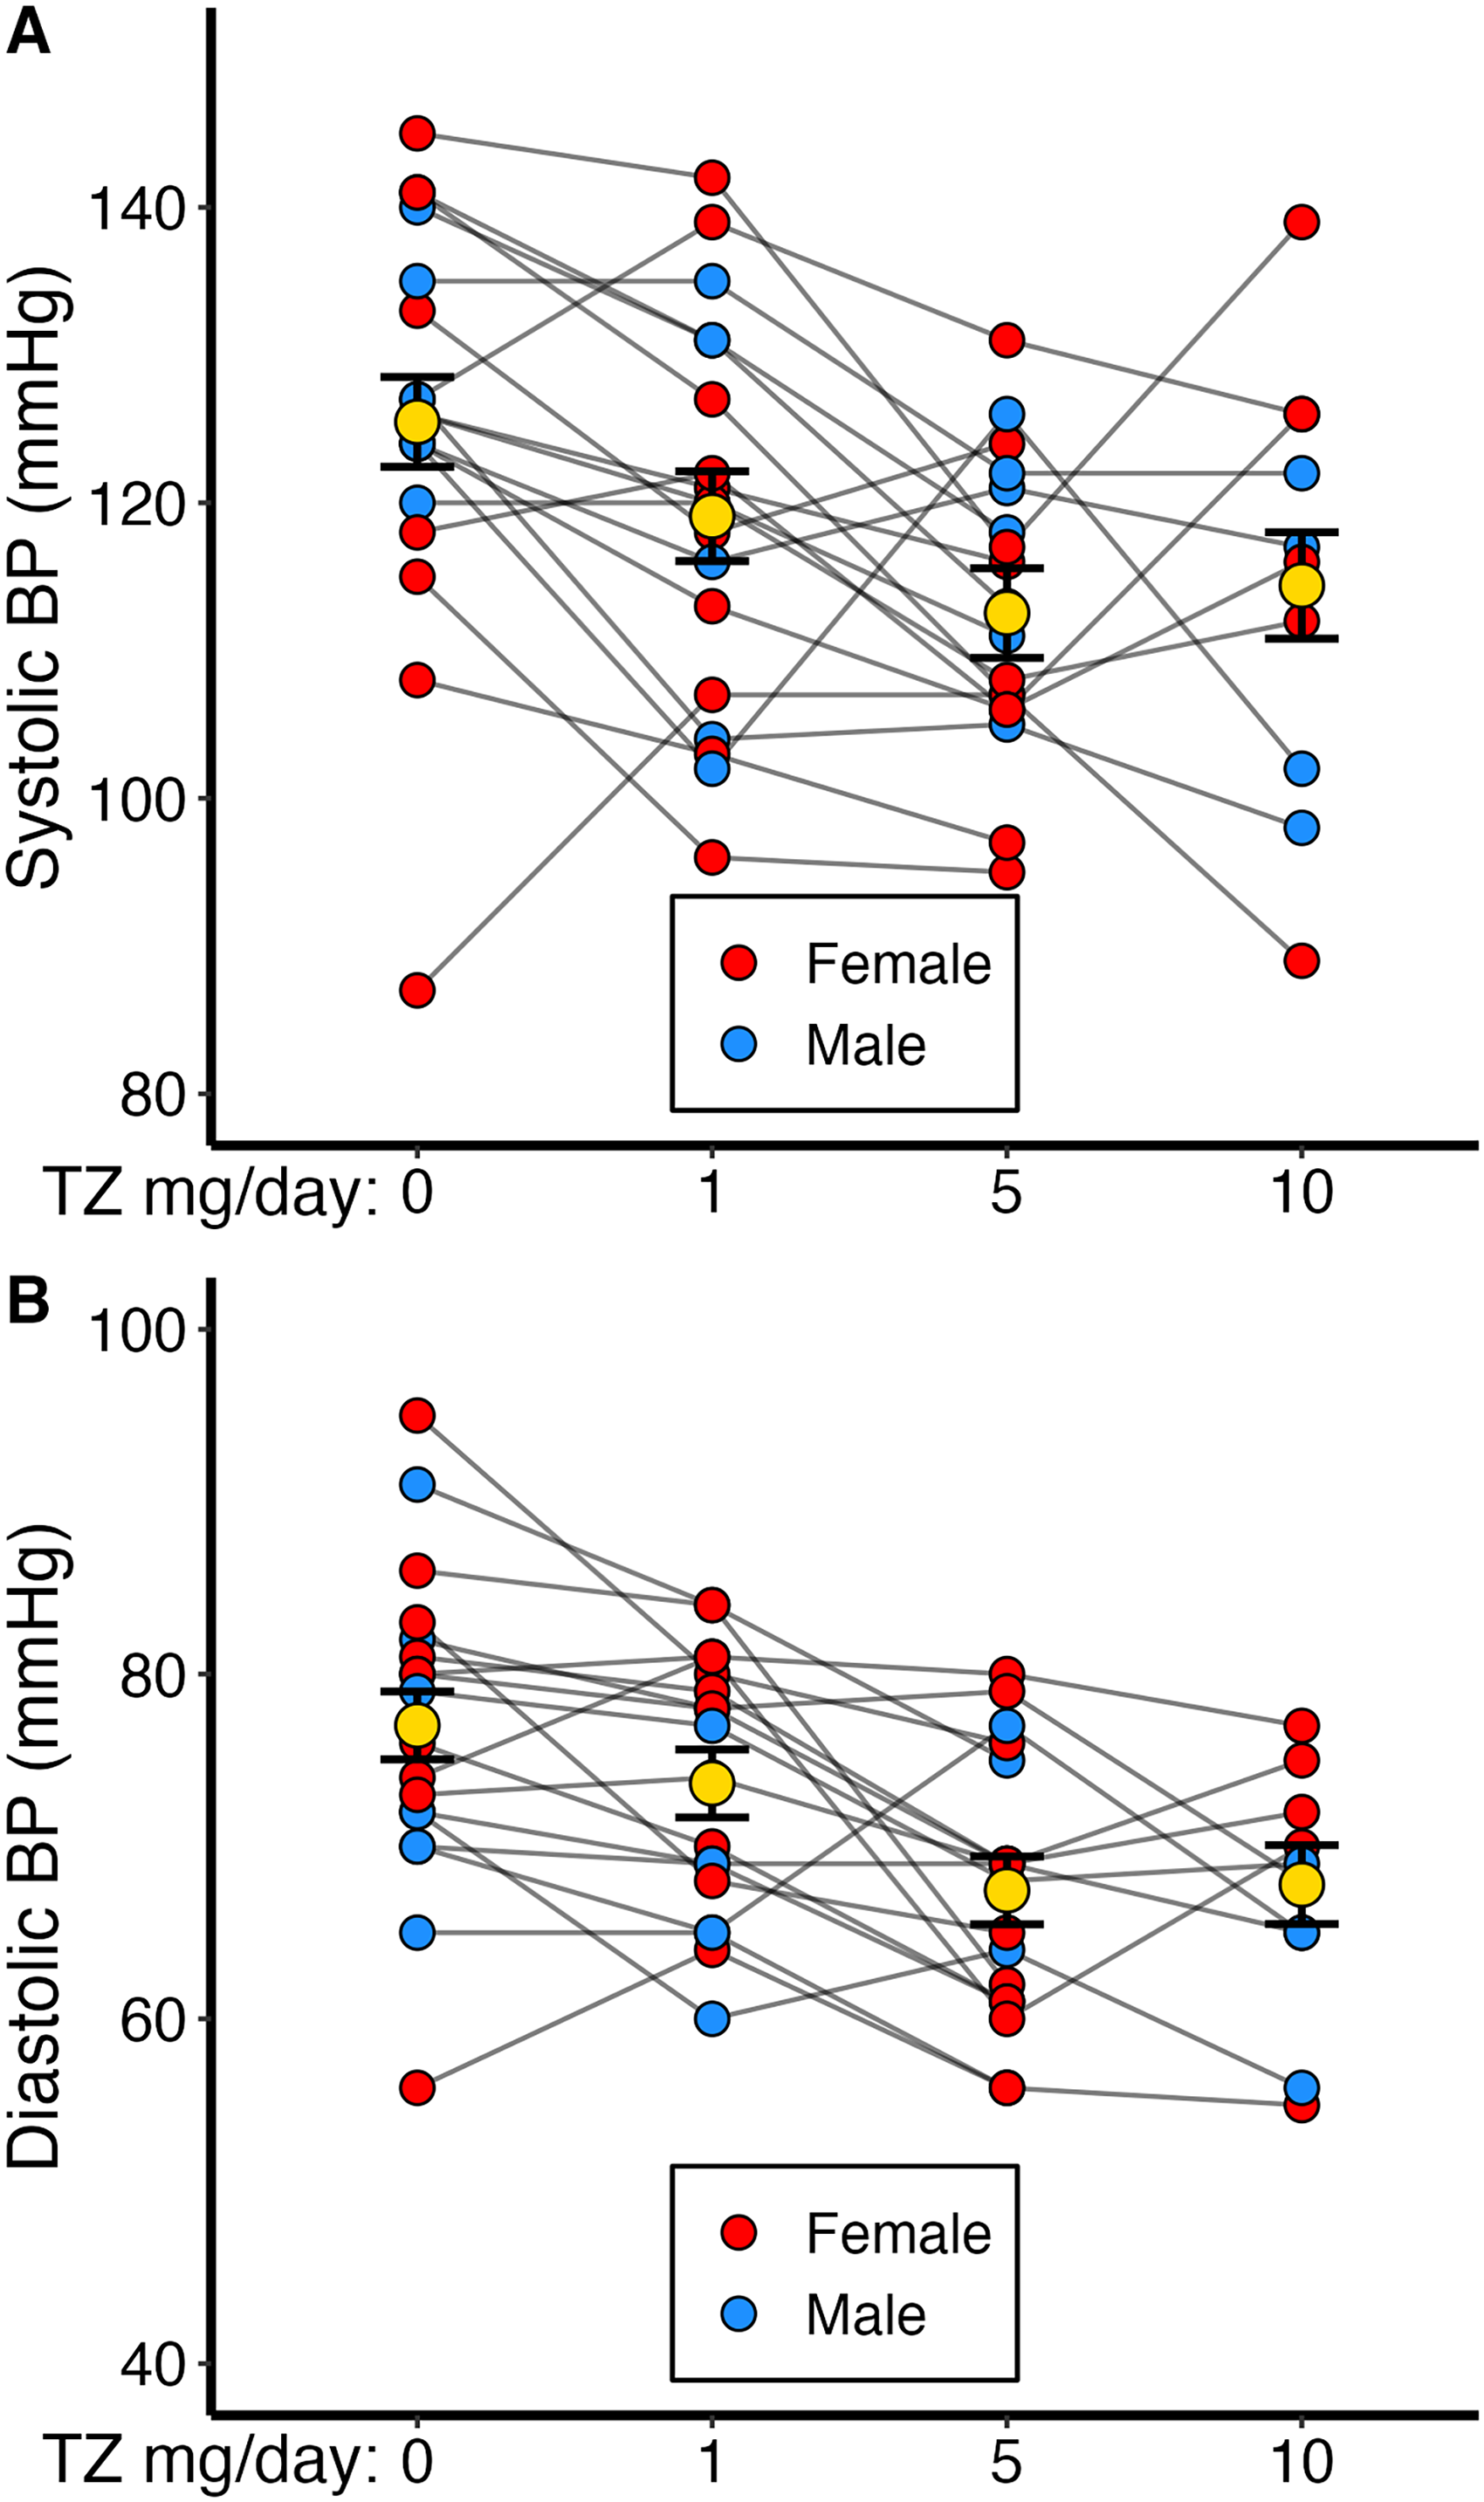
Changes in blood pressure by TZ dose. (A-B) Systolic Blood Pressure decreased from baseline at all doses of TZ. Blood pressure lowering at 5 mg/day was twice that seen as 1 mg/day. There were no differences in blood pressure lowering between 5 mg/day and 10 mg/day. Further details are outlined in Supplemental Table 2.
Two female participants taking 5 mg/day TZ and one male taking 10 mg/day TZ reported mild dizziness that did not necessitate discontinuation of the study. An 85-year-old female participant withdrew from the study when she reached a dose of 7 mg TZ because of dizziness and lightheadedness. Those four participants were in cohort B. We could discern no relationship between the report of dizziness and a history or treatment of hypertension. There were no other adverse events.
Discussion
This study indicates that TZ crosses the BBB in humans as it does in mice 34 and engages its PGK1 target in females as well as males. The quantification of ATP in whole blood samples also suggest that a dose of 5 mg/day may balance efficacy in stimulating PGK1 with the risk of orthostatic hypotension from inhibiting the α−1 adrenergic receptor.
The pharmacokinetic data revealed a linear relationship between the TZ dose and the plasma TZ concentration. The pharmacodynamic relationships were more complex. Because PGK1 is present in all cells, we measured changes in whole blood ATP to assess biochemical effects. 46 ATP levels were little changed by 1 mg/day TZ, increased at 5 mg/day, but then did not further change at 10 mg/day. This relationship aligns with earlier work; in isolated PGK1 protein and cultured cells, low TZ concentrations increase PGK1 activity, and high concentrations inhibit activity. 34 TZ also has a biphasic response in mouse brain. 34 This pattern is an inherent property of the TZ:PGK1 interaction; we recently described a molecular mechanism. 47
Importantly, there was significant variability in ATP/Hb levels both at baseline and at varying doses of TZ (Supplemental Figure 1). Despite the variability in baseline ATP/Hb levels between subjects, baseline ATP/Hb did not seem to be predictive of whether a subject would experience an increase or decrease in ATP/Hb in response to TZ.
As an indicator of TZ's effect on brain metabolism, we measured 18F-FDG PET.48,49 The results paralleled changes in whole blood ATP, but in the opposite direction: 1 mg/day TZ did not alter 18F-FDG uptake, but 5 mg/day decreased uptake, and 10 mg/day produced no further change. The data showed a decrease in average brain 18F-FDG uptake, consistent with ubiquitous PGK1 expression. Glucose transporters mediate uptake of glucose by astrocytes and neurons and are critically involved in regulatory adaptations to varying energy demands. Finding that TZ decreased 18F-FDG uptake is quite interesting because a relative increase in energy production and cellular ATP will decrease the insertion of glucose transporters into neuron and astrocyte membranes and thereby lower 18F-FDG PET uptake. 50
We measured multiple metabolites in plasma based on the possibility that we might detect a signal that would provide a non-invasive assay of TZ's effect. Unfortunately, dose-dependent changes in plasma pyruvate concentrations did not mirror our findings in whole blood ATP and 18F-FDG PET. We hypothesize that this lack of congruence between whole blood ATP and pyruvate may be explained by TZ's direct effect on PGK1. TZ binds to and increases the activity of PGK1, which can allow for greater ATP yield per glucose molecule. This will increase ATP levels while reducing glucose demand, as we observed a decrease in 18F-FDG uptake. Since PGK1 acts upstream of pyruvate, its activation does not necessarily result in a significant rise in pyruvate levels, as excess pyruvate can be efficiently metabolized or diverted to other pathways. As a result, the increase in ATP/Hb in the absence of consistent increases in pyruvate likely indicates that TZ improves glycolytic efficiency rather than simply increasing glycolytic flux. The finding that plasma pyruvate levels increased as 18F-FDG uptake fell may be consistent with the theory that TZ increased glycolytic efficiency. The production of pyruvate per molecule of glucose likely increases if TZ induced an increase in glycolytic efficiency. Additionally, increased cellular ATP levels may decrease the activity of AMP-activated protein kinase and thereby decrease glucose uptake by neurons and astrocytes. 51
In a previous pilot study, we found that 5 mg/day of TZ increased βATP/Pi in the brain as measured by 31P-MRS. 40 Our data here did not replicate those results. One potential reason is that metabolism might be impaired in PD patients but preserved in healthy controls in this study; thus, 31P-MRS measurements could be affected by a ceiling effect in this study but have more dynamic range in PD patients. Thus, TZ might more strongly affect βATP/Pi levels in PD patients who have decreased ATP levels,52–54 but not in neurologically healthy controls who have presumably normal brain ATP levels. However, it is also possible that the use of whole brain31 P-MRS is not precise enough to quantify subtle differences in ATP concentration secondary to the use of TZ.
In addition to targeting PGK1, TZ inhibits the α−1 adrenergic receptor, decreasing blood pressure and carrying the risk of orthostatic hypotension. 55 In this study, 3 of the 4 participants who developed mild dizziness or dropped out were females taking 5–7 mg/d TZ, and the male who experienced mild dizziness was taking 10 mg/day TZ. In people with PD, we found that 3 of 8 females discontinued TZ because of dizziness/lightheadedness at ≤5 mg/day, whereas none of the 5 males developed this symptom. 40 Combining these studies, symptoms associated with orthostatic hypotension occurred in 6 of 19 females and 1 of 12 males (32% vs. 8%). Symptoms associated with orthostatic hypotension are known to be more common in women than men. 41 We examined early reports describing the effect of TZ on BP and symptoms, but they did not reveal greater effects in females. 56 Nevertheless, our data, plus the presence of autonomic insufficiency in some people with PD, 57 indicate that females may be more susceptible to TZ-induced orthostatic hypotension, warranting careful attention to this potential adverse event in future trials. Interestingly, in a large epidemiological study, males with PD who were taking TZ had a decrease, rather than an increase, in diagnoses that might be attributed to orthostatic hypotension. 34
A limitation of this work is that we studied neurologically healthy participants, and the biochemical and physiological responses to TZ and adverse events might differ in people with PD. On the other hand, our data may have applicability for additional neurodegenerative diseases that also exhibit impaired brain bioenergetics, including those that have shown TZ efficacy in pre-clinical models of Alzheimer's disease, 58 amyotrophic lateral sclerosis, 59 and spinal muscular atrophy, 60 and epidemiological suggestion of efficacy in Lewy body dementia. 61 Another limitation is the short duration of this study. Longer duration investigation is required to investigate biochemical responses and safety. Lastly, we did not demonstrate significant changes in cerebral ATP as measured by 31P MRS in response to TZ as we had shown previously in patients with PD. 40 We hypothesize that this may be due to metabolic differences between patients with PD and neurologically healthy individuals, but this study was unable to test that hypothesis.
These findings suggest that TZ induces responses in humans that are consistent with data obtained in multiple cell and animal models. 34 First, they show an increase in whole blood ATP suggesting PGK1 activation and an increase in energy metabolism. Second, they show decreased brain 18F-FDG uptake, a known response to increased ATP levels and energy metabolism. Third, they show that an increase in levels of pyruvate (a product of glycolysis) was associated with decreased 18F-FDG uptake. Fourth, they show that TZ crosses the BBB, and that females and males have a similar metabolic response to TZ. Fifth, they show that both whole blood ATP and 18F-FDG PET had a similar dose-response relationship: no effect of 1 mg/day, a response to 5 mg/day, and no further response to a higher dose.
What this study does not show is direct evidence that TZ slows or prevents neurodegeneration in human PD; that will require randomized clinical trials in people with PD. However, these results lay the groundwork in terms of safety issues, doses of TZ, and assays of target engagement. Such a study in humans would also provide a unique opportunity to correlate clinical and biochemical responses to TZ and provide insight into fundamental mechanisms.
Supplemental Material
sj-docx-1-pkn-10.1177_1877718X251356503 - Supplemental material for A dose-finding study shows terazosin enhanced energy metabolism in neurologically healthy adults
Supplemental material, sj-docx-1-pkn-10.1177_1877718X251356503 for A dose-finding study shows terazosin enhanced energy metabolism in neurologically healthy adults by Jordan L Schultz, Phillip E Gander, Craig D Workman, Laura L Boles Ponto, Stephen Cross, Christopher S Nance, Christopher L Groth, Eric B Taylor, Sarah E Ernst, Jia Xu, Ergun Y Uc, Vincent A Magnotta, Michael J Welsh and Nandakumar S Narayanan in Journal of Parkinson's Disease
Footnotes
Acknowledgements
The authors have no acknowledgments to report.
ORCID iDs
Ethical considerations
This study was approved by the Institutional Review Board at the University of Iowa (IRB# 202005461 on 12/04/2020; NCT: 04551040).
Consent to participate
All participants signed informed consent documents prior to enrollment.
Consent for publication
All participants consented to the data from these studies to be published, including their deidentified information.
Funding
This study was funded by the Michael J. Fox Foundation for Parkinson's Research (to JLS and NSN), NIH Grant 5UL1TR002537-04 through the University of Iowa Institute for Clinical and Translational Science and was conducted using equipment supported by NIH Grant S10RR028821, and NIH Grant K23NS117736 (to JLS). MJW is an investigator of the Howard Hughes Medical Institute. The study sponsors had no role in the conduct, analysis, or reporting of these results.
Declaration of conflicting interests
The authors declared no potential conflicts of interest with respect to the research, authorship, and/or publication of this article.
Data availability statement
Deidentified participant data will be made available upon reasonable request to the corresponding author.
Supplemental material
Supplemental material for this article is available online.
References
Supplementary Material
Please find the following supplemental material available below.
For Open Access articles published under a Creative Commons License, all supplemental material carries the same license as the article it is associated with.
For non-Open Access articles published, all supplemental material carries a non-exclusive license, and permission requests for re-use of supplemental material or any part of supplemental material shall be sent directly to the copyright owner as specified in the copyright notice associated with the article.